June has arrived, and according to the Great White Con Arctic sea ice calendar that means the summer surface melting season has started. Once July arrives bottom melt should have started in earnest too, but for now let’s stick to the surface. Here’s the Climate Reanalyzer map of Arctic surface air temperatures at 06:00 UTC this morning:
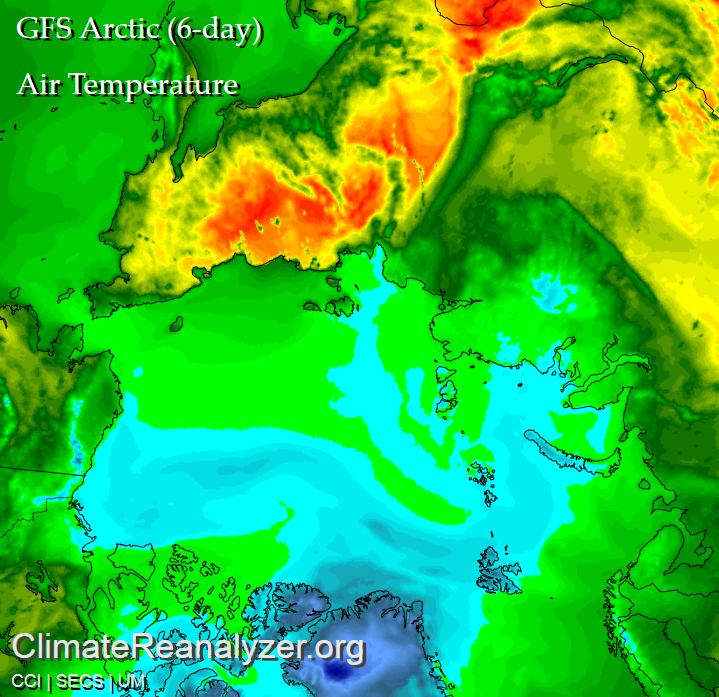
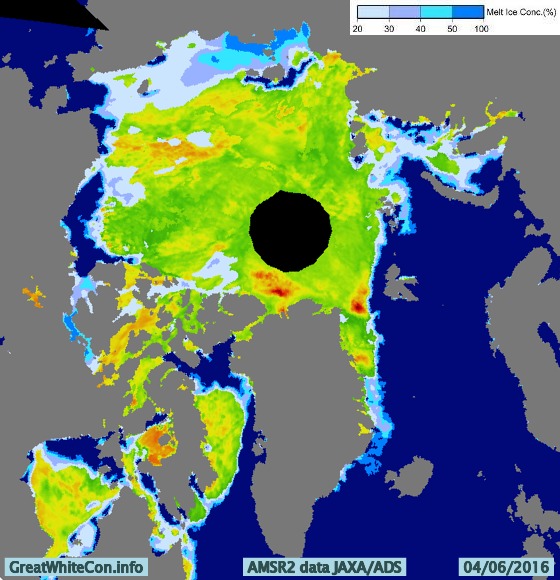
Green areas are above 0 degrees Celsius, and bear in mind that the melting point of sea ice is at around -1.8 degrees Celsius. The red areas near the East Siberian Sea coast are 25-30 degrees Celsius. Given those sort of temperatures you might well think that some snow and/or ice in that area would be melting, and you would be correct! Here is the Japan Aerospace Exploration Agency’s current map of Arctic surface melting:
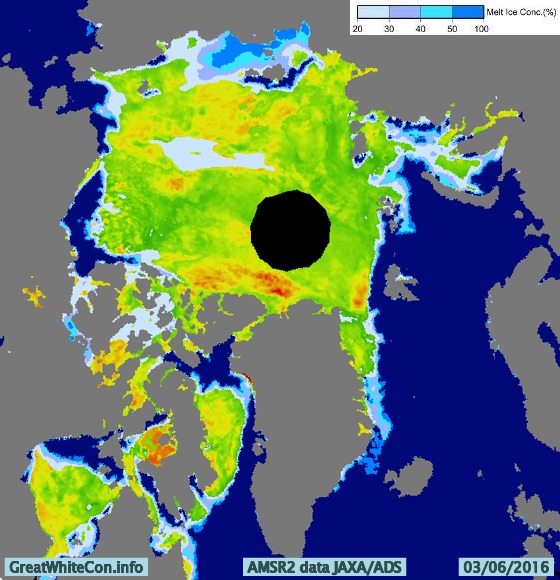
The assorted shades of blue/grey show the areas where surface melting is already underway. Whilst this melting is taking place you may possibly read in some quarters of the cryodenialosphere that “There is almost no melting going on in the Arctic“. The authors of such nonsense evidently don’t know their proverbial Arctic arse from their elbow.
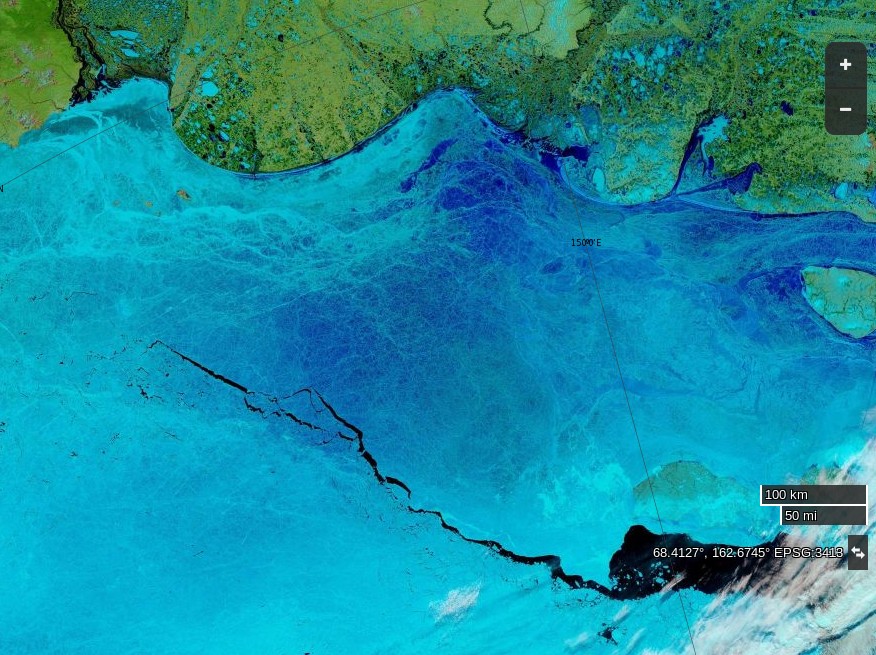
Here’s how today’s surface melting in the East Siberian Sea looks from space:
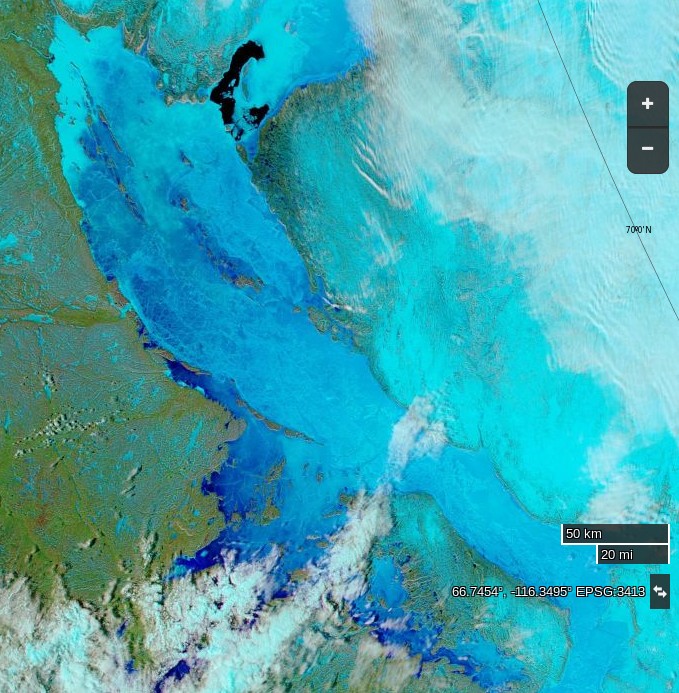
Meanwhile over on the other side of the Arctic, here’s yesterday’s surface melting on “Amundsen’s Route” through the Northwest Passage:
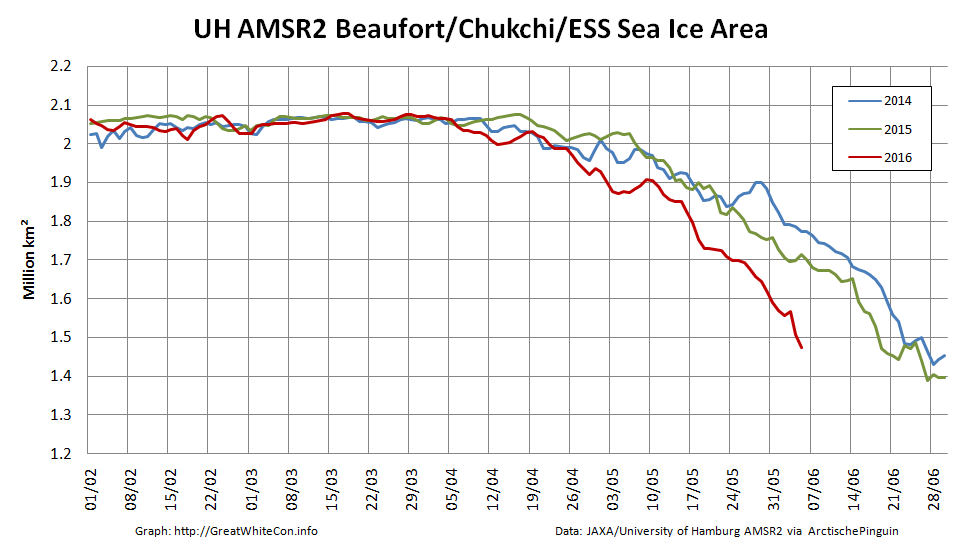
By way of further illustration of the fact that Arctic sea ice is and has been melting, here is a graph of the current area of sea ice in the all important central area of the Arctic Basin, courtesy of “Wipneus” at Arctische Pinguin:

The areas included are the Central Arctic Basin, plus the Beaufort, Chukchi, East Siberian and Laptev Seas. The above zero temperatures are forecast to spread across the Central Arctic Basin early next week, whereupon it will be very interesting to discover what happens to the snow around the single ice mass balance buoy currently transmitting near real time data. Here is the current temperature profile for the sea ice underneath IMB buoy 2015F:
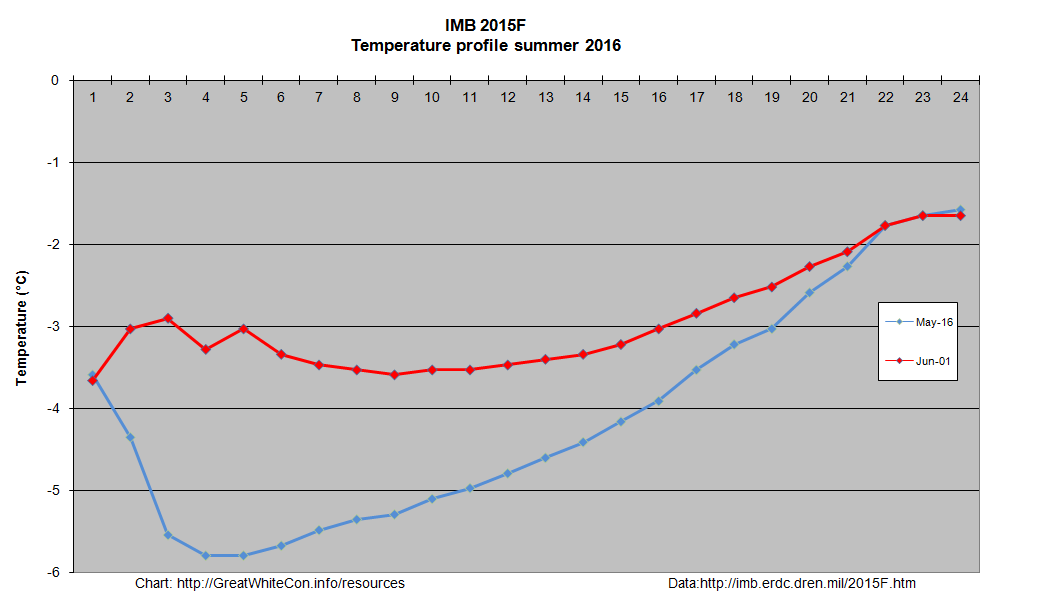
The current conditions there are summarised this morning as:
Pos: 82.00 N, 147.45 W
Air Temp: -3.74 C
Air Pres: 1007.42 mb
Snow depth: 21 cm
Ice thickness: 202 cm
Normally by now there would also be a number of webcams beaming back pictures from across the sea ice in the Arctic Basin. However according to NOAA:
Due to funding constraints, it was not possible to deploy new Web Cams in Spring 2016, but deployments in Spring 2017 are planned.
Three of the camera carrying O-Buoys also seem to have failed over the winter, which leaves us with only O-Buoy 14 to reveal the forthcoming melt to us:

O-Buoy 14 is currently colocated with Ice Tethered Profiler 89, the yellow object in the foreground, at 77.49° N, 153.92° W, to the north of the Beaufort Sea. ITP 89 measures the temperature and salinity of the water beneath the sea ice and revealed this the last time it managed to take a measurement, a month or so ago:

If you examine the extreme right hand edge of the charts carefully you will no doubt note that the water underneath the ice has recently become both warmer and saltier.
Watch this space!
The latest JAXA/ADS map shows that the area of sea ice undergoing surface melting has increased since yesterday, particularly over the Chukchi Sea:
The recent clouds over the Beaufort Sea cleared yesterday. Here’s a close up view of the open water between the big floes from the Suomi satellite:
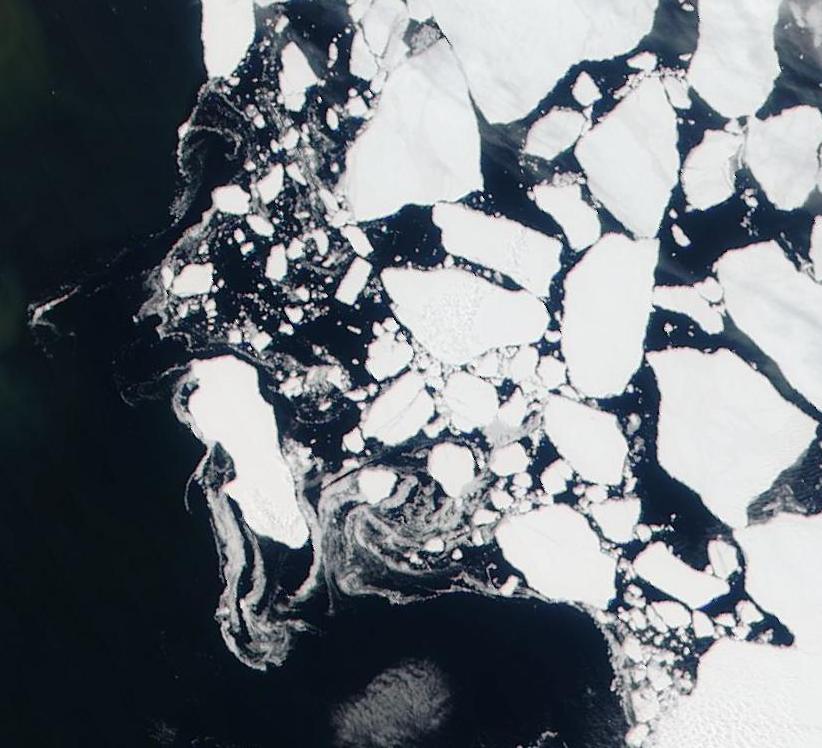
For a more distant perspective see our Summer 2016 image archive.
It’s not simply the surface that’s melting either. Here’s the latest “high resolution” AMSR2 sea ice area graph for the Pacific side of the Arctic:
Thanks for this, Jim. Great stuff .
I’ve been trying to analyze what’s happening to the profile taken by the buoys but it’s hard to make sense of the big picture with so few working buoys. Note the drift track of ITP89 takes it from very deep water in the Beaufort to the much shallower Chuchki platform. The water mixing appears to be taking place near the platform edge. This makes sense.
Note that the ITP changed direction in April to parallel the platform edge. Something very interesting is happening but we have very poor sampling of it.
I assume you’re referring to the “Chukchi Plateau“, and more specifically the Northwind Ridge?
Here’s the track of ITP 89 viewed in Google Earth:
and here’s some bathymetry of the Northwind Ridge
Is it conceivable that the profiler ground to a halt because the buoy drifted over an area of the ridge less than 700 meters deep?
Yes, and please ignore my bad spelling of names. I don’t know what happens to a long tethered buoy when it moves into shallow water but many of the possible outcomes are not good.
What’s clear to me is that a ridge in that position will force ocean mixing when there are pesteringly persistent easterly winds along Alaska’s north slope. And there are recent research papers on this problem based on years that were nowhere near this one in the strength and persistence of the easterly winds in April and May.
Your blog is read by a very select group of people. It’s very helpful to those of us who are trying to keep up with the rapid rate of Arctic change. Thanks.
Do you have any links to those “recent research papers” George? I dug up this one, which is not exactly recent:
https://www.whoi.edu/beaufortgyre/pdfs/2008JC005001-pip.pdf
It suggests things are rather complicated in the vicinity of the Northwind Ridge!
The final conclusion:
A conundrum,
sea ice is fresh water? so should melt at 0 degrees Celsius?
The freezing point of sea water is -1.8 degrees Celsius.
Am I correct?
The salt content of sea ice depends on how old it is. The sea water under the sea ice is not “fresh water”!
For empirical data on melting sea ice you might like to take a good look at last summer’s ice mass balance buoy data. Here’s just one of them – 2014I on multi year ice:
You will note that bottom melt takes place at temperatures well below 0 degrees Celsius.
And note that the strong winds and rapid movement this spring will have reduced stratification and will keep the upper water layers mixed so that when the melt ponds show up on top of the ice, bottom melting will be underway. This winter was very poor for building up new ice in the Beaufort.
Question regarding the JAXA ADS map colors: red may mean thicker ice, but there are places where that doesn’t apply. What could be reasons for that, and does it generally show thicker or thinner ice compared to what really is there?
I think it’s fair to say that the ADS thickness/melt map is a “research” rather than “operational” product. I’m happy to give the melt side of things some credence when I can verify the blue/grey areas on the map with my own eyeballs (see above).
However I suggest taking the thickness estimates with a large pinch of sea salt for the moment. They often vary considerably between the ascending and descending orbits for example, which seems physically rather unlikely!
Correction of factual point. The melting point of sea ice is not -1.8 C as asserted by Jim Huntil but 0 C. He is confusing the freezing temp with the melting point, which are different. When sea water freezes it must be colder than 0 C because of salt. But when water actually freezes, the salt is pushed out and the frozen ice is just ice that melts at 0 C.
John – A correction of a factual point. Can you see the empirical data in my graph above? Here it is again:
Did you note the bottom melt that took place at temperatures well below 0 degrees Celsius? If not would you like me to explain further?
Your commenter missed the little problem of the saltwater/ice interface on the base of the ice. The figure tells you the melting temperature, of course.
Quite so. Even as we speak bottom melt has started below IMB buoy 2015F. The temperature of the salty water under the ice is currently ~ -1.5 °C: