No sooner has one of the usual suspects claimed that “Arctic Sea Ice Holds Firm” than a few more jump on the same bandwagon. The Global Warming Policy Forum have republished almost the whole of an article penned by our old friend Paul Homewood entitled “More Of The Usual Hype About Arctic Ice“. According to Paul (and Benny):
Far from collapsing, Arctic sea ice area has been remarkably stable in the last decade
He illustrates his point using a slightly different version of the Cryosphere Today Arctic sea ice area anomaly graph employed by Andrew Montford on March 29th. Here’s the latest version:
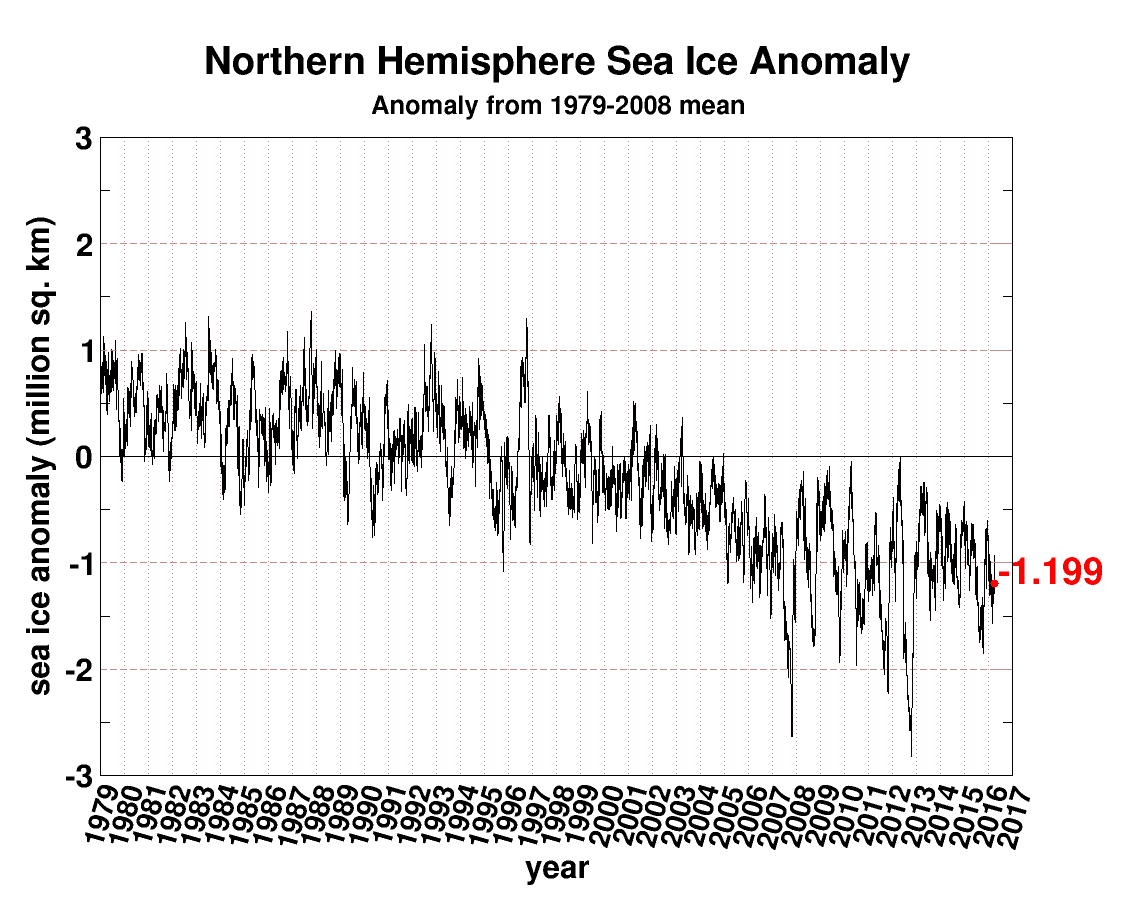
For some strange reason Paul (and Benny) neglect to mention that the current anomaly of -1.199 million square kilometers is the most negative it has ever been for the day of the year in the entirety of the Cryosphere Today record going back to 1979. They also neglect to mention that the CT anomaly is typically much larger in summer than in winter, and that despite that fact the CT anomaly never fell as low as -1.199 at any time of year until 2006.
Make sure to follow the first link above for much more on anomalously misleading area graphs. However Paul (and Benny) are not content with just one misleading interpretation of an anomaly graph. The article continues:
With multi year ice continuing to recover from 2008 lows, ice volume has also been growing in the last few years.
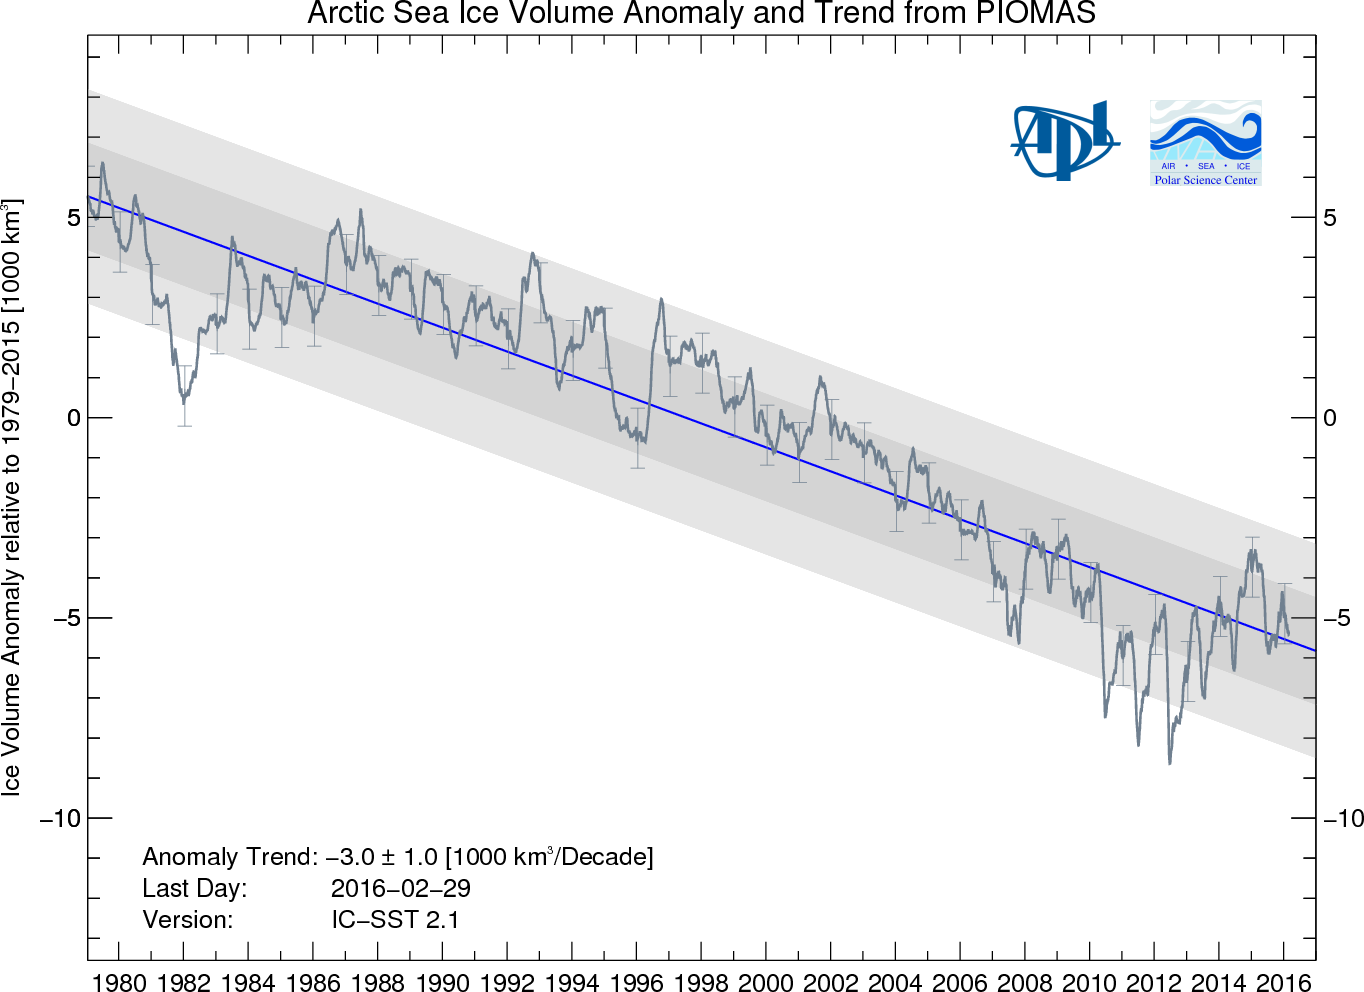
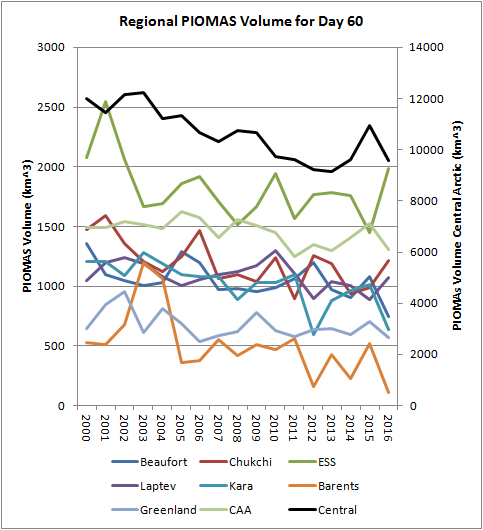
Whilst we all eagerly await the release of the PIOMAS Arctic sea ice volume numbers for March 2016, here is an alternative visualisation of the data from Chris Reynolds:
Volume is the second lowest on record [for February] since 1978 at 20.660 thousand km cubed
In the Central Arctic, where it matters most, sea ice volume at the end of February was only a whisker above where it was in 2012, according to PIOMAS at least. For those with short memories the CT Arctic sea ice area metric reached an *all time low of 2.23401 million square kilometers on September 13th 2012, and an *all time low anomaly of -2.81817 million square kilometers on October 14th 2012.
*Since the Cryosphere Today records began
As our regular reader(s) will have already suspected, since the GWPF are peddling Arctic porky pies once again I felt an uncontrollable urge to send a virtual missive to Benny Peiser once again. Here it is:
https://greatWhiteCon.info/2016/02/the-great-global-warming-policy-forum-con/#2016-04-04
The waiting is now over, since the March daily PIOMAS numbers have been released:
2016 Day 91 – 22.337 thousand kilometres cubed
Compare and contrast with:
2011 Day 91 – 22.197 thousand kilometres cubed
2012 Day 91 – 22.913 thousand kilometres cubed
2016 is therefore currently still in second place behind 2011. Since records began of course.
Here is the latest PIOMAS sea ice thickness plot:
Does it look as though it’s “holding firm” to you?
These people (count on the fact that most people) don’t know how anomalies work.
This is going into my ‘Remember who lied to you’ bookmarks folder. Thanks, Jim.
Our pleasure Neven.
Snow White has a little black book (LBB for short) like that too. Here’s the edited highlights, in order of appearance:
https://greatWhiteCon.info/tag/david-rose/
https://greatWhiteCon.info/tag/christopher-booker/
https://greatWhiteCon.info/tag/judith-curry/
https://greatWhiteCon.info/tag/tony-heller/
https://greatWhiteCon.info/tag/anthony-watts/
https://greatWhiteCon.info/tag/paul-homewood/
https://greatWhiteCon.info/tag/gwpf/
https://greatWhiteCon.info/tag/andrew-montford/
No doubt there’s a few more we’ve anomalously neglected.
Here’s the PIOMAS gridded thickness map for March 31st 2016, courtesy of “Wipneus”:
and here’s the CryoSat 2 equivalent:
Here’s Andy Lee Robinson’s PIOMAS “Arctic Death Spiral” updated to March 2016:
The latest edition of the NSIDC’s Arctic Sea Ice News & Analysis has now been published:
March ends a most interesting winter
The GWPF offered no evidence for their “multi year ice continuing to recover from 2008 lows” assertion. That’s because there is no such evidence. According to the NSIDC:
Not surprising that very old ice is at a low, given the 2012 Summer low point that got rid of a substantial amount. However, unless summer 2016 matches that low (jury still out) then there may be 2 and 3 year ice building to eventually replace loss of 5 year ice. Freezing of Beaufort open leads with 1st year ice puts an interesting twist on this year’s minimum, but so does potential slide into La Niña conditions later in the year. All around, will be an interesting season – any predictions yet?
Yes Taylor.
It all depends on the weather over the next 6 months, which is not very easy to predict! Try asking me again in June.
I will however predict with high confidence that Prof. Peter Wadhams won’t increase the SIPOG predictions for this year’s Arcus sea ice outlook.
In order to build up 5 year ice, you need some combination of five years of cold weather around the periphery of the arctic and wind conditions that keep the ice from blowing out to the periphery. Thinner ice is more mobile ice. Mobile ice has a hard time avoiding the hot spots. 2015 kept the amount of old ice low without being another 2012.
Predictions? Sure. Summer 2016 will see less ice than Summer 2015.