Christopher Booker has raised the stakes in the “ClimateGate 2.0” edition of ClimateBall™ in his article in this morning’s edition of the Sunday Telegraph:
It was only the adjusted surface records which showed 2014 to have been “the hottest year on record”. The other two official records, based on satellite measurements, which only go back to 1979, show nothing of the kind.
The international fallout from my two articles has been huge. The second, headed “The fiddling of temperature data has been the biggest science scandal ever”, scored a record 30,000 comments on The Telegraph website. But what is particularly telling has been the silence of GHCN and the compilers of the other surface records in response to requests from Homewood and others for a proper explanation of how and why they had needed to make so many adjustments to the original data.
What is now needed is a meticulous analysis of all the data, to establish just how far these adjustments have distorted the picture the world has been given. Although I cannot yet reveal any details, I gather that a responsible foundation is gathering an expert team to do just that. If the results confirm what has already been unearthed by Homewood and other analysts, from the US to New Zealand, this may indeed turn out to have been the greatest scandal in the history of science.
He is apparently being aided and abetted in his latest outlandish bid by BBC Radio 4 News, who reported on his article as follows in their 07:07:25 review of the Sunday newspapers this morning:
Christopher Booker in the Sunday Telegraph demands a meticulous analysis of the data used to justify the claim that last year was the warmest on record, something he suggests could turn out to be one of the greatest scandals in science. He says a growing number of experts around the world have found that the raw data originally gathered by weather stations was comprehensively adjusted to justify the claim.
This is of course all spectacularly shoddy science (SSS for short) by Homewood, Booker et. al. , as we informed Ian Marsden at the Telegraph Group after Booker’s previous climate bluff was trumped by a long list of climate scientists, who have in fact been anything but “particularly silent” this time around. By way of example, since Ian Marsden evidently hasn’t watched this video yet, here once again is a video by a scientist who has studied such matters, which explains the truth:
Next I called the Beeb’s complaints number (03700 100 222 – 24 hours, charged as 01/02 geographic numbers) and told Rachel that I wished to register a complaint. I manfully resisted the temptation to emit any expletives, and informed her that the BBC’s apparent belief that Mr. Booker’s article provides some sort of “scientific balance” to Ed Milibands remarks about the need for UK plc to up its “climate change” game is so utterly ludicrous that words had totally failed me.
Rachel wondered if I was talking about this morning’s edition of “Broadcasting House“. I assured her I was not, but it sounds as though I now ought to go away and listen to that from cover to cover!
It’s now the morning of Monday February 23rd 2013. I haven’t received the email confirmation from the BBC that Rachel promised me yet, so…..
I’ve also just spoken to Ian Marsden of the Telegraph Group once again. He assures me that my complaint about a previous article by Christopher Booker is being dealt with, and suggests that I file another one to ensure that I have “a proper audit trail” in this instance as well.
An IPSO complaints officer suggests following up our previous complaint via said complaints form, so….
I called Ian Marsden, managing editor at the Telegraph Media Group, earlier this week and informed him that I wished to register a complaint about some of their content. Ian told me that in the shiny new world of the Independent Press Standards Organisation the first thing I would need to do is fill in a form. That is what I have just done:
As I mentioned in my telephone conversation with Ian Marsden, this article is so full of scientific inaccuracies that it’s hard to know where to begin, and what actions The Telegraph could take that would be sufficient to correct the incredibly misleading portrayal of the underlying science.
As Ian is well aware, my particular specialisation is the Arctic, so let’s start there. Booker starts off:
“New data shows that the ‘vanishing’ of polar ice is not the result of runaway global warming”
What “new data”? There is none!
He goes on to say “Homewood has now turned his attention to the weather stations across much of the Arctic, between Canada (51 degrees W) and the heart of Siberia (87 degrees E). Again, in nearly every case, the same one-way adjustments have been made, to show warming up to 1 degree C or more higher than was indicated by the data that was actually recorded.”
That’s “old data” and the statement is inaccurate. Have you heard of Steven Mosher? The author of “Climategate – The Crutape Letters”? He tells me:
“Looking at some maps I have of the Arctic It looks to me like we “cool” the Arctic. That is but for our adjustments the raw data would show a warmer arctic. I’ll try to check that in detail.
The Homewood approach (and by extension Delingpole and Booker) is pretty simple. Look for stations that are warmed and complain. Of course, he fails to look at the entire picture, fails to look at the large parts of Africa (20% of the globe) that our algorithm “cools”.
By looking at the whole we know that the scientifically interesting result (the world is getting warmer) STANDS. it stands with adjustments. It stands with no adjustments. Any local detail that may be wrong or questionable is not material to this conclusion.”
Here’s a video by a scientist who has studied such matters, which explains the truth:
Watch it, check the inaccuracy of Booker’s statements for yourself if you so desire, then get back to me. I’ll be more than happy to go through all the other inaccurate and misleading statements in the article once you have attempted to justify this one.
As you are aware, climate change is a complex and controversial topic. A newspaper is not a scientific journal, and is not required to represent all the possible shades of evidence and interpretation that might have a bearing upon any given topic.
This is clearly an opinion article and identifiable as such. Against the background described above, readers can be expected to understand that any evidence offered is almost certainly contestable. It follows that in an opinion article of this nature only the most egregious inaccuracy could be significantly misleading. None of the points you raise qualify as such.
The phrase ‘new data’ is readily understandable, in context, as meaning the new study into existing Arctic weather station data undertaken by Paul Homewood, which is the focus of the article.
You say that Homewood’s analysis is ‘inaccurate’, and seek to prove this by reference to the work of others. The existence of contrary views and interpretations does not negate Christopher Booker’s right to describe Homewood’s findings and comment upon them. There is nothing in the points you raise that would engage the terms of the Editor’s Code of Conduct.
I trust this is of some assistance.
Yours sincerely
Jess McAree | Head of Editorial Compliance
Us:
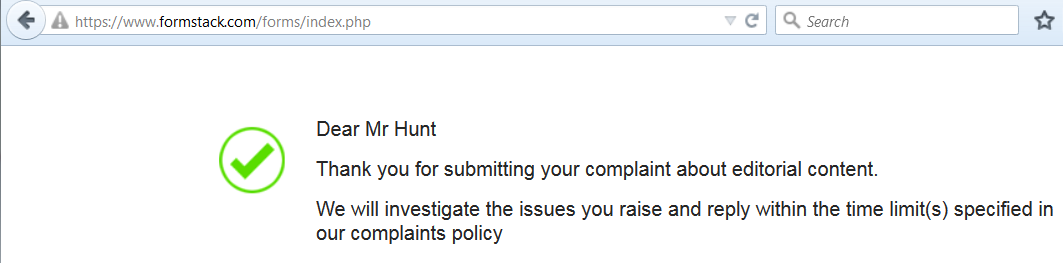
Jess McAree’s email didn’t include a telephone number, so I called The Telegraph’s switchboard (on the morning of February 24th). They told me “He doesn’t take calls”. I persisted and they put me through to Andy, who assured me that whilst Mr. McAree was currently in a meeting he would tell him that I had called as soon as he emerged. Whilst waiting for a call back I registered another complaint via The Telegraph’s online form, this time checking the “Opportunity to reply” box:
This is a supplementary note to my original complaint of February 13th 2015, a copy of which is available online here:
It is now 11:30 on February 24th 2015. I spoke at length to Ian Marsden yesterday, and for some strange reason he didn’t mention Jess McAree’s email of the 20th inst. to me. Does the left hand at The Telegraph not know what the right hand is doing? I pointed out to Ian that your complaints policy states:
“We aim to acknowledge your complaint within 5 working days of receipt”
Ian reminded me about the “We aim” bit, and assured me that my complaint was being dealt with. Following the recommendation of an IPSO complaints officer I am registering this further complaint about the lack of a timely “right to reply” on what Ian referred to yesterday as The Telegraph’s “audit trail”. I shall also send a more detailed response to his email to Mr. McAree’s personal email address.
Much like yesterday I was idly browsing my Twitter feed this morning whilst simultaneously consuming my habitual Sunday coffee + BLT when news reached me that David Rose had published yet another article in the Mail on Sunday that purports to investigate “climate science”:
Perhaps due to all our sterling work here at the Great White Con extracting the Michael, it doesn’t seem to fall under the Mail’s “Great Green Con” banner anymore. The general drift is the same though, apart from that lurid title of course!
I think current ‘renewable’ sources such as wind and ‘biomass’ are ruinously expensive and totally futile. They will never be able to achieve their stated goal of slowing the rate of warming and are not worth the billions being paid by UK consumers to subsidise them.
Skipping over all the (merely rhetorical?) self-pity, let’s move on to the climate science, such as it is!
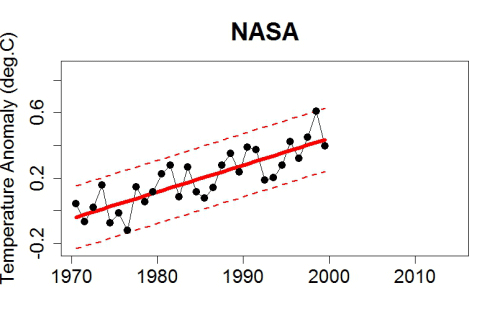
Last Monday… a Met Office press release stated: ‘2014 one of the warmest years on record globally’.
The previous week, almost every broadcaster and newspaper in the world had screamed that 2014 was emphatically The Hottest Year Ever. They did so because NASA told them so. Its Goddard Institute for Space Studies (GISS), the custodian of one of the main American temperature datasets, had announced: ‘The year 2014 ranks as Earth’s warmest since 1880.’ If you’d bothered to click on the sixth of a series of internet links listed at the end of the press release, you could have found deep within it the startling fact that GISS was only ’38 per confident’ that 2014 really did set a record.
In other words, it was 62 per cent confident that it wasn’t. Another detail was that the ‘record’ was set by just two hundredths of a degree. The margin of error was five times bigger. These boring details were ignored. The ‘2014 was a record’ claim went to the very top. President Obama cited it in his State of the Union address. Like the news outlets, it’s unlikely he will issue a correction or clarification any time soon.
Al Gore repeatedly suggested that the Arctic would likely be ice-free in summer by 2014. In fact Arctic ice has recovered in the past two years, and while the long term trend is down, it looks likely to last several more decades.
Unfortunately that is misleading and/or inaccurate, apart from the bit about the long term trend in Arctic sea ice. Hence I’ve just popped yet another Dear John (and Poppy) virtual letter to Mr. Rose’s managing editor (+PA) at the Mail on Sunday, and I’ll have yet another long chat with IPSO tomorrow:
Us:
Dear John/Poppy,
Would you believe that David Rose is at it again? Not only is he “interviewing” himself in your esteemed organ today, he is misrepresenting the underlying science yet again.
I really must insist that whoever owns the desk on which the buck currently stops for the following article starts communicating with me yesterday if not sooner:
I am away from the office until Tuesday, February 10. I will be checking emails occasionally but if your message is urgent, please contact my assistant Poppy Swann.
Ultimately followed by:
Dear Jim
If you have a complaint about last Sunday’s article, you should set out exactly what it is. If you disagree with any opinions expressed you are welcome to write a letter that we will consider for publication.
You mention that you have sent us a number of inquiries recently. The only other, to my knowledge is that you wanted to know the source of some data that David Rose mentioned in an article some months ago. David Rose told me it came from the official website. Perhaps my colleague Poppy Hall can find it for you since David is probably unwilling to help after your insult.
Best regards
John
Us:
Dear Poppy (and John)
Please would you ask David to let me know where exactly, and on which “official website”, he obtained the DMI extent numbers he quoted in his article last Summer?
FYI John, at Poppy’s suggestion I have also emailed the editorial team @MailOnline. They have yet to even acknowledge receipt of my email of January 26th.
I don’t usually get involved in debates about “the global warming pause”, but as you will eventually see there is an Arctic connection, so please bear with me. Personally I reckon “global heat” is more relevant than “global surface temperature”, but nevertheless NASA and NOAA issued a “news release” a couple of days ago stating that:
The year 2014 ranks as Earth’s warmest since 1880, according to two separate analyses by NASA and National Oceanic and Atmospheric Administration (NOAA) scientists.
The 10 warmest years in the instrumental record, with the exception of 1998, have now occurred since 2000. This trend continues a long-term warming of the planet, according to an analysis of surface temperature measurements by scientists at NASA’s Goddard Institute of Space Studies (GISS) in New York.
In an independent analysis of the raw data, also released Friday, NOAA scientists also found 2014 to be the warmest on record.
The announcement was accompanied by this video:
I figured our old friend David Rose would have something to say about all that in the Mail on Sunday, and I was not disappointed. Yesterday David reported, in bold headlines:
Nasa climate scientists: We said 2014 was the warmest year on record… but we’re only 38% sure we were right
Nasa’s Goddard Institute for Space Studies claimed its analysis of world temperatures showed ‘2014 was the warmest year on record’
But it emerged that GISS’s analysis is subject to a margin of error
Nasa admits this means it is far from certain that 2014 set a record at all
David Rose includes this NASA video in the online version of his article:
which finishes up showing the Arctic blanketed in red for the period 2010-14. In the body of the article David suggests that:
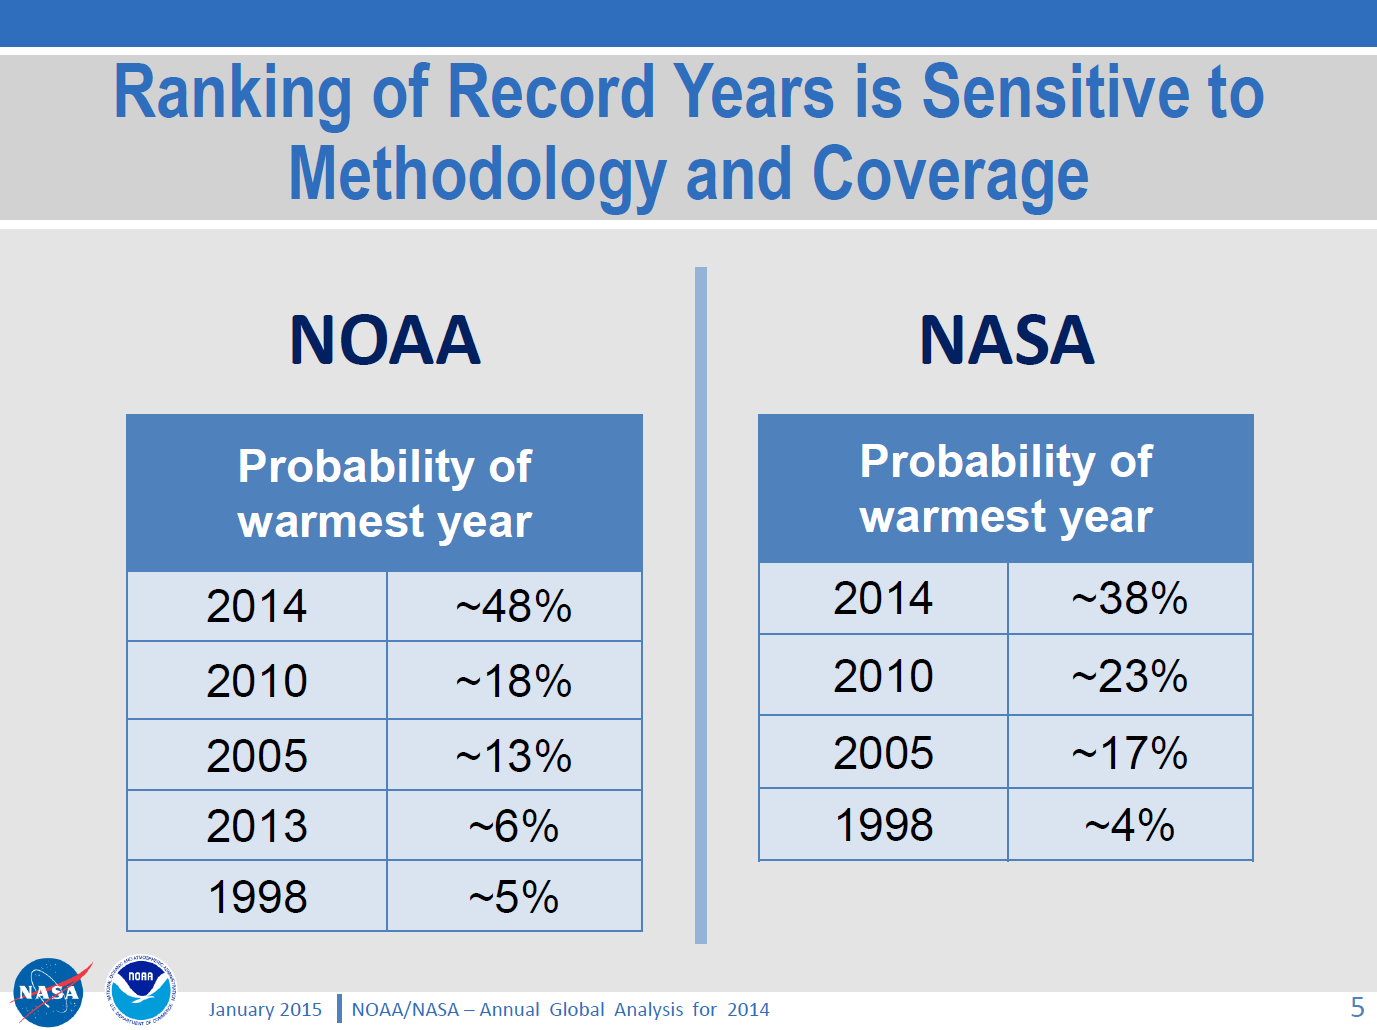
GISS’s director Gavin Schmidt has now admitted Nasa thinks the likelihood that 2014 was the warmest year since 1880 is just 38 per cent.
but for some strange reason David neglects to mention this NASA/NOAA “press briefing“, which includes the following figure:
As you can see and hear, Gavin Schmidt’s “admission” was pretty public, and available for anyone doing their due diligence on this thorny topic to see well before the Mail on Sunday published David Rose’s article. For still more from Gavin see also the second half of yet another video from NASA, which we’ve hastily made embeddable from YouTube since NASA’s Goddard Space Flight Center don’t seem to have done so themselves as yet:
[Edit – 23/01/2015]
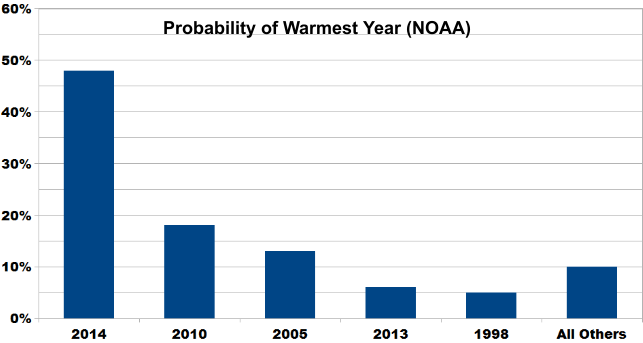
By way of further elucidation of the NASA/NOAA table of probabilities above, here’s a new graphic courtesy of Skeptical Science:
The probability of 2014 being the warmest year (due to margin of uncertainty and the small differences between years) is almost ten times that of 1998. And the contrarians were very certain that year was warm!
Does that help make things clearer, for those who evidently have difficulty understanding statistics?
[/Edit]
I also figured that the likes of “Steve Goddard” and Anthony Watts would be jumping on the same bandwagon, so you can imagine my disappointment when I discovered that they have both, unlike Gavin, blocked me from their Twitter feeds! Venturing over to the so called “Real Science” blog instead I discovered that Steve/Tony does at least read Gavin’s Twitter feed, although apparently not NASA/NOAA press briefings:
Them:
Implausible Deniability
Gavin is playing his usual game, trying to cover his ass with “uncertainty” that wasn’t mentioned in the NASA press release.
They get the propaganda out there for the White House and major news outlets, then try to generate implausible deniability through back channels like twitter. None of this was mentioned in the NASA press release.
Us:
I take it you weren’t on the call either Tony? Have you by any chance seen this press briefing?
THE DATA ON WEATHER AND CLIMATE (NASA AND NOAA) CAN BE COMPARED TO THE STOCK MARKET ON WALL STREET, MUCH CORRUPTION AND ALTERING. WE ARE NOT GUARANTEED A CERTAIN TEMPERATURE EVERYDAY; ALTHOUGH, THAT IS WHAT THEY WOULD HAVE US THINK, JUST BECAUSE OF SEASONS IN GENERAL.
Further to previous correspondence on similar matters, on January 27th 2015 I received the following email from the Personal Assistant to John Wellington, David Rose’s managing editor at the Mail on Sunday:
Dear Jim,
Thank you for your email.
I am afraid the best person to deal with your question is John Wellington who will reply on his return at the beginning of March.
Thank you for your patience.
Kind regards
Poppy Hall
Us:
CC: IPSO.co.uk
Dear Poppy,
Thanks for that information, but I am afraid my almost infinite patience in this matter is exhausted.
In John’s absence perhaps I might reiterate a question posed by Bob Ward of The Grantham Institute on Twitter yesterday:
Predictable that Mail on Sunday censored all letters pointing out errors in last week's article by @DavidRoseUK about @NASAGISS
Please would you ask whoever owns the desk on which the buck currently stops for the article entitled “Nasa climate scientists: We said 2014 was the warmest year on record… but we’re only 38% sure we were right” by David Rose to communicate with me as soon as possible. FYI – Here it is:
As I’m sure you must realise by now, unfortunately it includes some inaccurate and/or misleading statements which as far as I can ascertain have still not been publicly corrected.
Best wishes,
Jim Hunt
Post Script:
Bob Ward lodged a formal complaint with the Independent Press Standards Organisation about the Mail on Sunday article. Their conclusion?
The complaint was not upheld.
Remedial Action Required – N/A
Date complaint received: 13/02/2015
Date decision issued: 22/06/2015
Their “reasoning”?
The Committee noted that information about the margin of error had been made available by GISS, but that it was not in dispute that these details had been omitted from the press release. The article had made clear that this specifically was the basis for its criticism of Nasa, and the newspaper was entitled to present its view that this omission represented a failure on the part of the organisation. While the information had been released by Nasa, it had been released to a limited selection of people, in comparison to those who would have had access to the press release, and had not been publicised to the same level as the information in the release. The press briefing images referred to by the complainant were available on Nasa’s website, but were not signposted by the press release. In this context, it was not misleading to report that the information relating to the margin of error had emerged in circumstances where the position was not made clear in the press release. While these details of the margin of error may have been noted in a press briefing two days previously, rather than “yesterday”, as reported, this discrepancy did not represent a significant inaccuracy requiring correction under the terms of the Code.
My title today refers to the fact that the summer Arctic sea ice forecasting season is with us once again. The ARCUS Sea Ice Outlook (SIO for short) started in 2008, with the aim of gathering together and publishing “community predictions of the September sea ice extent”. The SIO is now part of the recently created Sea Ice Prediction Network, and the deadline for submission for the first set of forecasts of 2014 was June 10th.
I have a professional interest in UK and international energy policy, and as a consequence I have been commenting on the recent attempts of Professor Richard Tol to debunk the so called “97% climate change consensus” elsewhere in the blogosphere. As luck would have it I allowed myself to become engaged in what was supposedly a conversation about that very topic on the What’s Up With That blog. Feel free to read all about it if you’d like to see a pseudo-skeptical gish gallop in full swing:
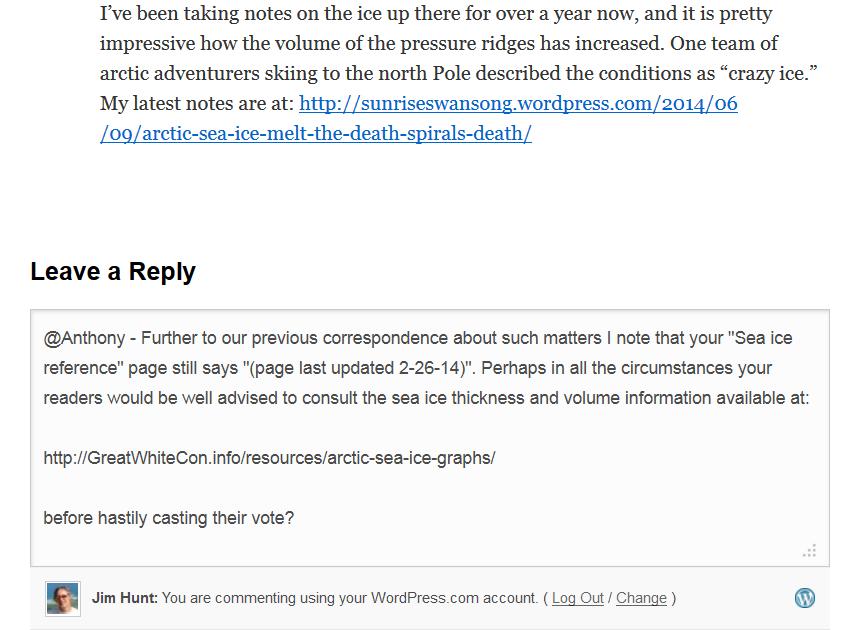
Whilst over there I couldn’t help but notice that Anthony Watts had left things until the eleventh hour before asking his faithful followers to contribute to the Sea Ice Outlook June survey. I also couldn’t help but notice that despite assurances to the contrary a few short weeks ago (and even after my recent “extra heads up“!) the WUWT “Sea Ice Reference Page” is still sadly lacking in a wide range of information about Arctic sea ice thickness and volume. Consequently I figured I would be performing a valuable public service by bringing this to the attention of Anthony and his readers. Here’s what happened after that:
Us:
Them:
June 10, 2014 at 8:55 am
[snip no, we are not going to have you thread-jack again by pushing your own website and own views – Anthony]
Us:
June 10, 2014 at 9:32 am
Re: @Anthony says: June 10, 2014 at 8:55 am
It’s not my “own views” Anthony. In fact it’s a long list of useful facts and figures for anybody attempting to forecast the future of Arctic sea ice. A long list of useful information still noticeable only by its absence from the WUWT sea ice reference page.
Them:
REPLY: We aren’t forecasting volume, we are forecasting extent, so again, your views that we should pay attention to volume graphs on your website (your favorite hobby horse) in this extent forecasting exercise are irrelevant. Don’t clutter up this thread further – Anthony.
Them & Us:
@wattsupwiththat What’s up with my “commenting style”? What’s up with my “own self” for that matter?
In the absence of a wide range of scientific information concerning the current thickness distribution of sea ice in the Arctic, and after due deliberation about the likely value of the NSIDC Arctic sea ice extent metric in September 2014, Anthony concluded:
A value of 6.12 million sq km will be sent to ARCUS.
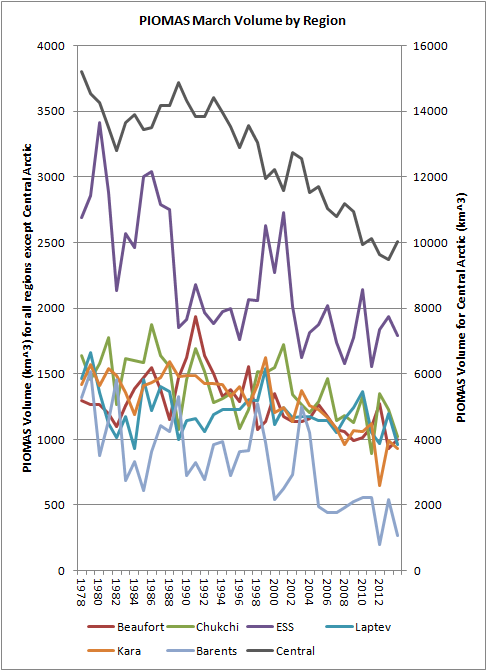
Stung by some unusually constructive criticism from Anthony Watts we have (somewhat hurriedly) added several new pages to the Great White Con “Resources” section of this web site. They contain the sort of information that is rather tricky to update automatically on a daily basis, and concentrate on resources that help the interested searcher after truth get a handle on the thickness and hence volume of the sea ice in the Arctic, on a regional as well as pan Arctic scale.
The first section is entitled “Arctic Sea Ice Graphs“, and here’s an example of one graph which reveals the ice volume in various regions of the Arctic, based on the output of the PIOMAS model:
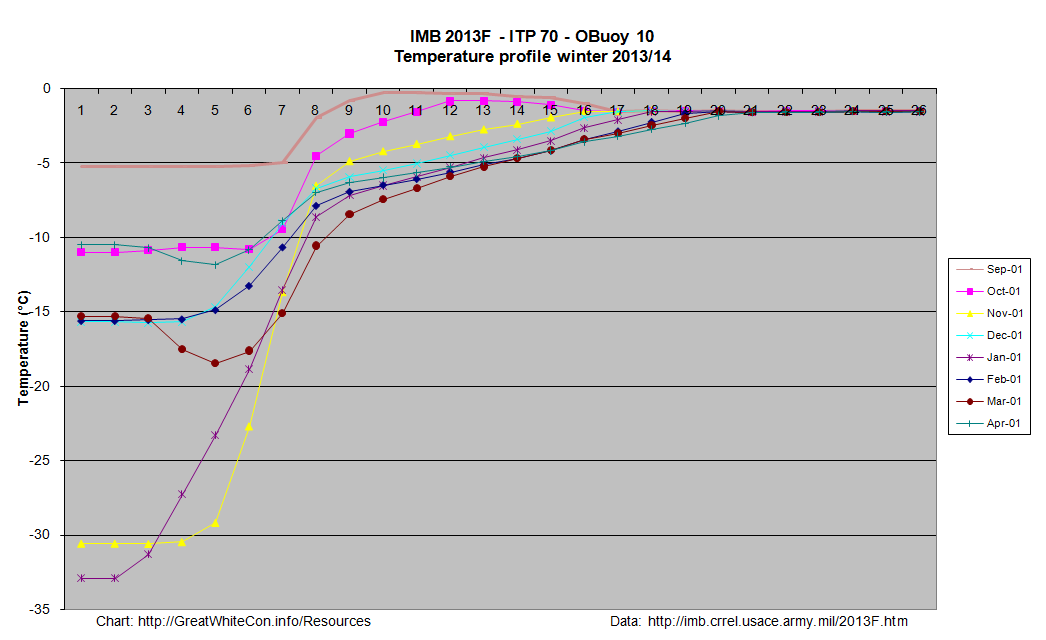
The second section is entitled “Ice Mass Balance Buoys“. As the name hopefully suggests, this section displays data reported by the Cold Regions Research and Engineering Laboratory’s currently active ice mass balance buoys in a variety of novel formats. These buoys are deployed on a regular basis at selected locations across the Arctic, and report on a number of different parameters including snow depth, ice thickness and temperature. By way of example here’s a couple of reports from IMB 2013F, which was originally deployed last August on what was then classified as “first year” ice in the Beaufort Sea. First of all here’s the Google Maps/Earth view that reveals how the buoy has moved around the Arctic since then, and shows how clicking on one of the “pushpins” reveals the values of a variety of interesting metrics on a daily basis:
Google map of the movement of IMB 2013F
As you can see, last August the thickness of the ice floe that the buoy is located upon was 1.4 metres thick. If you click through to the live map and experiment you will discover, amongst a variety of other things, that the ice under the buoy is now 1.68 meters thick, with an additional 49 cm of snow on top of that.
A second set of images shows graphs revealing the temperature above, below and within the ice, currently on a monthly basis:
Click on the graph to view a larger version. This one requires a certain amount of interpretation, but the first thing to note is that the numbers across the top represent the position of thermistors spaced 10 cm apart on a pole that is mounted vertically through the ice floe. Number 1 is in the air above the floe, the rightmost side of the graph (number 26 in this case) is in the water below the ice floe, and somewhere in between those extremes the temperature sensors can also be in the midst of either ice or snow.
At the end of March the interface between ice and snow in this case was somewhere between sensors 8 and 9, and hence at a temperature of around – 7 degrees Celsius, by which time the buoy had moved from the Canadian waters where it started into the area of the Beaufort Sea north of Alaska.
For further discussion about the interpretation of our new resources please use the comment section on the “About Our Arctic Sea Ice Resources” page. For technical observations and suggestions for improvements feel free to comment below!
This website uses cookies to improve your experience. We'll assume you're ok with this, but you can opt-out if you wish. Cookie settingsACCEPT
Privacy & Cookies Policy
Privacy Overview
This website uses cookies to improve your experience while you navigate through the website. Out of these, the cookies that are categorized as necessary are stored on your browser as they are essential for the working of basic functionalities of the website. We also use third-party cookies that help us analyze and understand how you use this website. These cookies will be stored in your browser only with your consent. You also have the option to opt-out of these cookies. But opting out of some of these cookies may affect your browsing experience.
Necessary cookies are absolutely essential for the website to function properly. This category only includes cookies that ensures basic functionalities and security features of the website. These cookies do not store any personal information.
Any cookies that may not be particularly necessary for the website to function and is used specifically to collect user personal data via analytics, ads, other embedded contents are termed as non-necessary cookies. It is mandatory to procure user consent prior to running these cookies on your website.