Tag Archives: Sikuliaq

September Arctic Cyclone Alert!

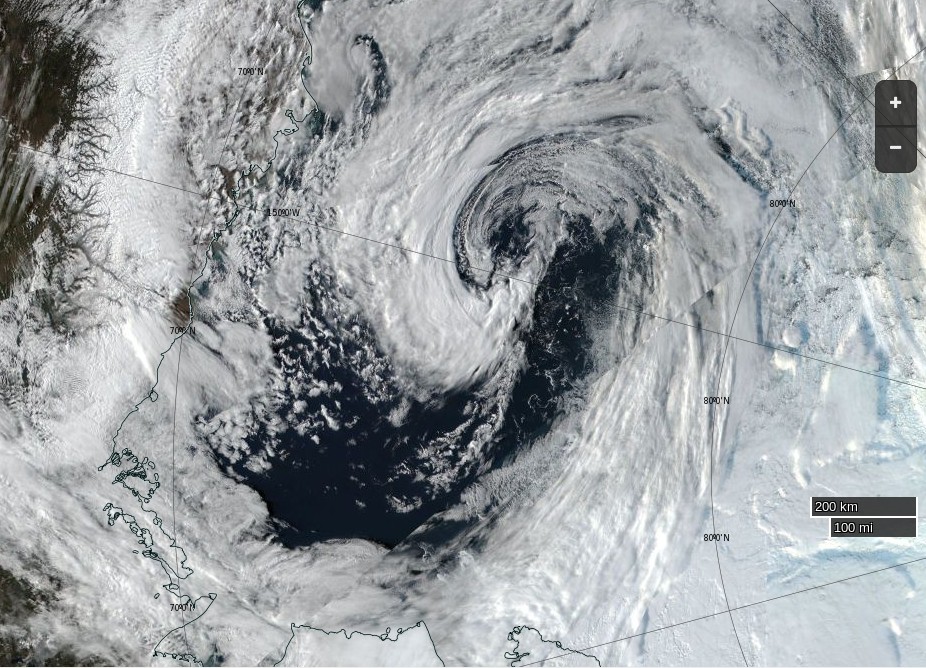
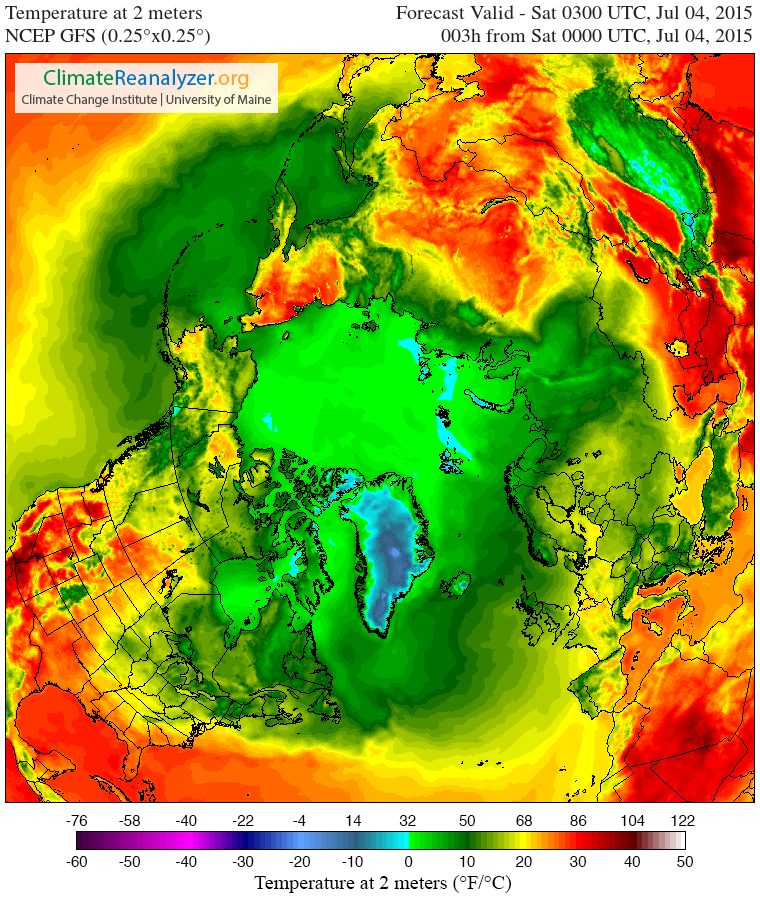
The Central Arctic has of course already been battered by the Great Arctic Cyclone(s) of August 2016. The minimum sea ice extent has been called by the NSIDC, with a slight proviso:

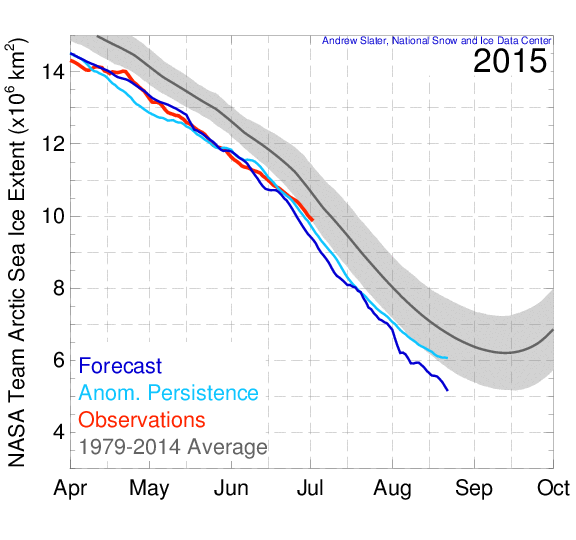
Arctic sea ice appears to have reached its seasonal minimum extent for 2016 on September 10. A relatively rapid loss of sea ice in the first ten days of September has pushed the ice extent to a statistical tie with 2007 for the second lowest in the satellite record. September’s low extent followed a summer characterized by conditions generally unfavorable for sea ice loss.

Please note that this is a preliminary announcement. Changing winds or late-season melt could still reduce the Arctic ice extent, as happened in 2005 and 2010. NSIDC scientists will release a full analysis of the Arctic melt season, and discuss the Antarctic winter sea ice growth, in early October.

On September 10, Arctic sea ice extent stood at 4.14 million square kilometers (1.60 million square miles).

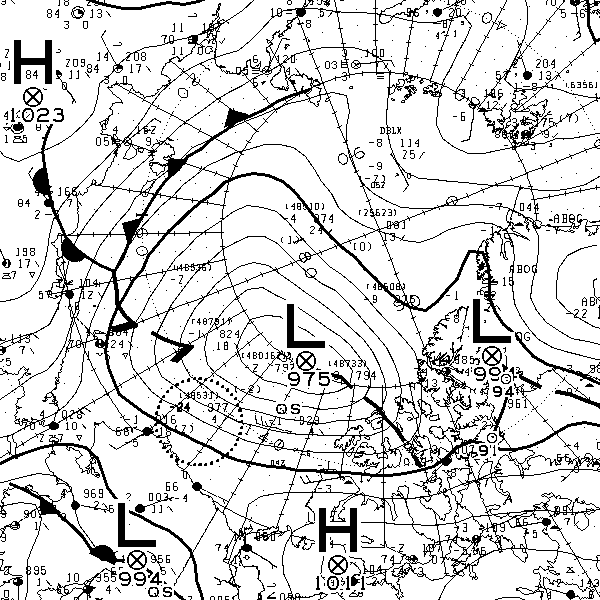
Now, however, yet another cyclone is raging in the Central Arctic. According to Environment Canada this one is already down to a mean sea level pressure of 975 hPa:

synopsis-20160916-06z

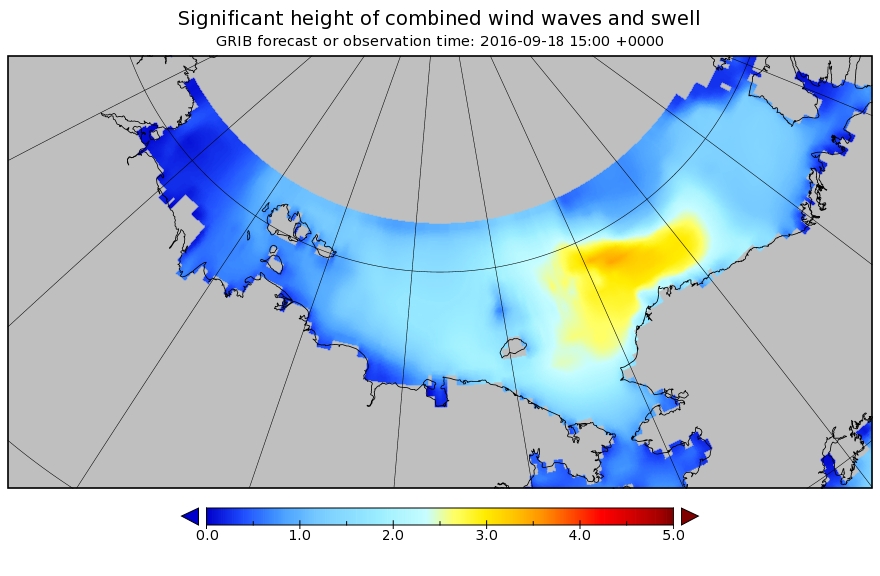
As our regular readers will be well aware, at this time of year strong winds beget large swells. On this occasion it looks as though Barrow will get another battering, as well as the remaining and refreezing sea ice. Here’s the current WaveWatch III significant wave height forecast for September 18th:

significant_height_of_combined_w-in-multi_2-glo_30m-20160916_00064

Such large swells on the surface of the Arctic Ocean don’t only physically break up the sea ice. Last September scientists aboard the University of Alaska’s research icebreaker Sikuliaq observed the effects of a similar storm in the Beaufort Sea. According to Jennifer MacKinnon, Chief Scientist on the ArcticMix voyage:

One of the funny things about the Arctic is that there’s a reservoir of heat beneath the surface here.

So the more the wind is blowing on the ocean, the more it’s mixing this heat upwards. Which is bringing warmer water to the surface at a pretty rapid rate, warming the surface and accelerating the rate at which this ice is melting.

And if storms like this continue, as there’s more open water, more storms mean more exposed surface. It will not only melt the ice in the summer, but delay the onset of fall ice formation and accelerate the onset of spring ice melting.

In October 2015 the Sikuliaq was back in the Beaufort Sea observing the effect of storm swells on refreezing sea ice. Here’s a report from Chief Scientist Jim Thomson:

A strong easterly wind event came through that built large waves — waves that got to almost five meters in height. And the winds were something like up to thirty knots. And these waves were coming into the newly forming ice and making pancake ice.

There was a very warm layer of water 20 meters down beneath the surface. And these waves coming in were enough to drive additional mixing and bring that warm water up from the subsurface and that warm water melted the ice and changed that balance happening at the surface.

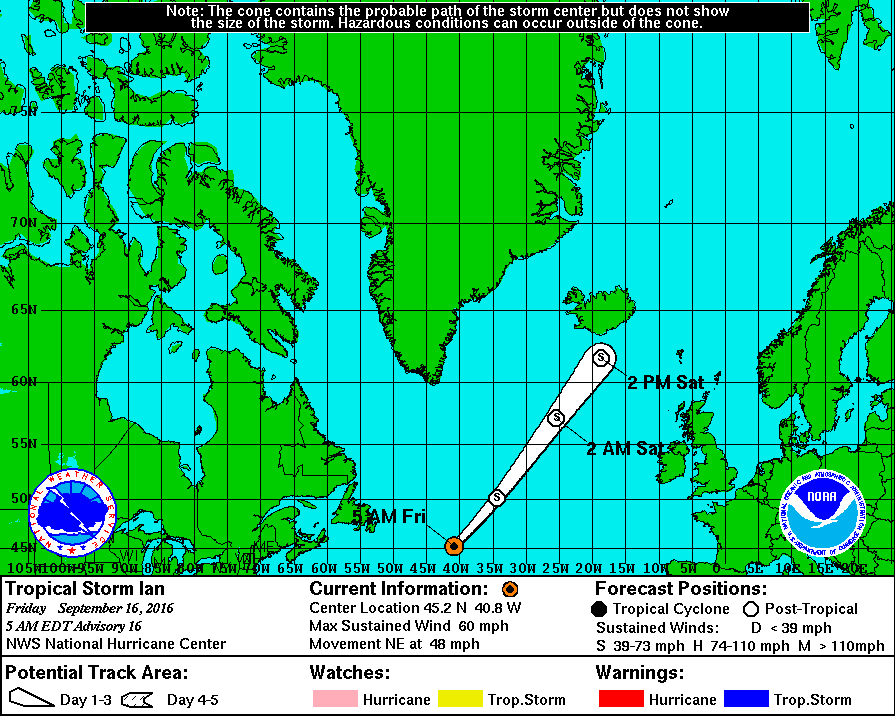
As if all that wasn’t already enough to worry about look who’s waiting in the wings. Tropical Storm Ian is heading towards the Arctic Circle at a rate of knots, even as we speak:

ian-track-20160916


[Edit – September 17th]

Here is the official Barrow surf forecast from the National Weather Service:

SURF ZONE FORECAST
NATIONAL WEATHER SERVICE BARROW AK
0500 AM AKDT SAT SEP 17 2016

AKZ202-171230-
NORTHERN ARCTIC COAST
INCLUDING THE BEACHES OF BARROW…PITT POINT…NULAVIK
0500 AM AKDT SAT SEP 17 2016

.TODAY AND TONIGHT…
.WIND… WESTERLY 20 TO 35 MPH.
.SURF HEIGHT… 2 TO 5 FT.
.SURF TEMP… 36 DEGREES F.
.TIDES… LOW SAT 0826 AM -0.03
HIGH SAT 0230 PM 0.38
LOW SAT 0846 PM -0.02
HIGH SUN 0250 AM 0.38

There is also a severe weather warning in place:

…HIGH SURF ADVISORY REMAINS IN EFFECT UNTIL 6 AM AKDT MONDAY…

* WAVES AND SURF…WAVES TO 10 FEET BREAKING JUST OFFSHORE COMBINED WITH TIDES UP TO 1 FOOT ABOVE NORMAL WILL CAUSE HIGH SURF CONDITIONS.

* ICE…WITH ICE JUST OFF SHORE FROM BARROW…IT IS POSSIBLE THAT CHUNKS OF SEA ICE WILL WASH UP ON SHORE EVEN WITH WINDS PREDICTED TO BE AT NEARLY PARALLEL TO THE SHORE.

* WINDS…WEST 20 TO 30 MPH FROM THIS AFTERNOON THROUGH EARLY MONDAY MORNING.

* TIMING…HIGH SURF IS EXPECTED TO BEGIN LATE THIS AFTERNOON AND CONTINUE THROUGH EARLY MONDAY.

* IMPACTS…HIGH SURF WILL WASH TO THE TOP OF THE BEACH AND CAUSE BEACH EROSION. MINOR FLOODING OF LOW LYING AREAS IS POSSIBLE AND SURF COULD WASH ONTO LOW LYING ROADS NEAR THE BEACH.

PRECAUTIONARY/PREPAREDNESS ACTIONS…

A HIGH SURF ADVISORY MEANS THAT LOCALIZED BEACH EROSION IS EXPECTED. SURF COULD WASH ONTO LOW LYING ROADS NEAR THE BEACH LIMITING TRAVEL NEAR THE BEACH. PEOPLE SHOULD MOVE BOATS AND PERSONAL PROPERTY INLAND FROM THE BEACH.


[Edit – September 19th]

Somewhat belatedly, before:
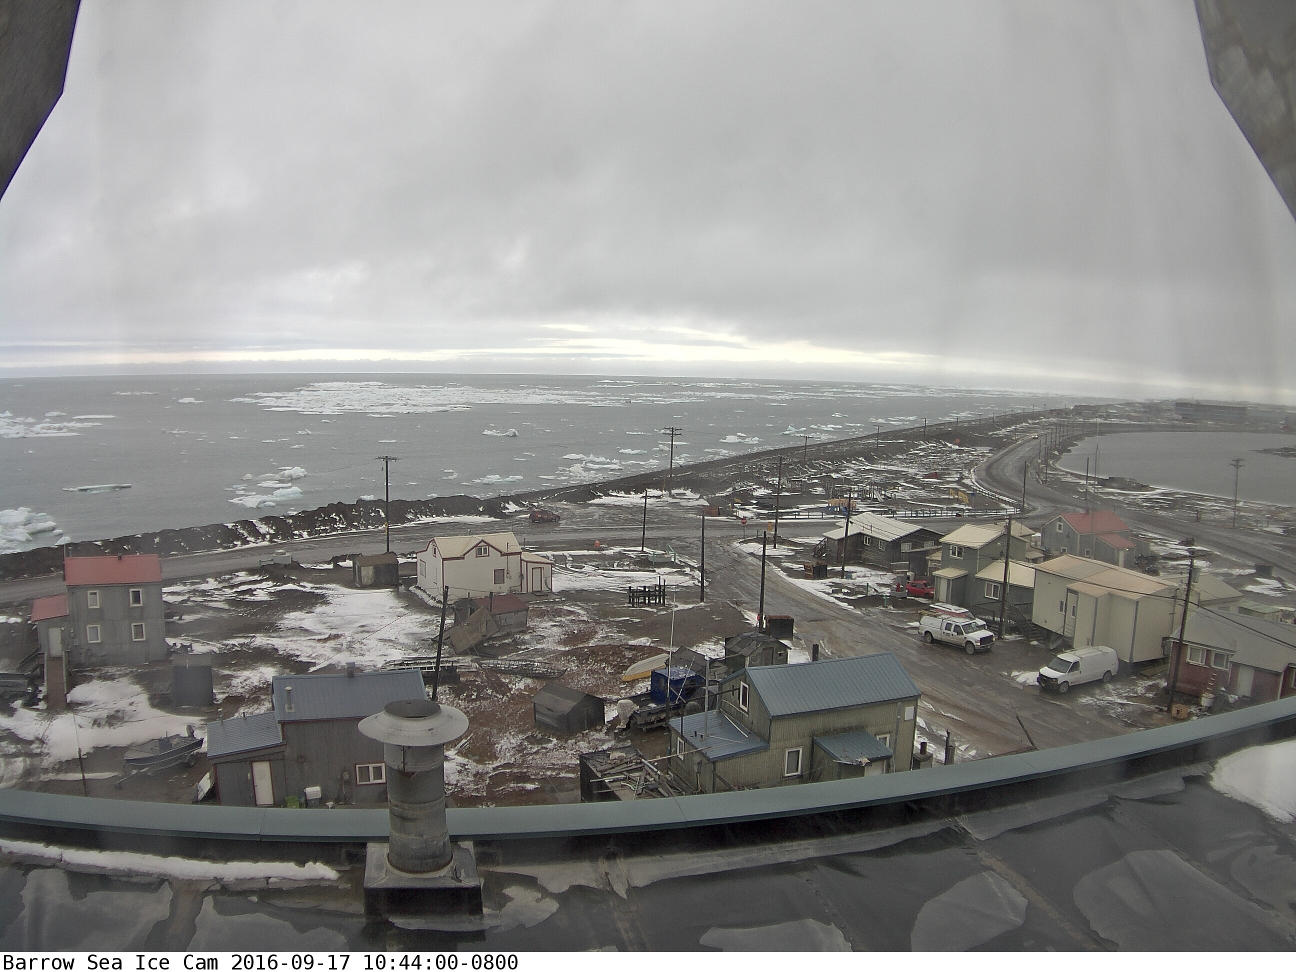
barrowcam_20160917_184400

and after:

barrowcam_20160918_212400

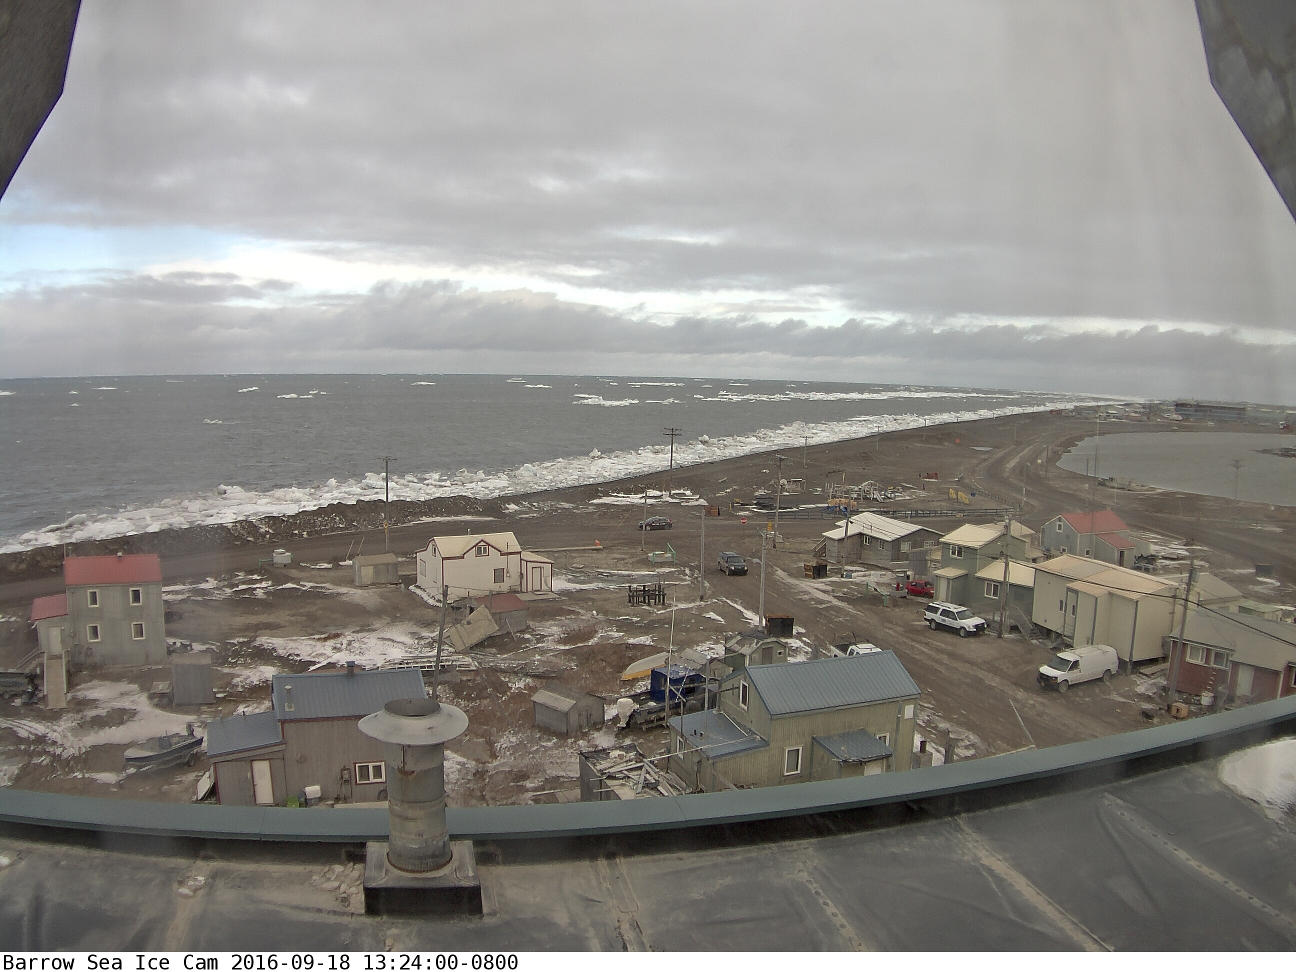
the storm images from the Barrow webcam, which has just burst back into life. Plus an image of the cyclone from on high:

NASA Worldview “true-color” image of the Beaufort Sea on September 18th 2016, derived from the VIIRS sensor on the Suomi satellite

Is Time Running Out for Arctic Sea Ice?

One eminent sea ice researcher certainly seems to think that time is indeed running out for the sea ice in the Arctic. First let’s take a look at the results of the first call for contributions of the 2015 melting season from the Sea Ice Prediction Network:

The Sea Ice Prediction Network  June 2015 Sea Ice Outlook results

Note that in the bottom left hand corner of that graph there is a prediction of 0.98 million square kilometers labelled “Wadhams (SIPOG)”. The acronym refers to the Sea Ice and Polar Oceanography Group in the Department of Applied Mathematics and Theoretical Physics at the University of Cambridge, of which Prof. Peter Wadhams is the head. Before we get on to his explanation for what the SIPN refers to as “an extreme outlier” amongst all the other predictions, here’s a TEDx presentation given by Dr. David Barber, who is currently Associate Dean (Research) in the CHR Faculty of Environment, Earth and Resources at the University of Manitoba in Canada:

Here are what Dr. Barber refers to as the “seven surprising impacts” of declining Arctic sea ice:

  1. Increasing coverage of young ice significantly changes atmospheric chemistry

  2. More snow both preserves and destroys ice

  3. Polar bear habitat can actually improve in some areas while deteriorating in others

  4. Match-mismatch timing in the marine ecosystem increases vulnerability

  5. Uncertainty as to whether the Arctic ocean will increase or decrease in overall productivity is a key unknown

  6. Evidence that ice hazards are actually increasing while the world marshals to increase development of Arctic resources

  7. Evidence that our recent cold winters are actually linked to our warming Arctic.

However those bullet points from David’s closing summary don’t actually mention the part of his presentation that most interested me. Listen carefully at 7:40 when he says that:

In 2009 we had our icebreaker down here and we went up this line that you see right here in this figure.

Here’s a version of the map Dr. Barber is referring that comes from a 2009 paper of his entitled “Perennial pack ice in the southern Beaufort Sea was not as it appeared in the summer of 2009“:

Barber-2009-Map

Here’s the relevant passage from the paper rather than the TEDx video:

We departed from station L1 heading north towards station L1.5, expecting to enter MY sea ice cover at about 71°20′N, 139°00′W based on remotely sensed information (Orange polygon in the figure). The Canadian Ice Service (CIS) ice chart (which relies extensively on Radarsat-1 data) for 4 September 2009 indicated the ship track would range from 7 to 9 tenths coverage and this ice would consist of partial concentrations of 5 tenths to 7 tenths old ice and from 2 to 3 tenths thick first year ice.

In situ observations of the sea ice conditions however showed that the ice we were traversing was not MY or thick FY, nor was it 7 to 9 tenths concentration, but rather it was a mixture of a few small MY ice floes (1 tenth coverage) interspersed in a cover dominated by small (10–100 m) rounded floes of heavily decayed first year sea ice (4 tenths). These floes were overlain by a thin layer of new ice (7 tenth) where freeboard was negative and thin ice growing between remnant pieces when the ice had a positive freeboard. Likewise, some new ice covered open water areas between floes.

This is the “rotten sea ice” David refers to in the video, about which he says:

It was so rotten in fact that the ship that we had does 13.5 knots in open water, and we were able to traverse that ice at 13 knots, yet the satellites all thought that this was very thick multi-year sea ice, because that’s what it had always traditionally been.

This information is obviously very interesting of course, but even more interesting (to me at least) is a subsequent paper by Dr. Barber about the same voyage of the Canadian Research Icebreaker Amundsen, published in 2012 and entitled “Fracture of summer perennial sea ice by ocean swell as a result of Arctic storms“. Here’s a pertinent extract:

We progressed through the heavily decayed ice region into a transitional region containing a mix of decayed old and FY sea ice floes, and finally into thick late summer MY pack ice. Using the onboard helicopter to survey the area, we identified a vast MY floe (10 km diameter), to which we intended to moor the ship, and conduct our typical science operations. The ice in this area was much thicker than the heavily decayed FY ice we that we had encountered the previous day to the west. Our helicopter EMI system recorded overall thicknesses of sea ice around station MYI (e.g., mean = 2.0 m, max = 10 m).

As ice teams initially prepared to deploy to the ice, we noticed the appearance of a swell from the ships helicopter deck. Laser data collected during the helicopter EMI survey at station MYI indicated a swell period of 13.5 s, and a wavelength ranging from 200–300 m. Laser data were collected while the helicopter hovered over a large MY ice floe. These data were augmented with three-dimensional dynamic ship positioning data, which revealed approximate ship heave amplitude of 0.4 m, also with a period of 13.5 s. The swell caused the vast MY ice floe nearest the Amundsen to ride up one side of the swell and fracture as it crested the wave peak, creating smaller ice floes of width approximately one half of the wavelength of the swell. In a matter of minutes from the initial onset of swell propagation, all large MY ice floes in the region were fractured in this manner, yielding a new distribution of smaller MY ice floes ranging from 100–150 m in diameter. A helicopter-borne video system recorded this event in still photographs along its flight track which were later combined to create a series of photo mosaics.

On 09 September 2009, we conducted a longitudinal helicopter EMI survey at 72.5 N, and determined the limit of the swell penetration into the pack ice at 72.526 N 134.51 W, a penetration of 350 km. Furthermore, the rotted FY ice margin was heavily fractured, with small floe sizes ranging from 20–50 m in diameter.

Moving on from Manitoba to Cambridge, Peter Wadhams has recently recorded an interview for The University of Earth, which describes itself as “an entertaining educational reality television series”. Here it is:

So what is “the reality” of the situation in the Arctic? Prof. Wadhams doesn’t explain his “extreme outlier” 2015 prediction in detail in the interview, but he does identify three potentially significant problems:

  1. The “minor thing, in a way” of several feet of global sea level rise this century due to melting of the Greenland ice sheet
  2. A sudden increase in the rate of “global warming” due to Arctic albedo feedback, which leads to
  3. The exposure of the methane hydrate bearing continental shelves off Siberia to increasing water temperatures as the sea ice above them melts. “It’s a massive risk, if you do a risk analysis”

Peter also highlights the same concerns as Barber et al. 2012, often referred to in the literature as “waves-in-ice“. I highly recommend watching both videos from cover to cover. However if you’re in a rush then at least skip to 28:30 minutes where he points out that on his cruise around the Arctic this coming September:

We’re looking at one particular thing, which may not be the most important thing, but the retreat of the sea ice in summer is going much faster than computer models predict, and we think that one factor there is the fact that as the sea ice retreats it opens up this huge area of open water in the Arctic Ocean which then becomes like an ocean, with lots of waves and storms and swell, and the waves themselves break the remaining ice up and cause it to retreat faster so that there’s a kind of collaborative effect there that the remaining ice is vanishing faster because of so much open water producing wave action.

Getting back to the current situation in the 2015 melting season, here’s what the University of Hamburg’s AMSR2 sea ice concentration map currently reveals:

Arc_20150703_res3.125

and here’s what the Slater Probabilistic Ice Extent methodology is predicting will happen over the next 50 days:

Slater_fcst_20150703

Both suggest to me that although the rate of decline in the area of Arctic sea ice is not currently abnormal for post 2007 years, it may well become so in another month or so, when the extent curve “normally” starts to flatten out. Possibly even sooner than that, because here is the current GFS 2 metre temperature map for the Arctic:

CCI-T2-20150703+3

and temperatures, particularly on the Pacific side of the Arctic, are forecast to get warmer still over the next few days.

Watch this space and we’ll keep you posted, but in the meantime here’s a final thought from Peter Wadhams:

Our children have a future only if we take action now.

[Edit – July 6th 2015]

In a personal communication Prof. Wadhams informs me that:

This year I’m going out in September in the “Sikuliaq” (University of Alaska) to do some more specific wave-ice interaction experiments [in the Beaufort Sea Marginal Ice Zone], assuming there is any ice to experiment on.

[/Edit]