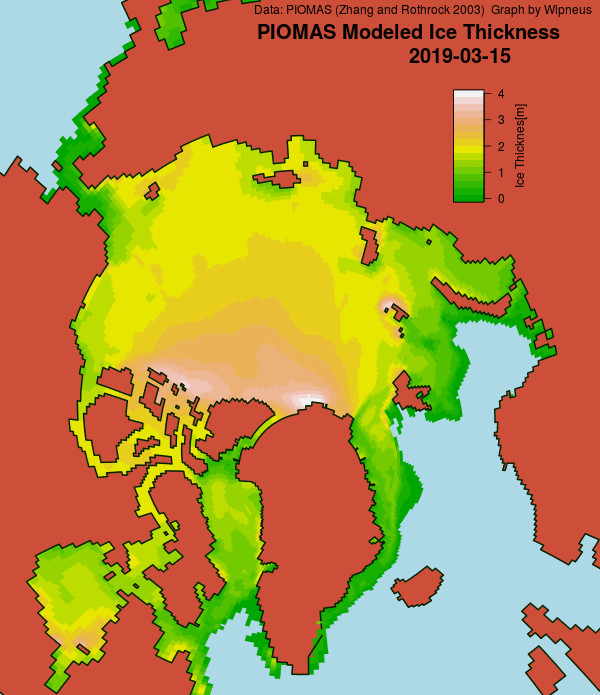
Wipneus has recently updated the mid month PIOMAS gridded thickness map, which looks like this:
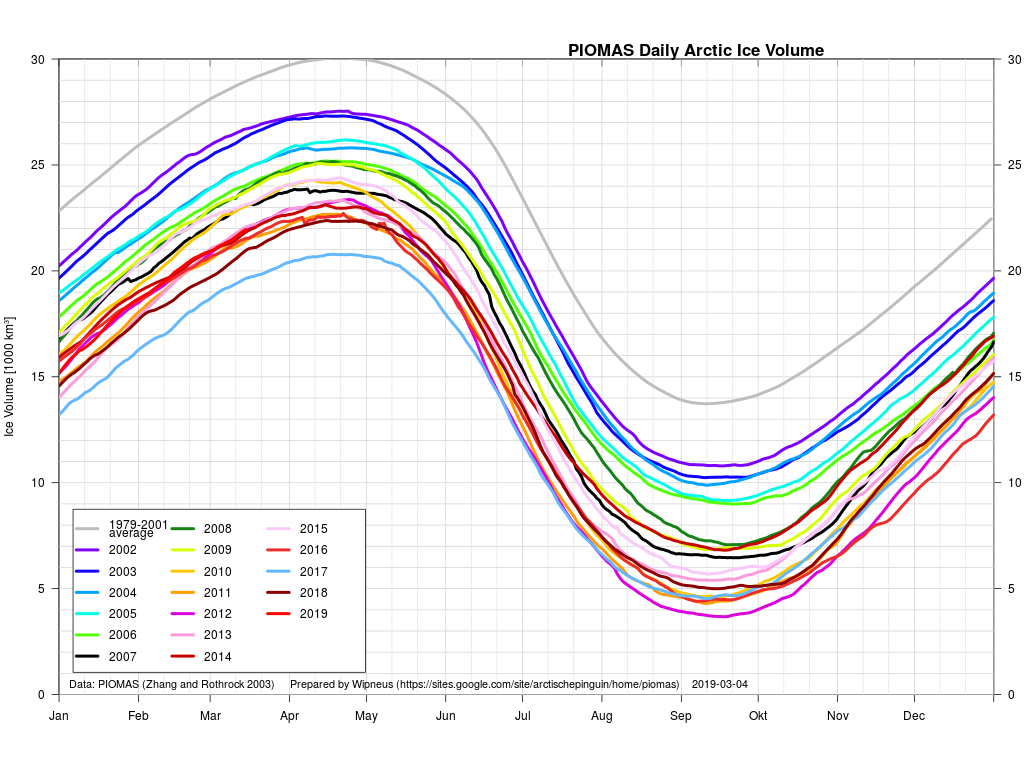
The accompanying PIOMAS volume graph currently shows 2019 in seventh place:
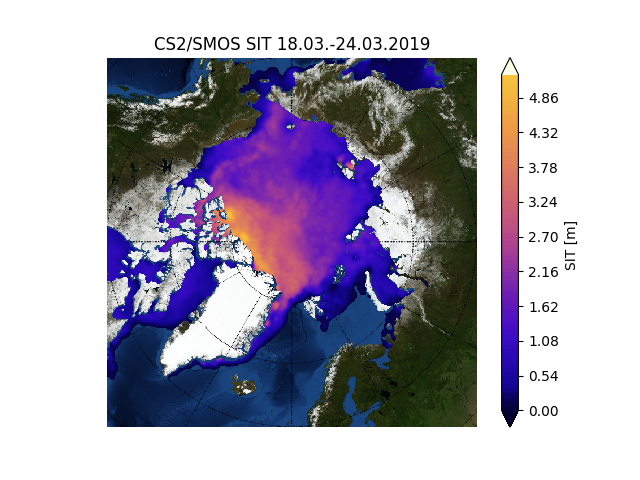
We now have a new thickness metric to peruse each month. Here’s the gridded merged CryoSat-2/SMOS thickness data from the Finnish Meteorological Institute:

Since the FMI make the gridded data available as well as that visualisation, here’s a closer look at the Bering/Chukchi area:

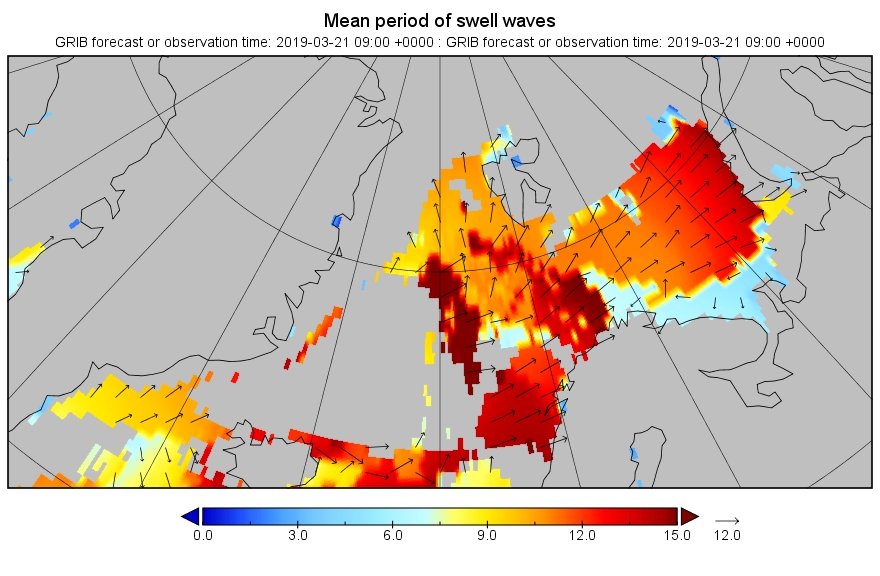
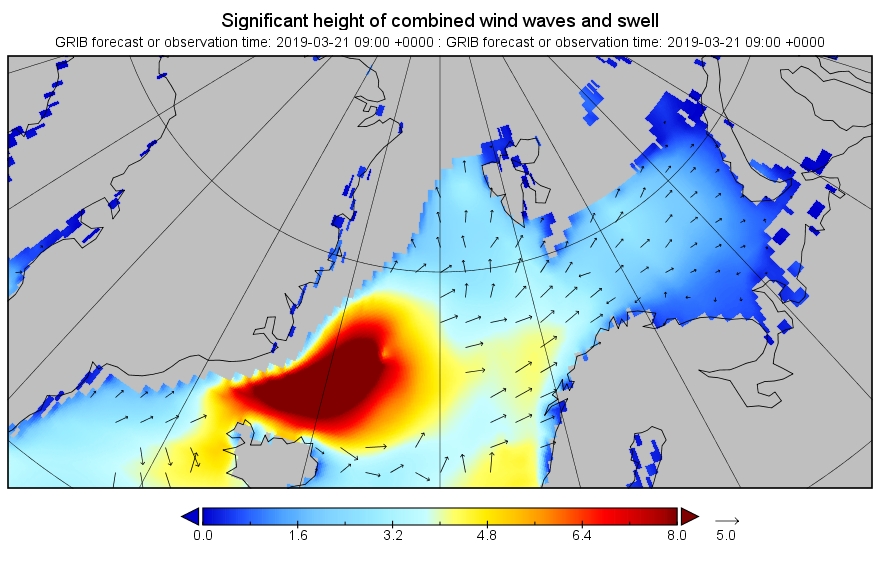
There’s an awful lot of thin ice in the region ripe for rapid melting now that the sun is shining down for a rapidly increasing number of hours per day. Over on the other side of the North Pole there’s also some significant swell forecast to hit the Atlantic edge of the Arctic ice pack. Here’s the current WaveWatch III forecast for 09:00 UTC tomorrow morning:
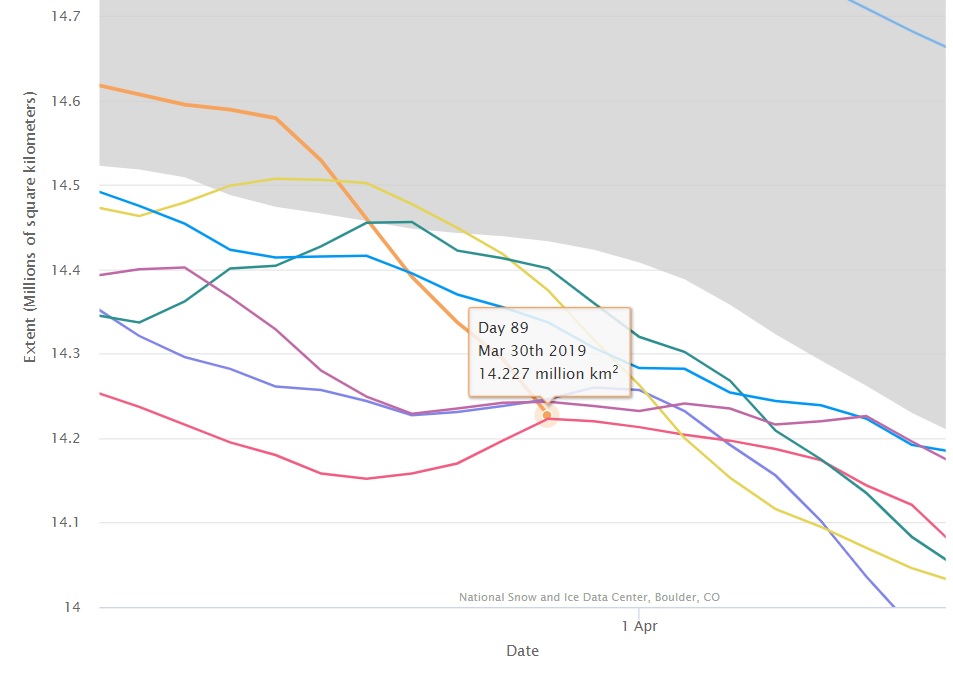
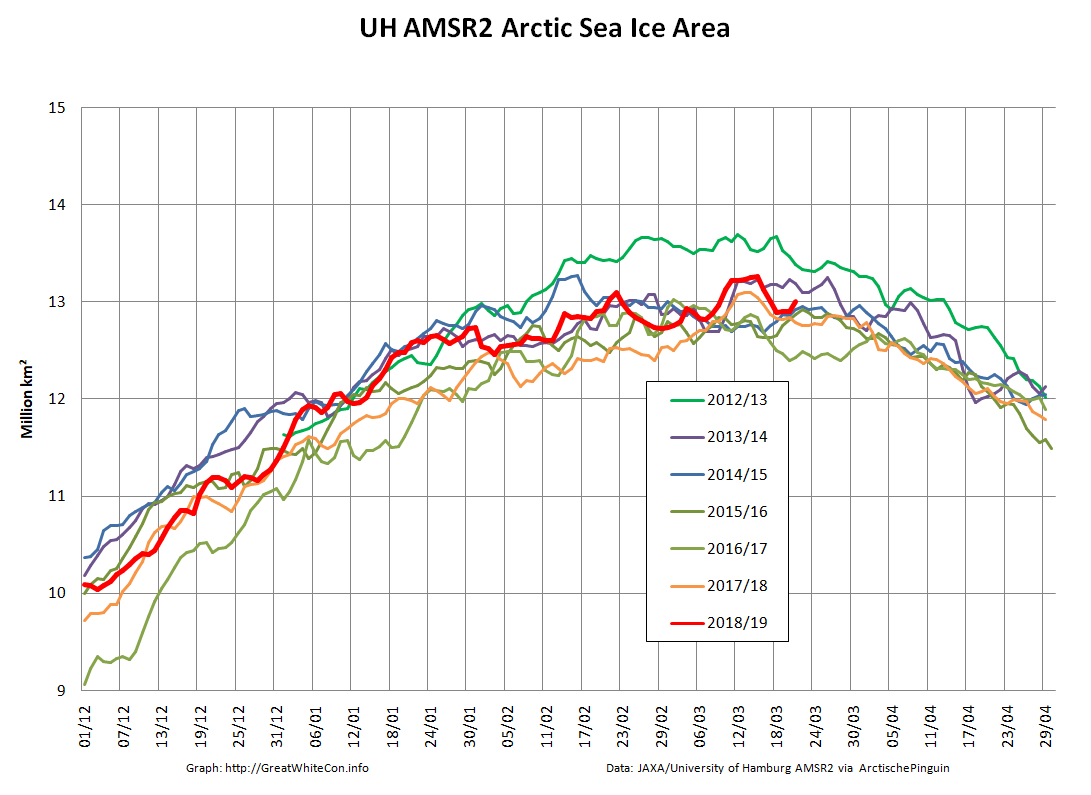
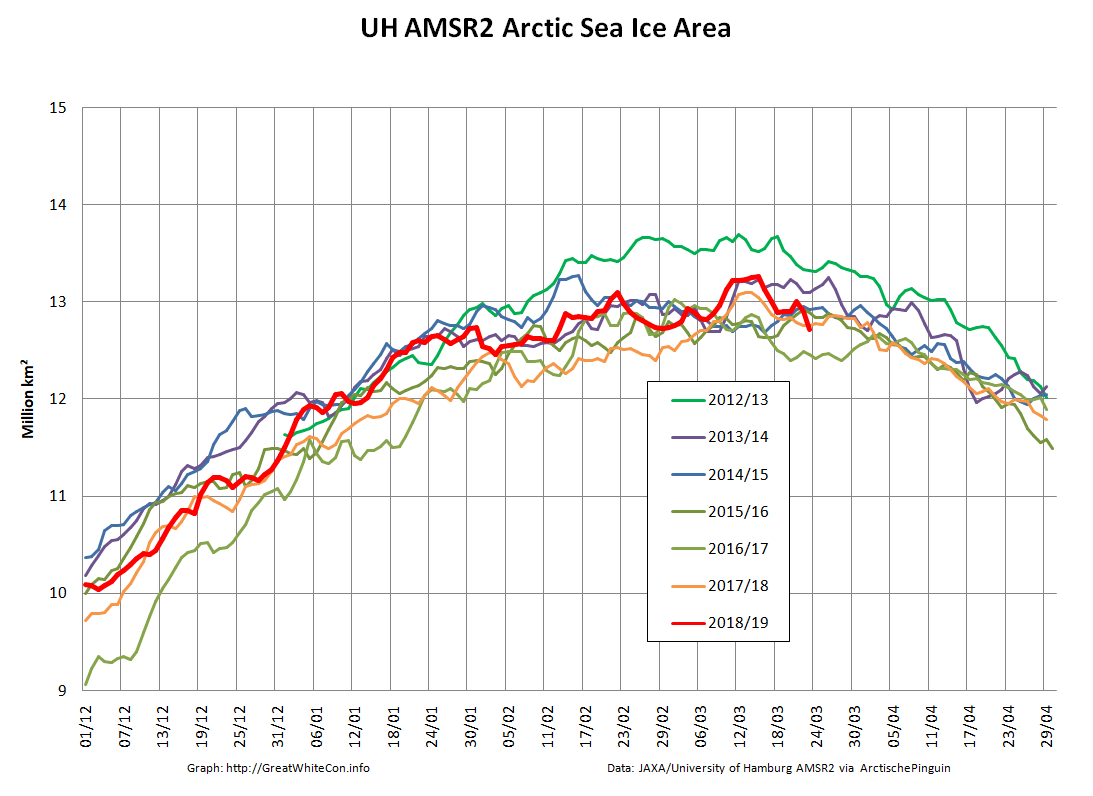
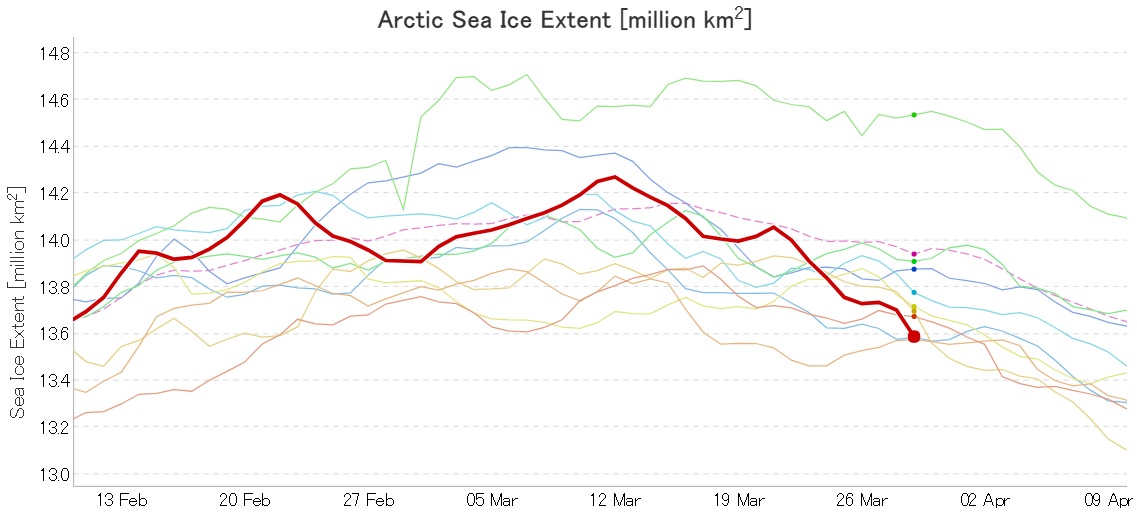
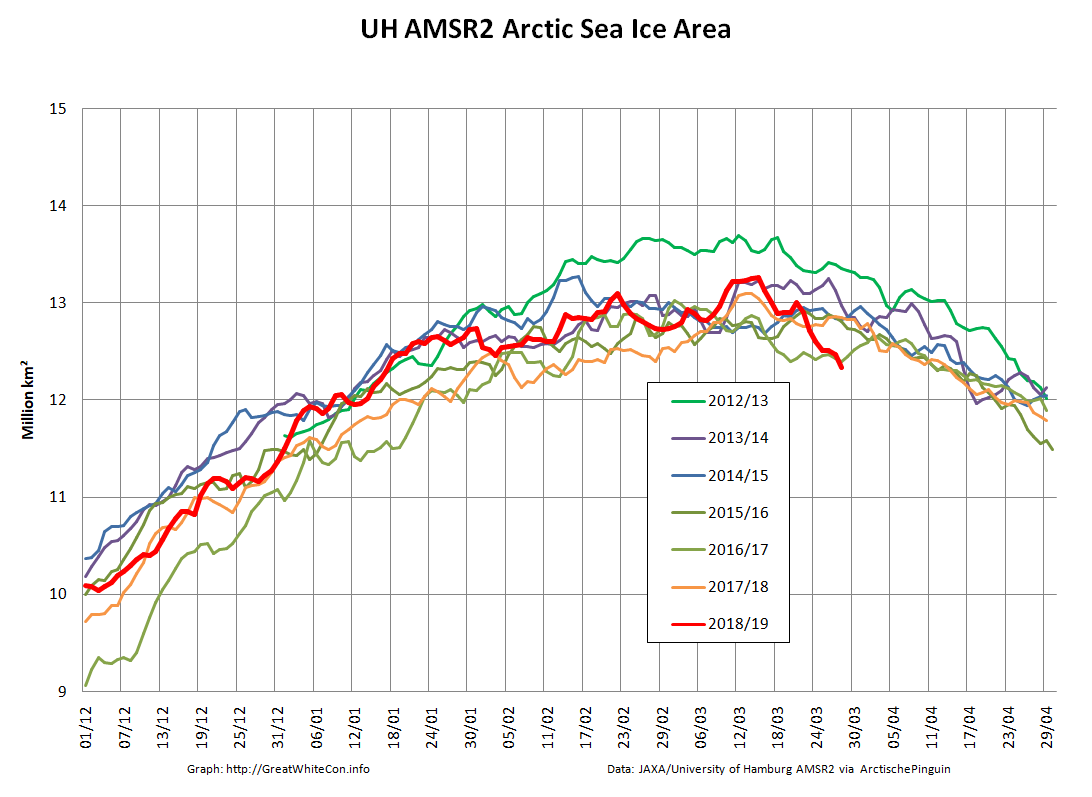
Finally, for the moment at least, here are the current Arctic wide high resolution AMSR2 sea ice area and extent graphs:


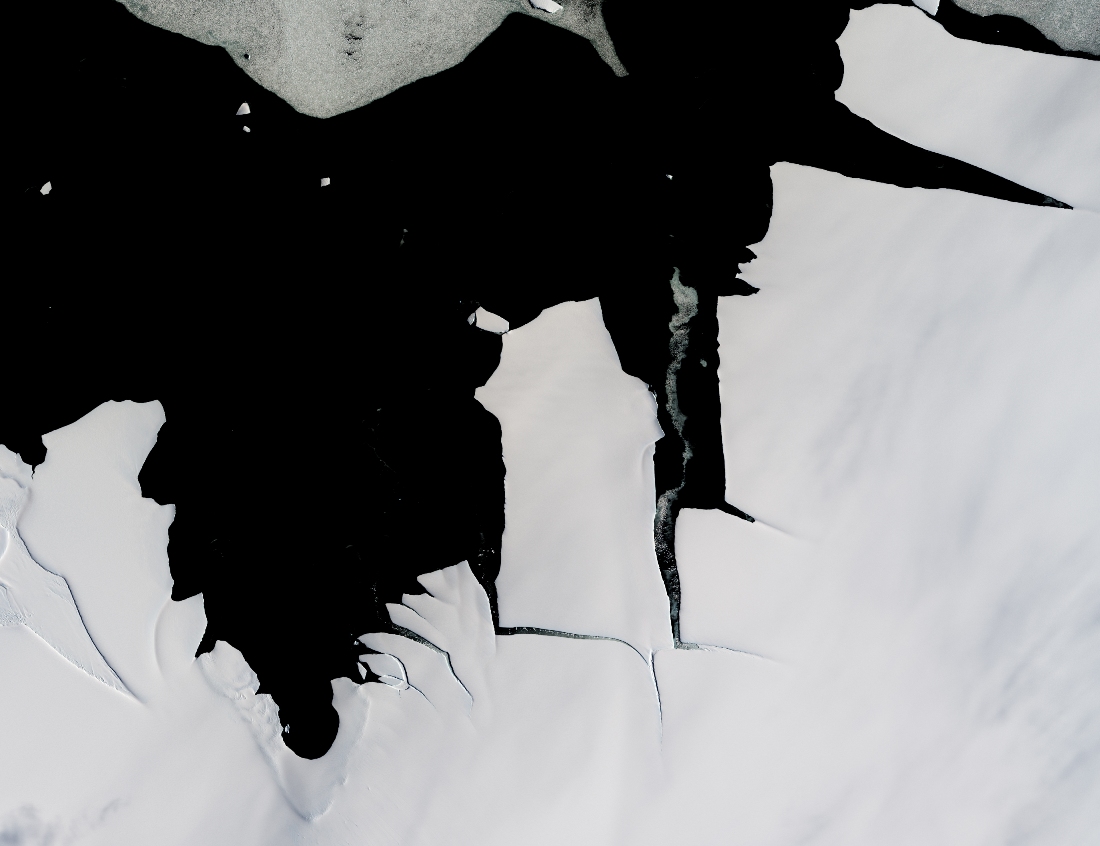
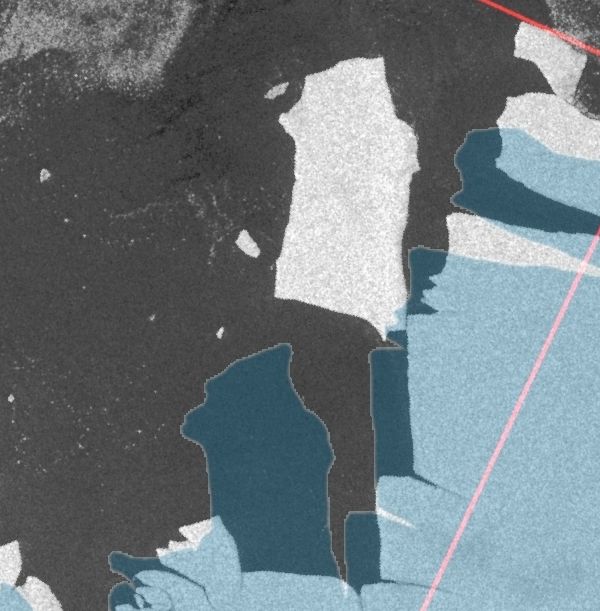
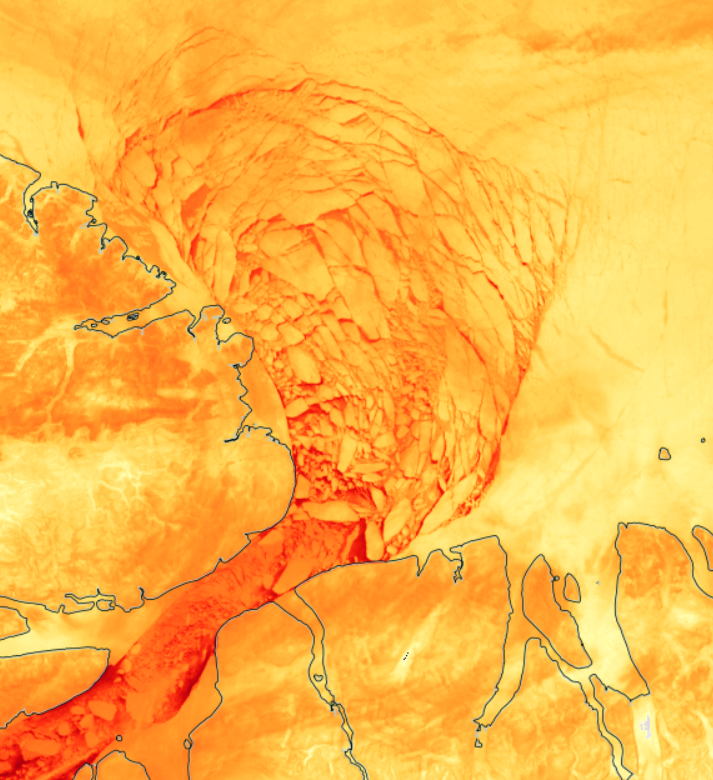
This Sentinel 1 SAR image of the Lincoln Sea from PolarView suggests that the northern arch of the Nares Strait is breaking up once again:
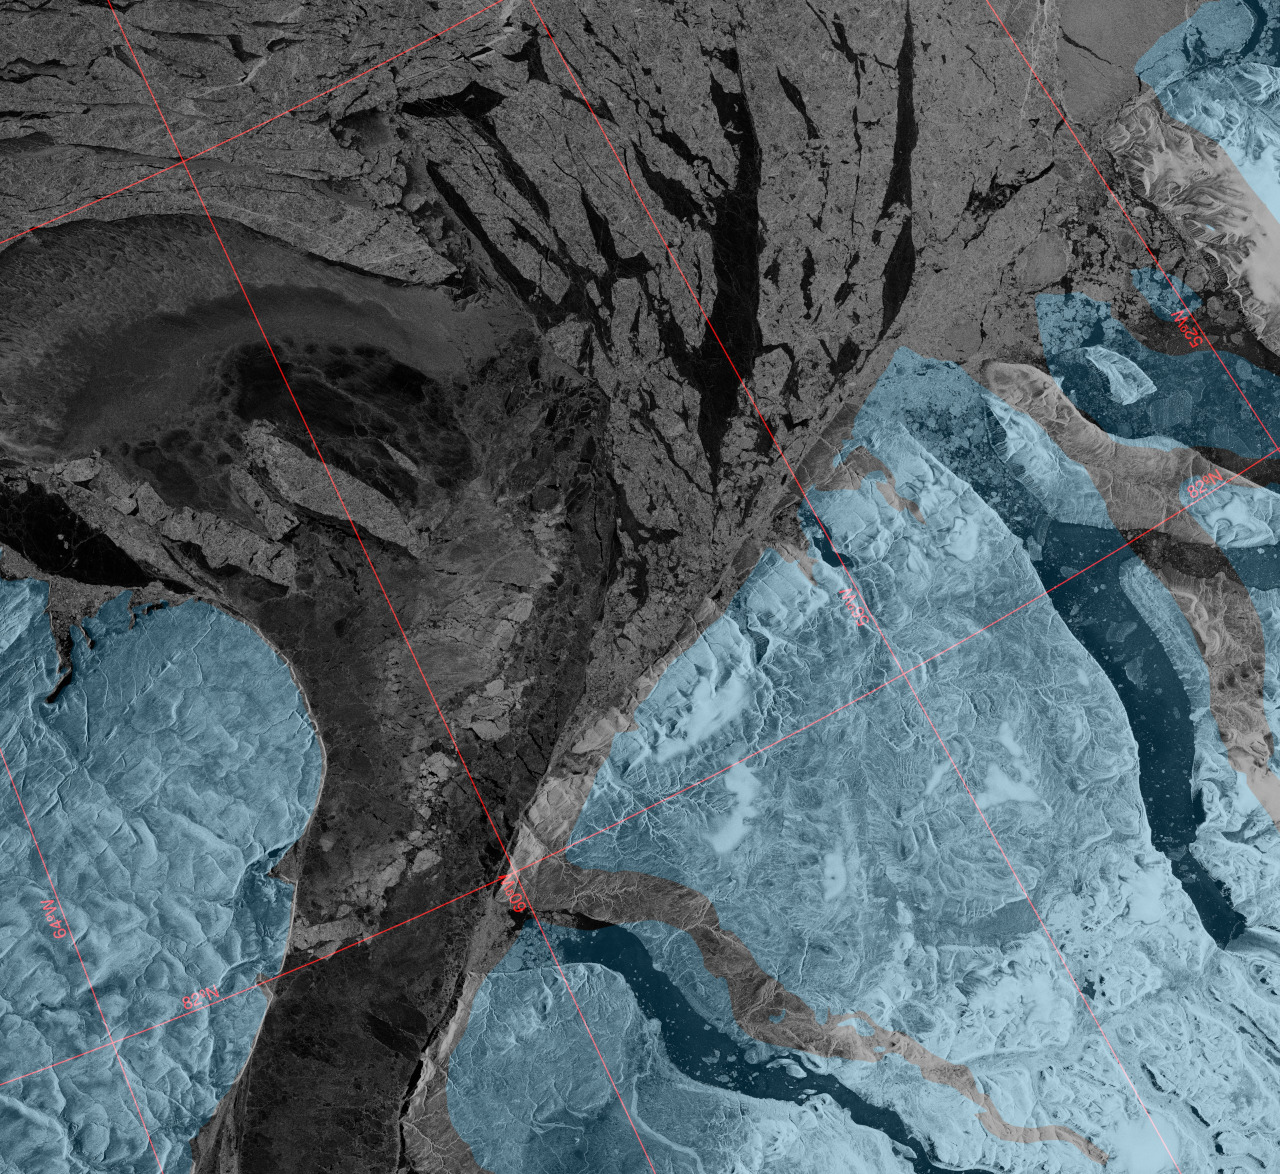
It is therefore conceivable that sea ice in the Lincoln Sea will continue to break up and flow south through the Nares Strait for the entire 2018/2019 winter.
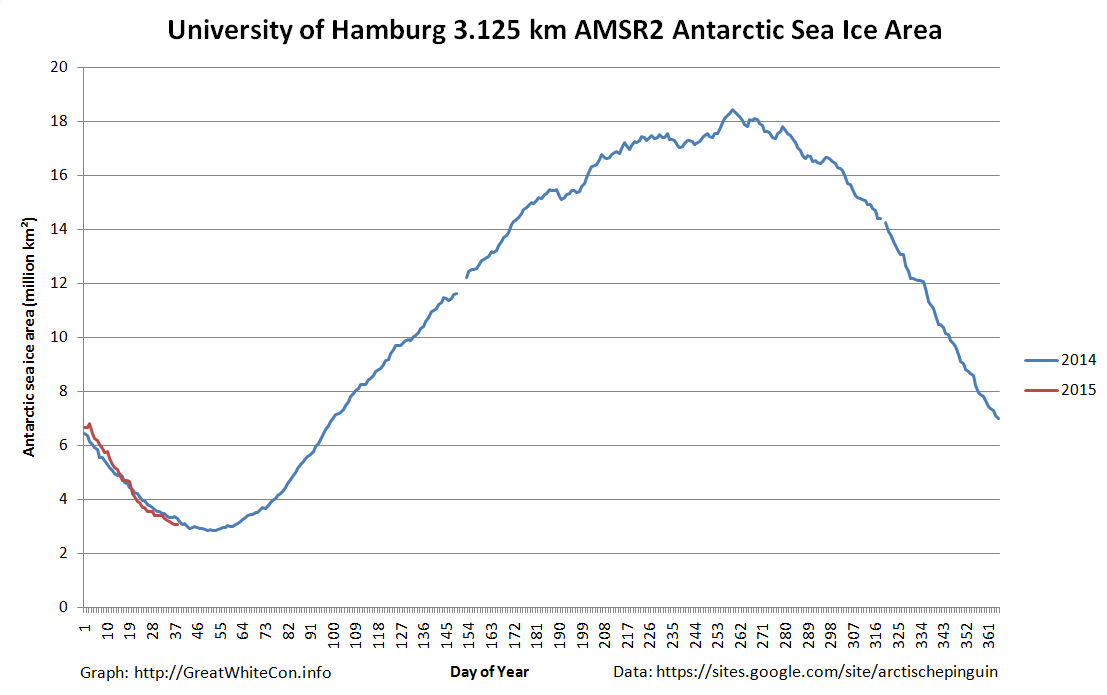
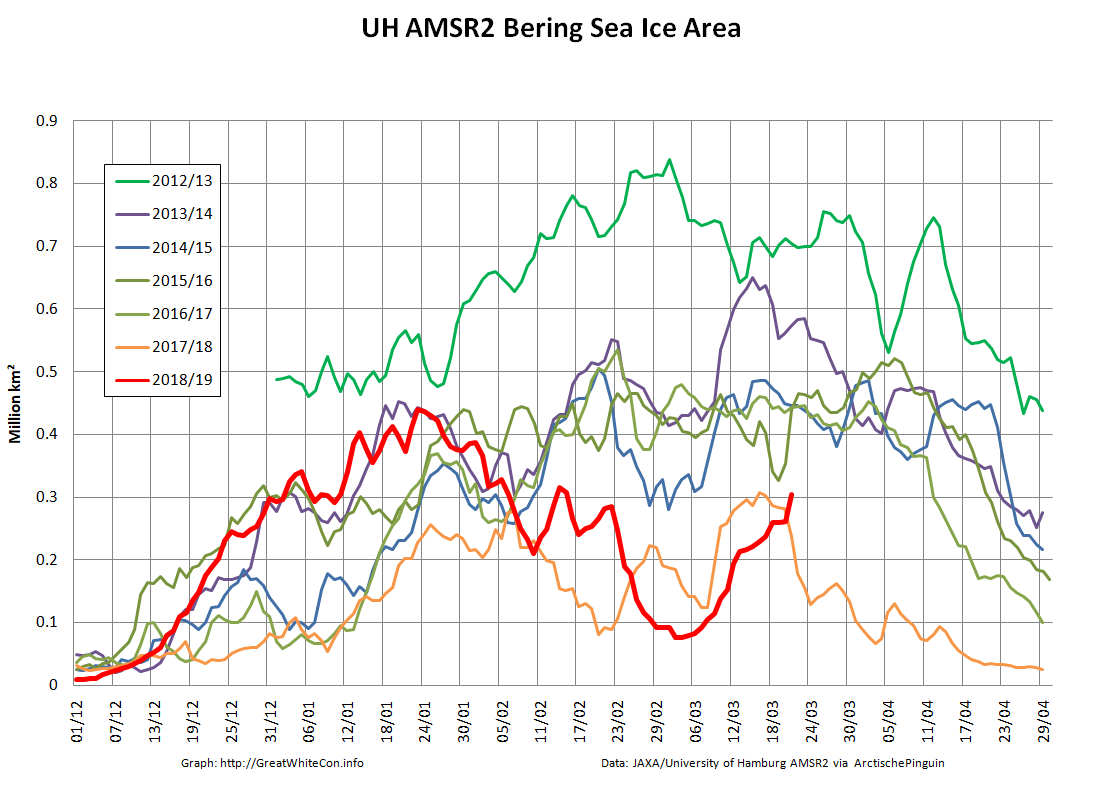
Bering Sea ice area has “rebounded” over the last few days:
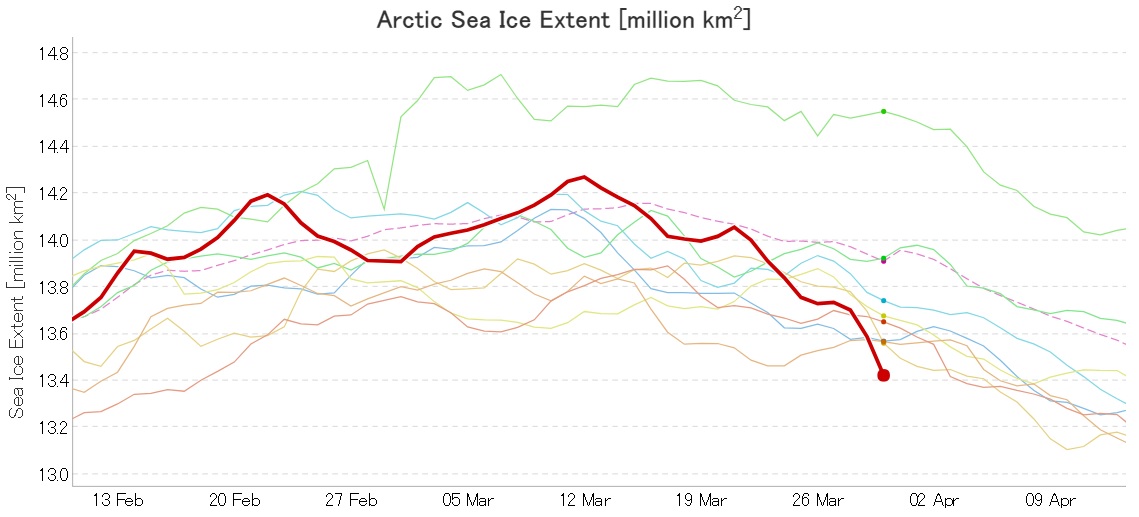
and taken the Arctic wide metrics with it:

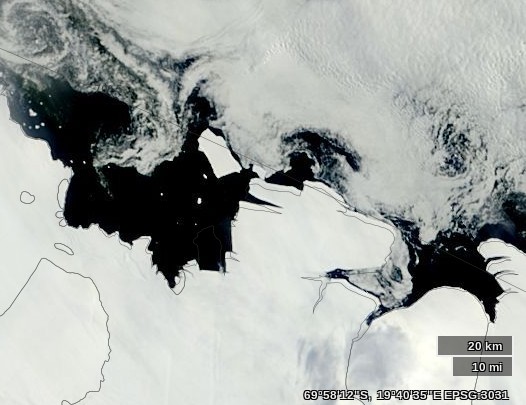
Here’s the latest Sentinel 1 SAR image of the Lincoln Sea and northern Nares Strait:

The “rebound” has reversed:

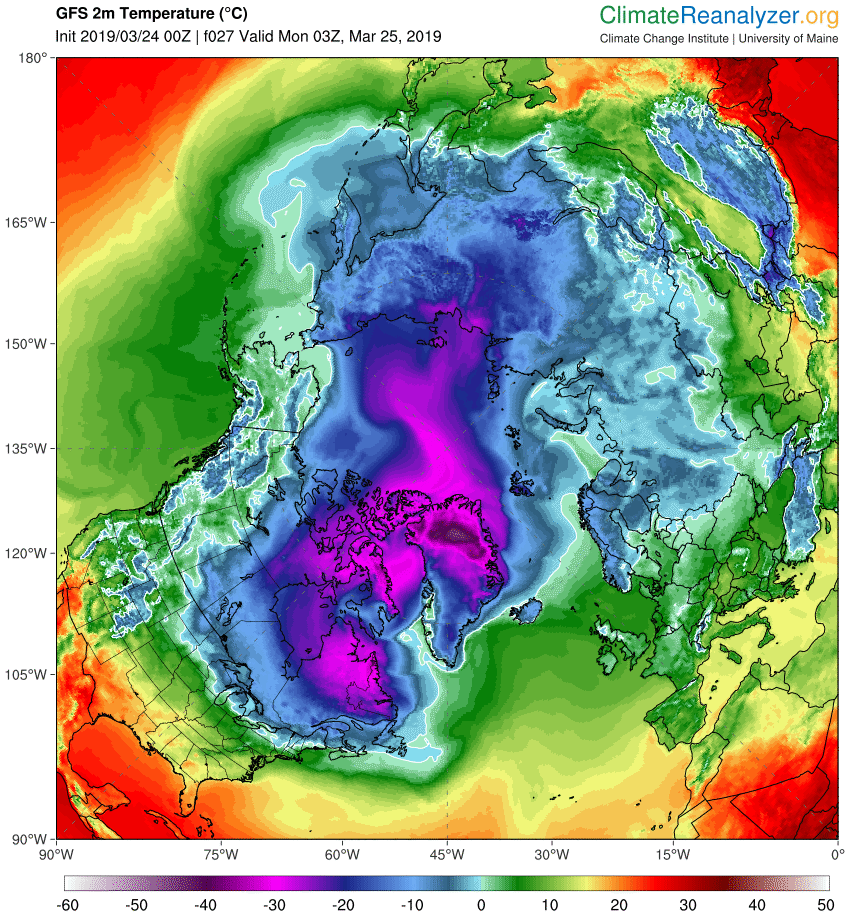
With temperatures above freezing point across the Bering and Chukchi Sea forecast for tomorrow morning expect the decline in Arctic sea ice extent to accelerate:
There was a 162k decline in high resolution extent yesterday:

Here also is the current state of the thick sea ice exiting the Lincoln Sea via the Nares Strait:
Here’s another week’s merged CryoSat-2/SMOS thickness data from the Finnish Meteorological Institute:
We’re still waiting for Wipneus’ Raspberry Pi to crunch the high resolution AMSR2 numbers, but here’s the latest from JAXA:
2019 currently in 3rd place by a whisker.
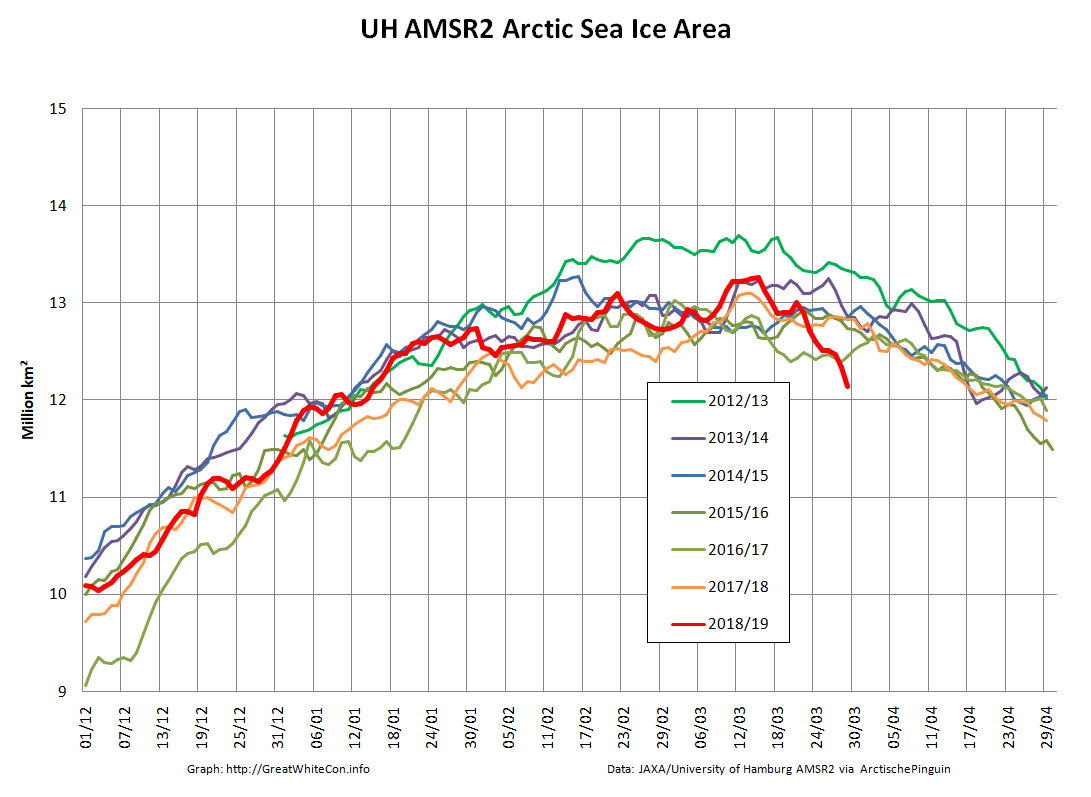
P.S. The high resolution AMSR2 numbers are out:

Area is certainly lowest for the date in the AMSR2 era. Extent will almost certainly achieve that status tomorrow. Excluding the two most peripheral seas reveals perhaps an even more worrying picture?

Arctic sea ice coverage is now firmly in the “lowest extent for the date in the satellite record” category, whichever metric you care to choose:

The NSIDC 5 day average is in a “statistical tie” for first place with 2017: