Tag Archives: GAA 2016

Wind Waves in the Beaufort Sea in April 2016

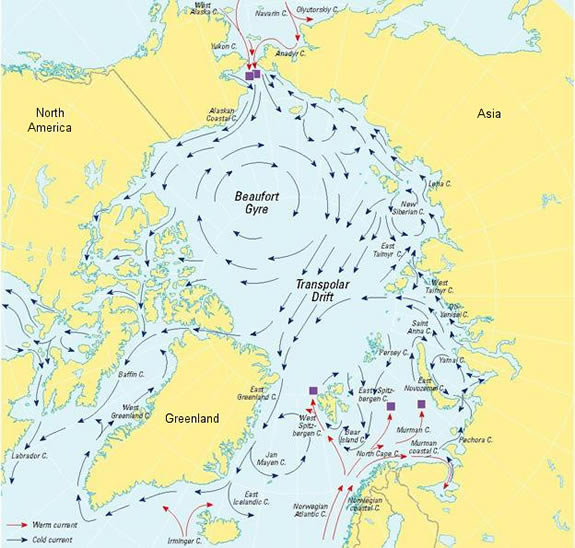
As regular readers will be aware we have been following the progress of the Great Arctic Anticyclone of 2016 for the last 3 weeks or so and the generation of increasingly large waves in the Beaufort Sea in August and September for the last 3 years or so. Today we combine the two to bring you news of anomalously large waves in the Beaufort Sea earlier this week. In actual fact any sort of waves in the Beaufort Sea at this time of year would be anomalous, since normally the Beaufort is still covered in sea ice in April!

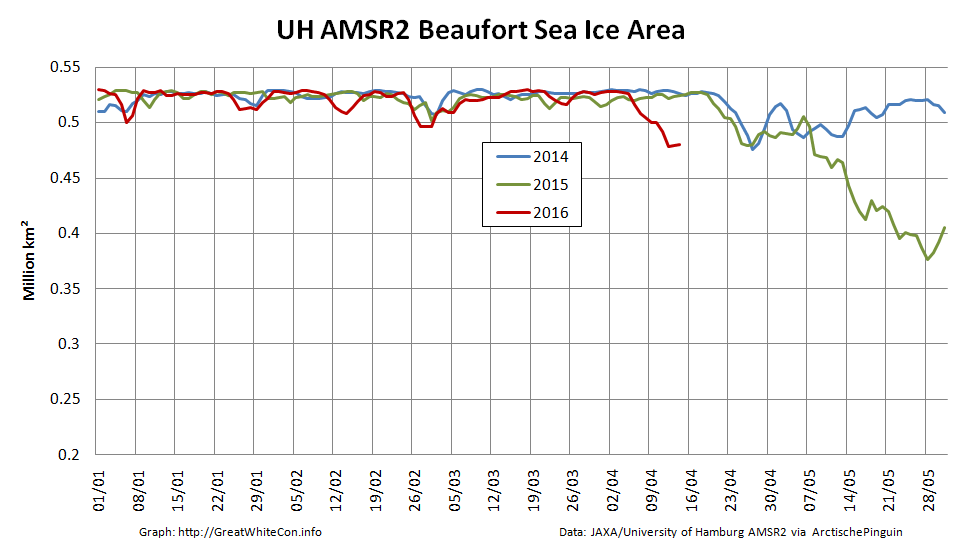
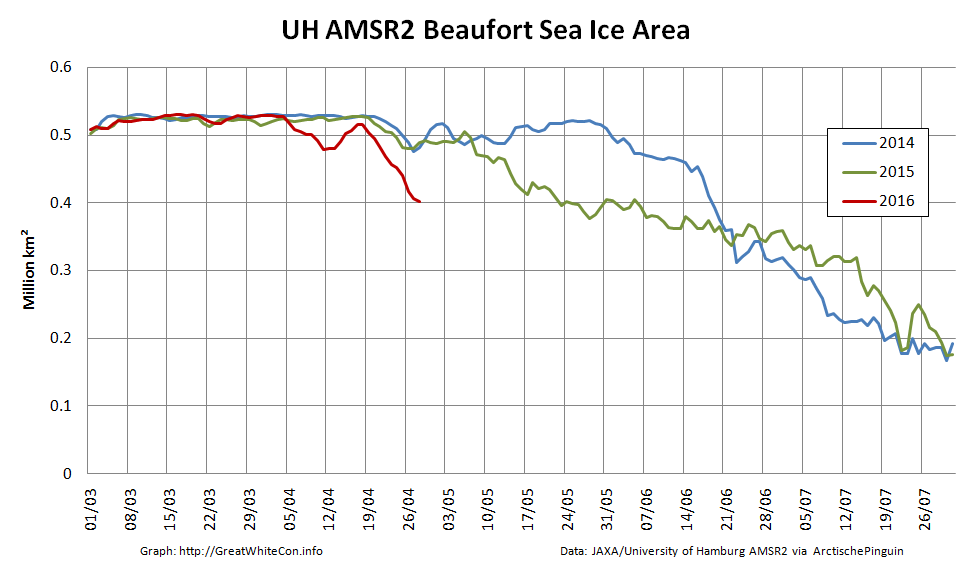
Firstly a bit of background information. In the continuing absence of the DMSP F-17 satellite data used by the NSIDC for their Arctic sea ice metrics, here’s a close up look at Arctische Pinguin’s current Beaufort Sea ice area data:

2016-04-28-Beaufort-AMSR2-Area

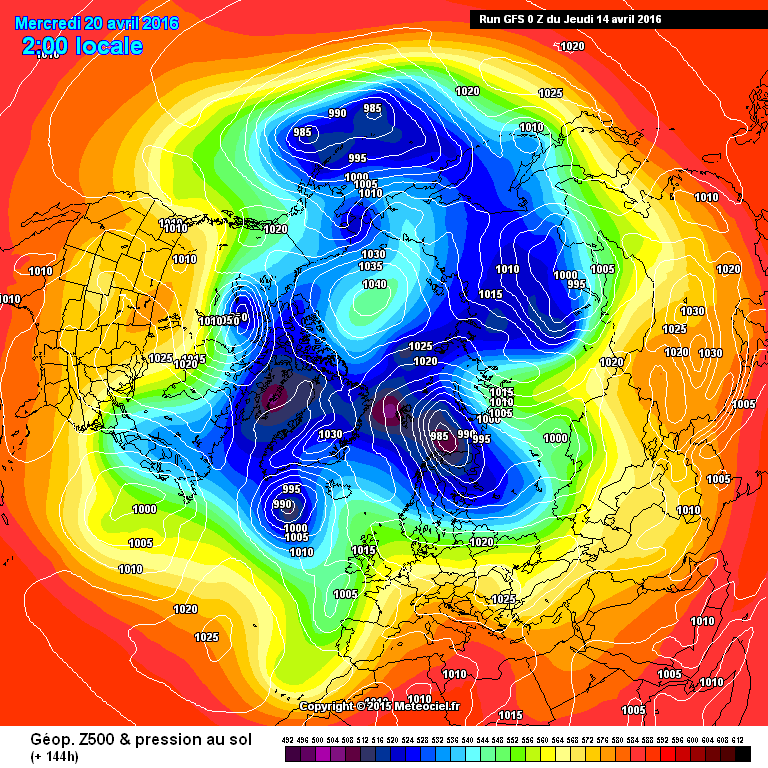
Now here’s NOAA’s WaveWatch III “hindcast” of the winds over the Beaufort Sea on April 26th 2016:

WaveWatch III wind hindcast for the Beaufort Sea on April 26th 2016

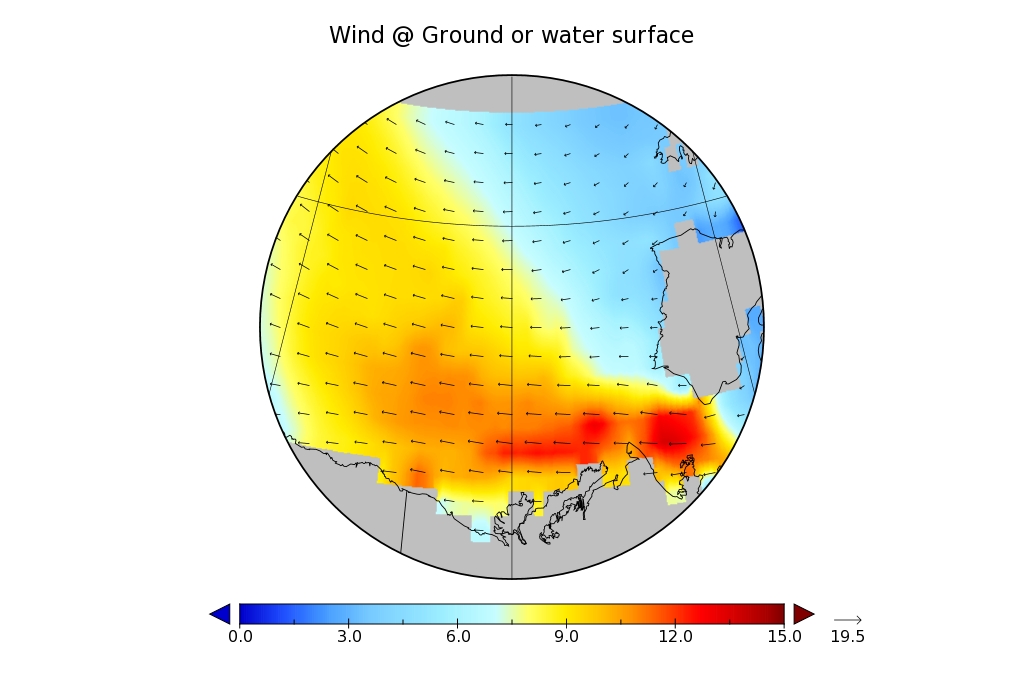
Notice the continuing easterly winds from the persistent high pressure system centred to the north of the Beaufort Sea. Next here’s the resultant wind wave height:

WaveWatch III wave height hindcast for the Beaufort Sea on April 26th 2016

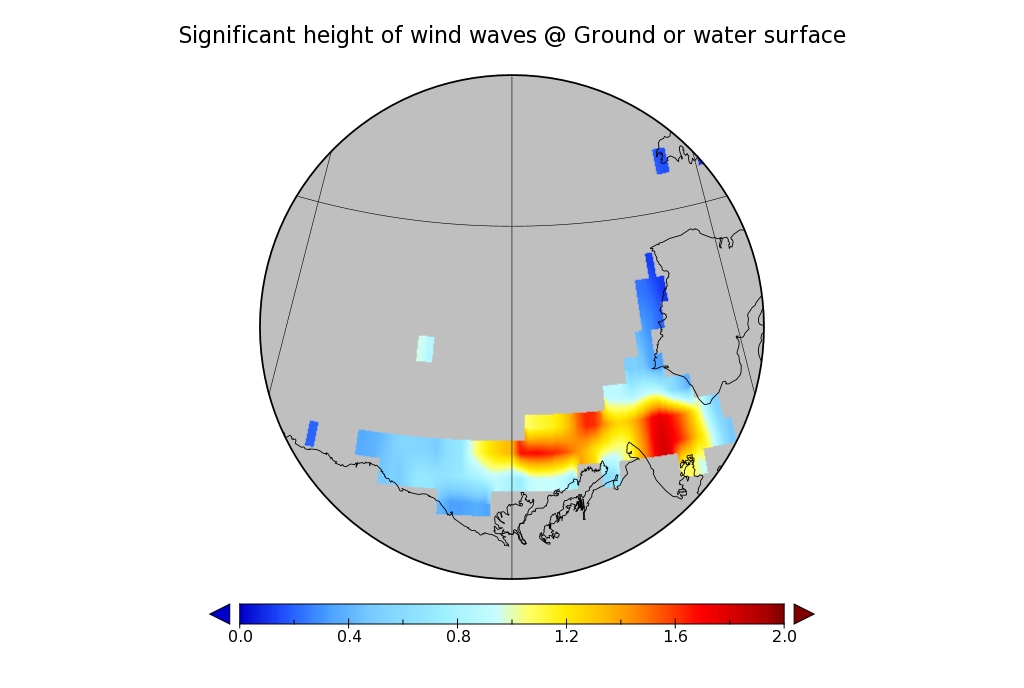
and the associated wind wave period:

WaveWatch III wave period hindcast for the Beaufort Sea on April 26th 2016

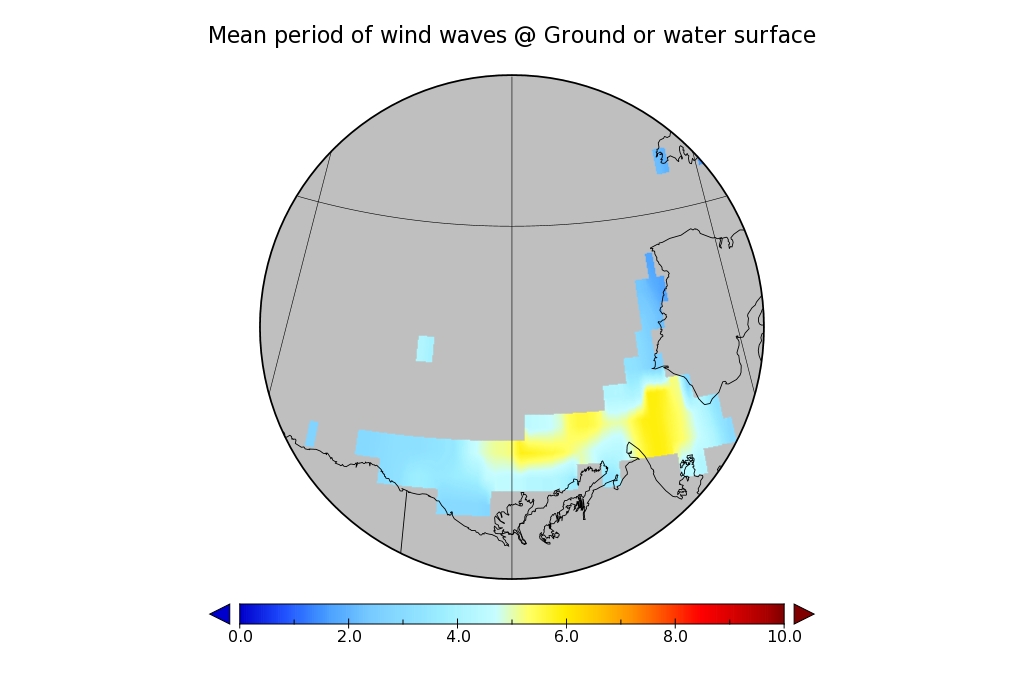
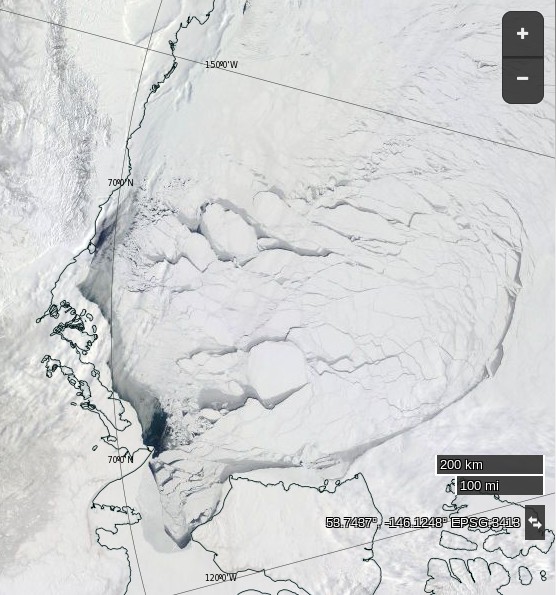
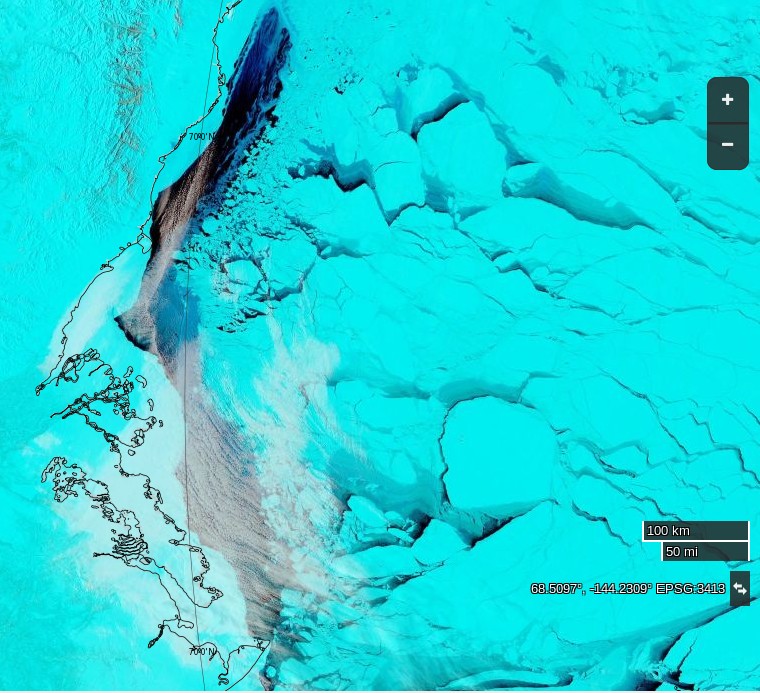
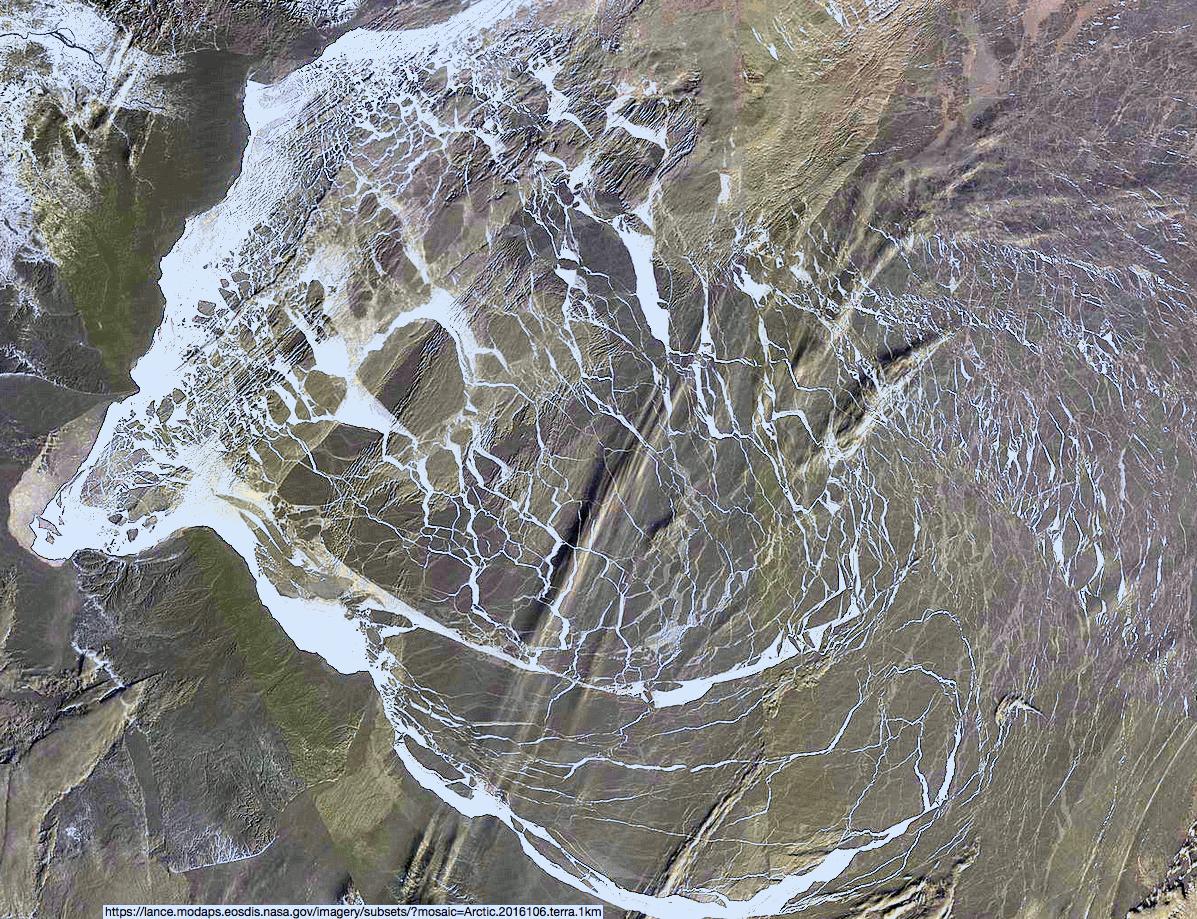
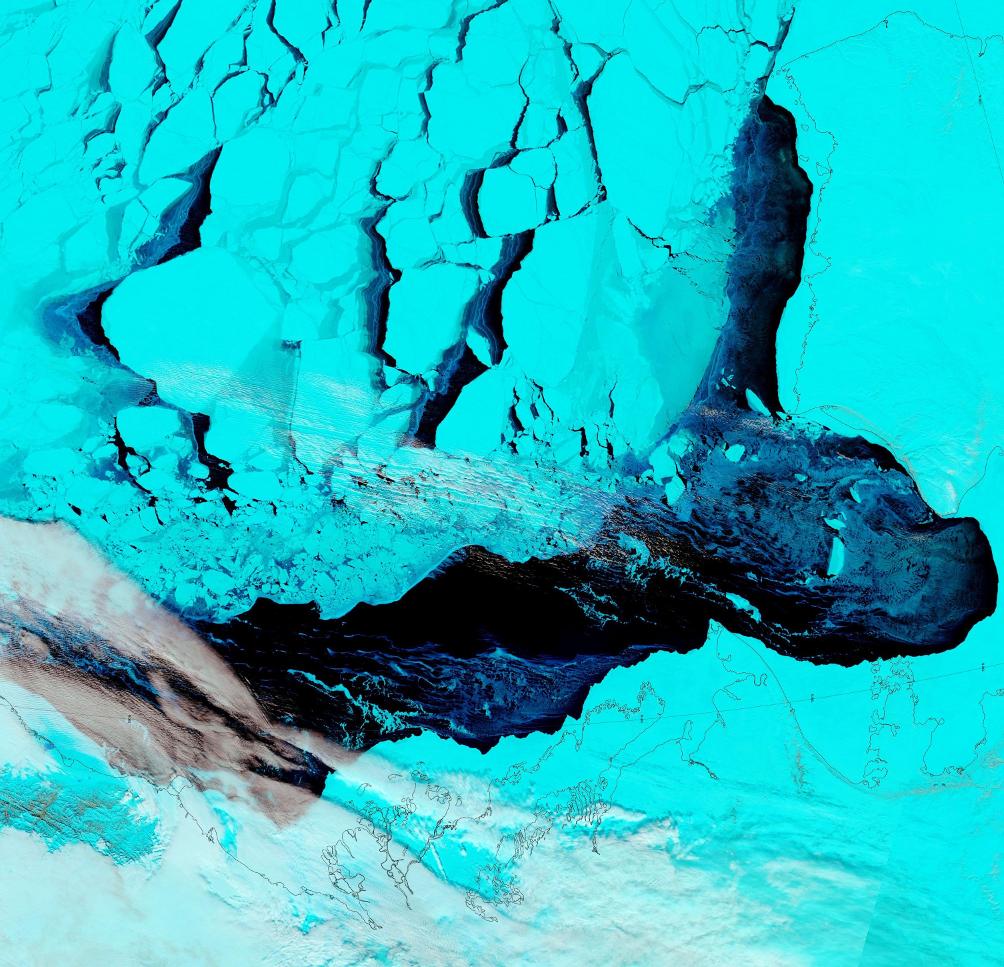
Wind waves with a height of around 1.5 meters and a period of 6 seconds wouldn’t tempt me to go out on a surfing expedition, but they would certainly be enough to interfere with the sea ice formation process, as you can see from this “pseudo-color” image of the Beaufort Sea on April 26th from the MODIS instrument on the Terra satellite:

NASA Worldview “false-color” image of the Beaufort Sea on April 26th 2016, derived from the MODIS sensor on the Terra satellite

Unfortunately the Jason 2 and recently launched Jason 3 satellites don’t measure wave heights in bodies of water as far north as the Beaufort Sea, so we’ll have to content ourselves with the modelled data from WaveWatch III. However here’s a brief video explaining how Jason 3 measurements are now used to assist WaveWatch forecasts further south:

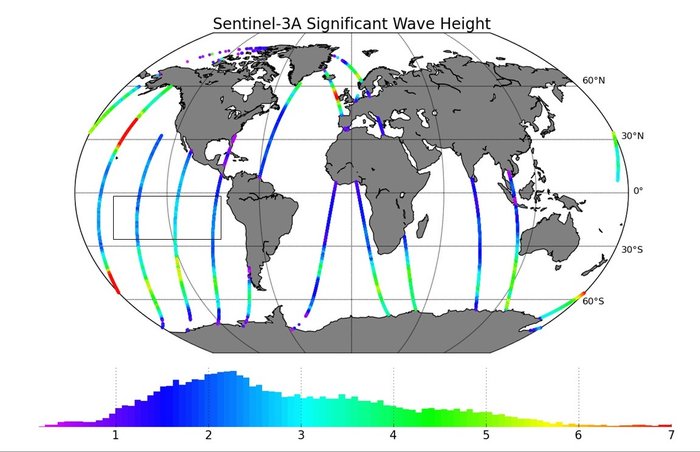
Whilst Jason 3 won’t be watching waves in the Arctic Ocean it looks as though the European Space Agency’s Sentinel 3A satellite will be providing wave height data for the Beaufort Sea in the not too distant future:

S3A_Wave_height_20160304

It also looks as though CryoSat-2 is already potentially providing such data, but as far as I can ascertain it’s not available in handy gridded format in the same way that the CS2 near real time ice thickness data is.

The Beaufort Gyre Goes Into Overdrive

According to the US National Snow and Ice Data Center, the Beaufort Gyre is:

A clockwise circulation (looking from above the North Pole) in the Beaufort Sea, north of Alaska. This circulation results from an average high-pressure system that spawns winds over the region.

beaufort_gyre

Such a high pressure system has been in place over the Arctic Ocean for a few days now, and the effect of the clockwise circulation on the sea ice in the Beaufort Sea is already evident in these recent satellite images:

NASA Worldview “true-color” image of the Beaufort Sea on April 9th 2016, derived from the MODIS sensor on the Terra satellite
NASA Worldview “false-color” image of the Beaufort Sea on April 12th 2016, derived from the MODIS sensor on the Terra satellite

as well as in this animation of sea ice movement since February:

The high pressure is forecast to continue for several more days. Here’s the GFS forecast for April 20th, courtesy of MeteoCiel:

Northern Hemisphere surface pressure forecast for April 20th 2016

which shows a large system with a central pressure of 1040 hPa still sitting over the Northern Beaufort Sea. Next here’s an animation from the US Navy which forecasts ice thickness until April 19th:

April 13th 2016 ACNFS Beaufort Sea thickness forecast until April 19th

Note in particular the large area of open water forecast to be produced in the Chukchi sea off Barrow, Alaska by the end of the period. The continuing clockwise winds have already started reducing the area of sea ice in the Beaufort Sea at an unusually early date:

2016-04-13-Beaufort-AMSR2-Area_001

Amongst other things we’ll be keeping a close eye on the ice area in the Chukchi Sea over the next few days. The sun is already starting to bathe that area of our planet with its rays, and open ocean soaks up that heat much more readily than bright white ice.

[Edit – 16/04/2016]

Here’s an animation of the effect on sea ice of the Beaufort Gyre in overdrive from Neven at the Arctic Sea Ice Blog:

Neven-Gyre-20160414

Notice how towards the end of the animation another huge part of the ice pack, north of the Canadian Arctic Archipelago is pulled into the Gyre. This is mostly multi-year ice.

Here also is a MODIS image of the Beaufort Sea processed by A-Team at the Arctic Sea Ice Forum to highlight the areas of new ice:

ATeam-BeaufortDay106-2016