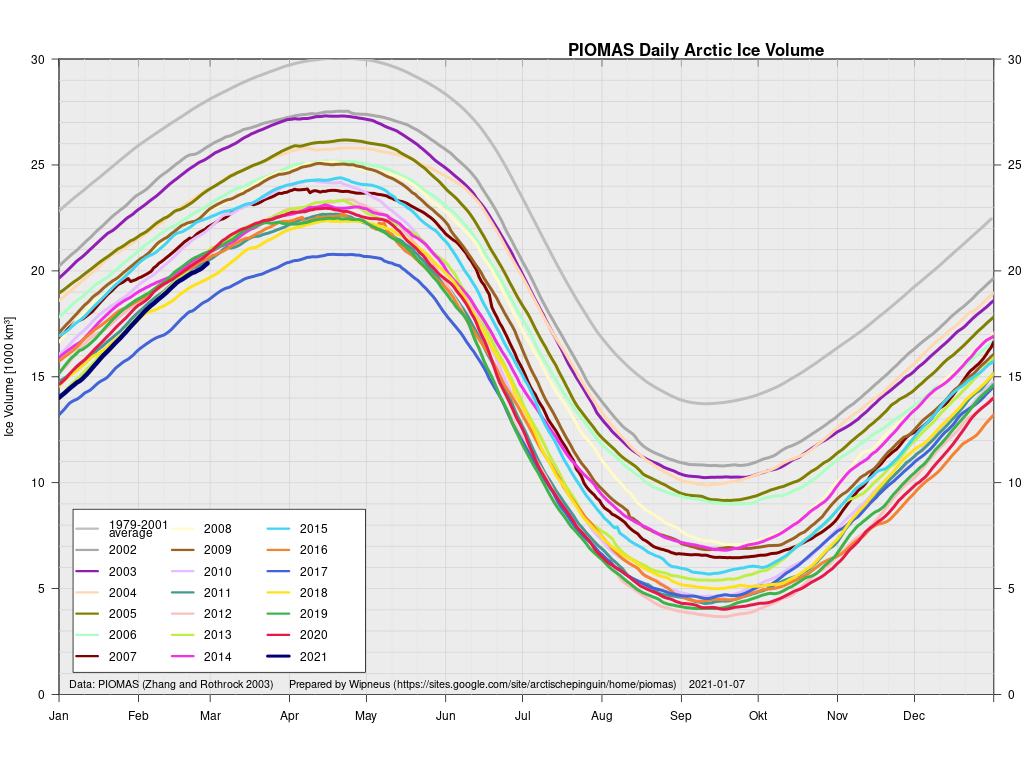
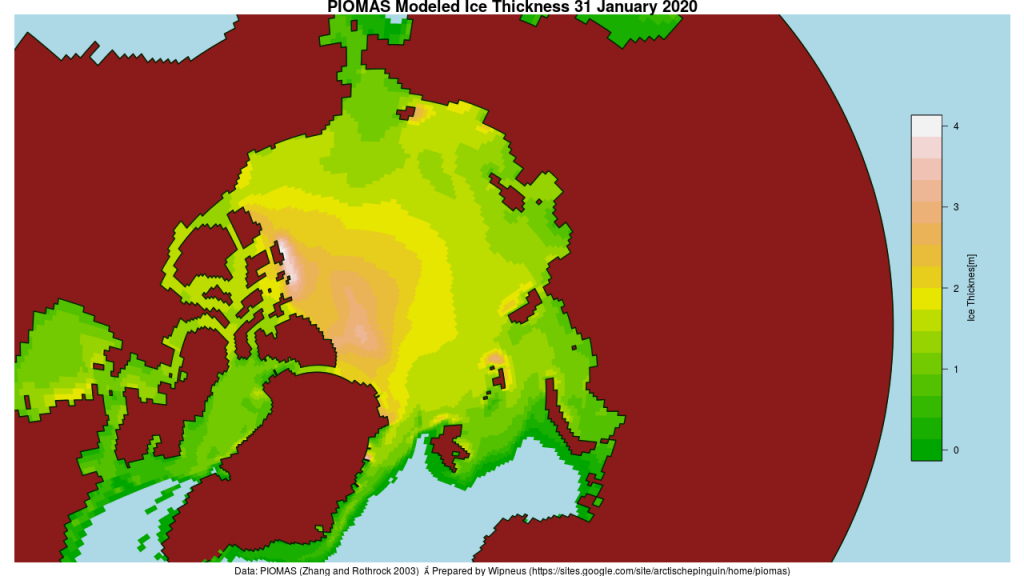
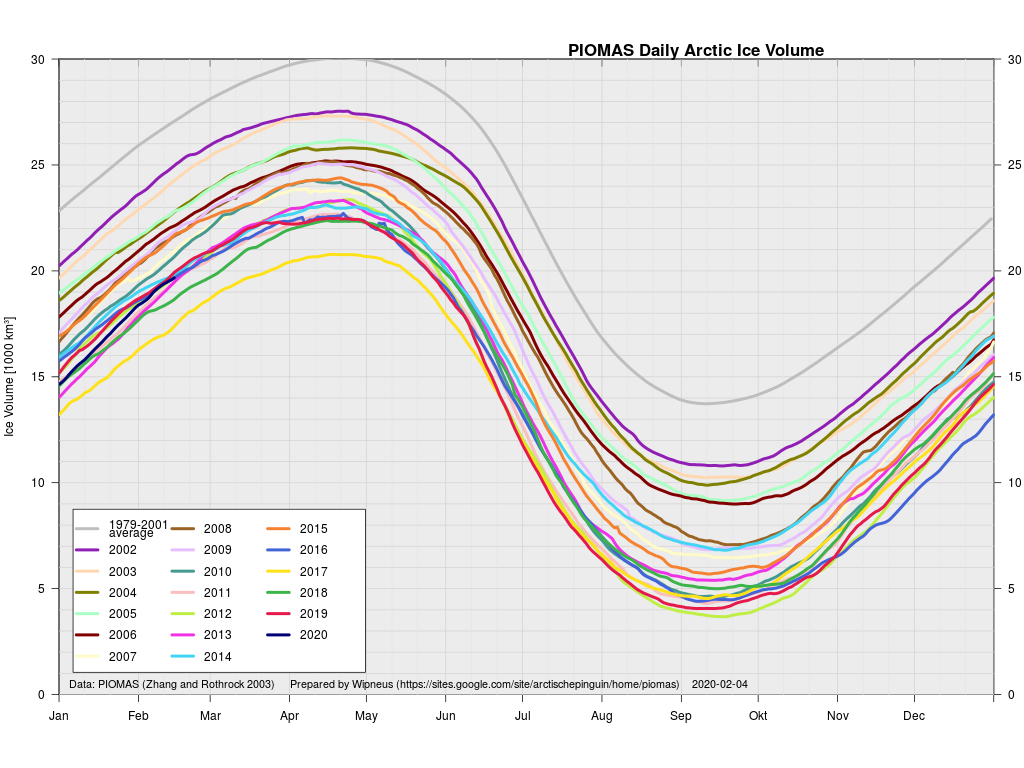
Maximum volume is still several weeks away, but let’s first of all take a look at the PIOMAS modelled volume numbers for February. They are not yet available via the University of Washington’s Polar Science Center web site, but Wipneus has once again crunched the gridded thickness numbers which are already available. Here is what they reveal:
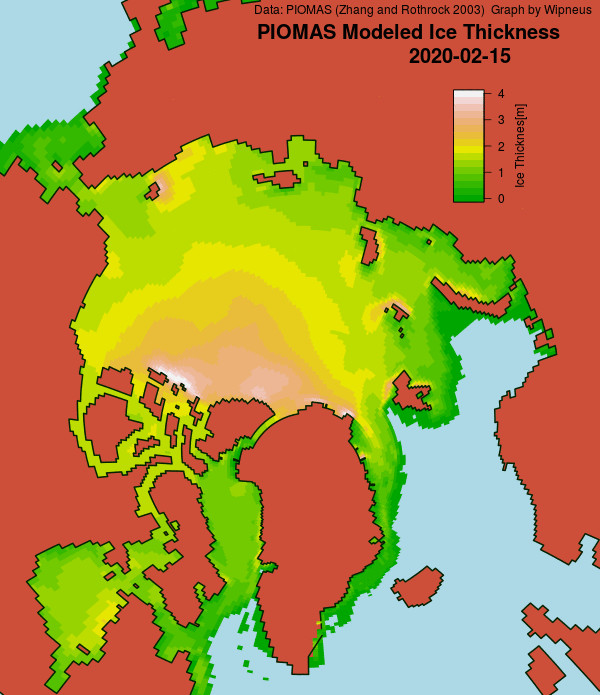
As you can see, it will be a big surprise if the 2021 volume maximum occurs in March rather than April, and 2021 is currently 3rd lowest for the date, behind 2017 and 2018. For completeness here too is the PIOMAS thickness map for the end of February:
This does contain some surprises, such as an area of thick ice along the shore of the East Siberian Sea, but no such thing along the north coast of Greenland, the traditional bastion of “the thickest ice in the Arctic Ocean”.
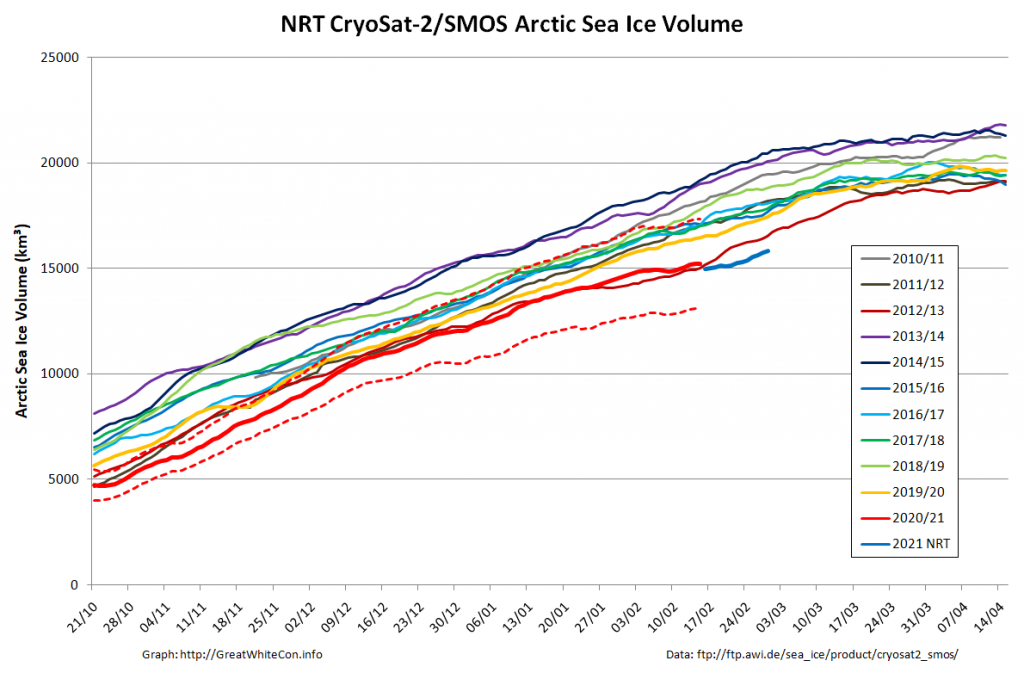
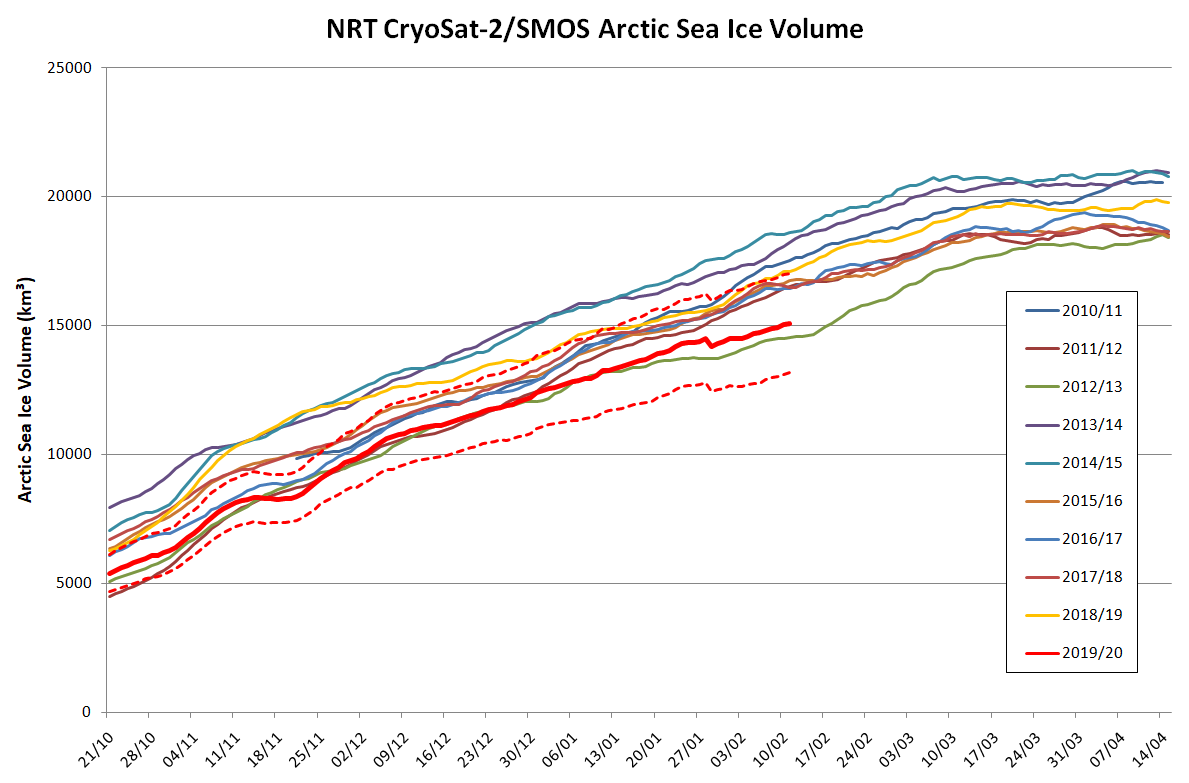
The “measured” Arctic sea ice volume calculated from CryoSat-2 and SMOS thickness data has also updated to February 28th:
Note that the “near real time” figures graphed in blue will almost certainly be revised upwards when the “reanalysed” data is released in a couple of weeks. Equally certainly they will be “lowest for the date” in the 11 year record.
Here also is the CS2/SMOS thickness map for February 28th for comparison purposes:
In the absence of the usual mid month PIOMAS Arctic sea ice volume update I’m being moaned at by “angech” over on Judith Curry’s “Climate Etc.” blog:
Any ideas on why PIOMAS mid month update not out, other than not wanting to show a big recovery?
Unlike any of Judy’s denizens I checked out the comparatively new merged CryoSat-2 plus SMOS thickness maps from the Alfred Wegener Institute. “Measured” rather than “modelled” data must be a good thing surely?
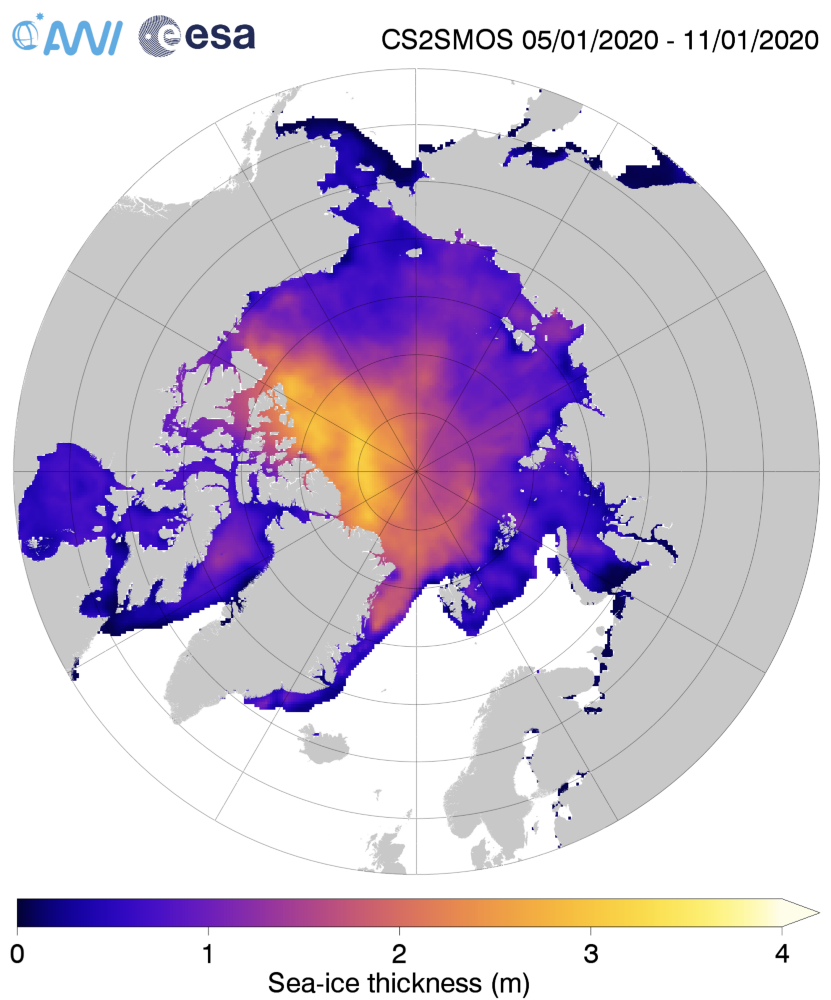
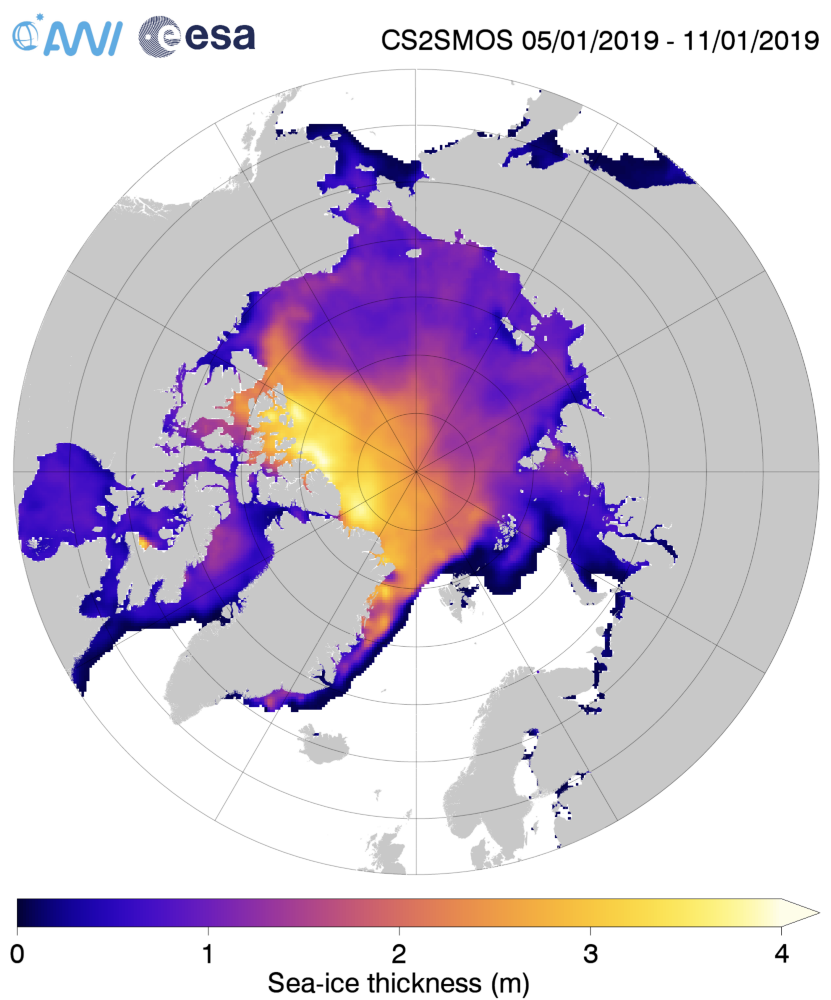
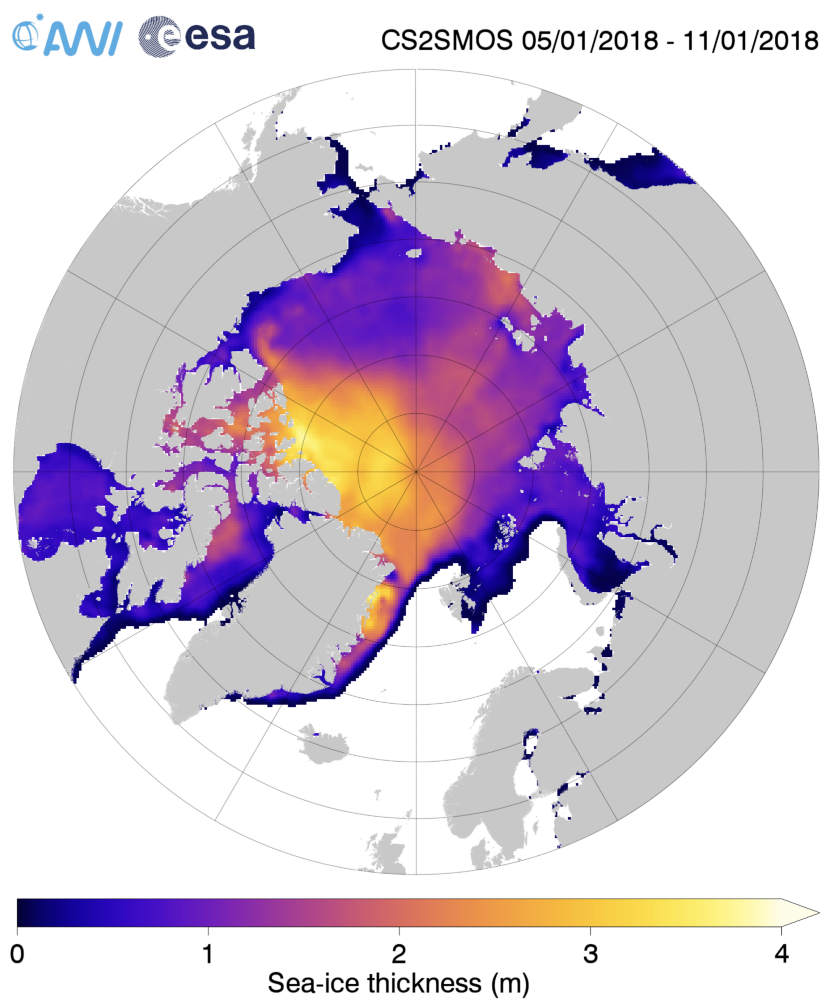
Just in case there’s some significant difference between the “reanalysis” and “operational” versions of that product, here is the AWI’s most recent reanalysed Arctic sea ice thickness map, for the week ending January 11th:
together with the same date from the previous two years:
Make sure to take a close look at the white areas north of Greenland and the Canadian Arctic Archipelago showing sea ice over 4 metres thick.
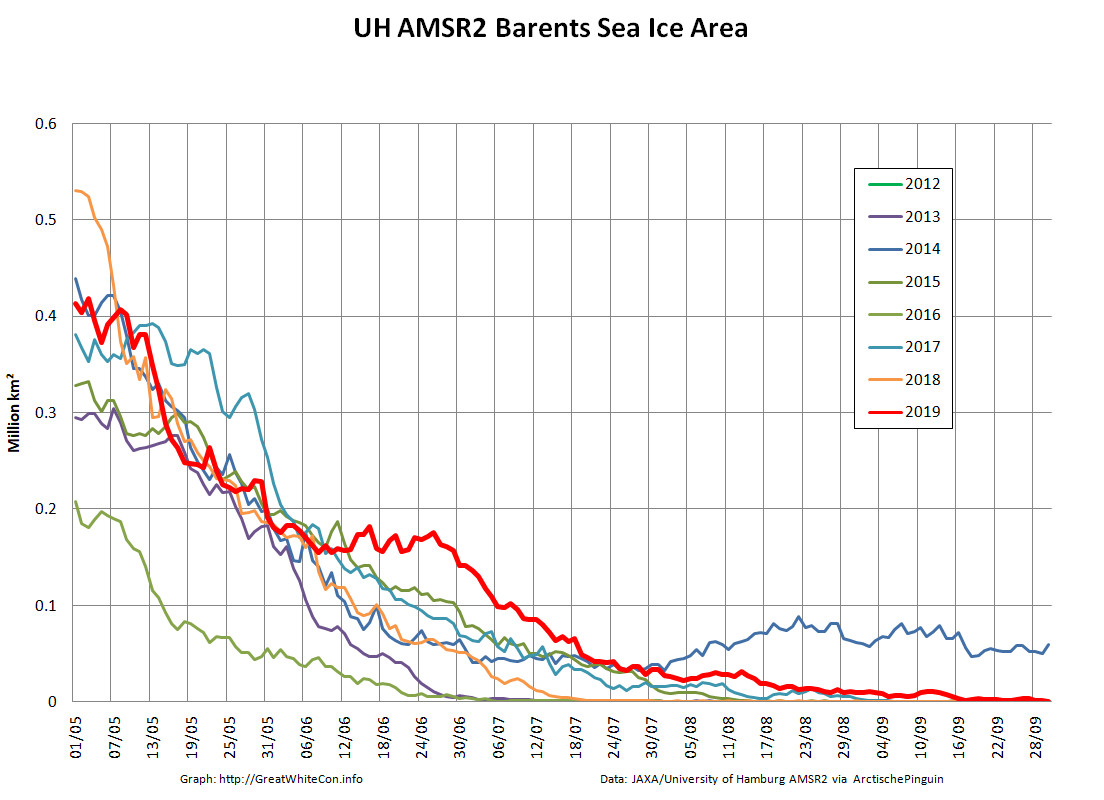
Over the winter of 2018/19 ASCAT revealed that there was a relentless movement of multi-year ice towards both the North Atlantic and the Beaufort Sea.
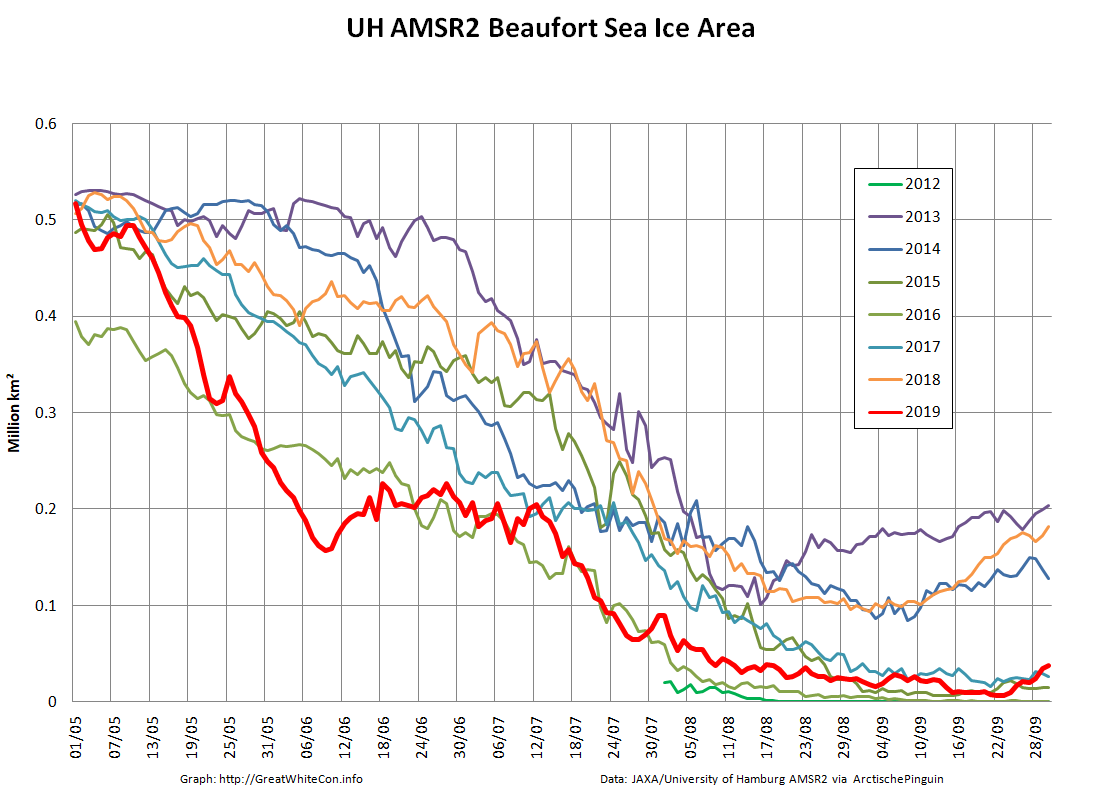
Not unexpectedly that meant that ice in the northern Barents Sea was slow to melt out in the summer of 2019:
whilst after a fast start the melt in the Beaufort Sea also suffered a “brief hiatus” in June before ultimately melting out almost completely as well:
Perhaps a significant amount of the multi-year ice that survived the winter of 2018/19 has now simply melted away in warm water, to be replaced by much less robust first year ice in the area between the North Pole and the Siberian coast? It will be very interesting to see what the next PIOMAS update in early February reveals.
[Edit – February 4th]
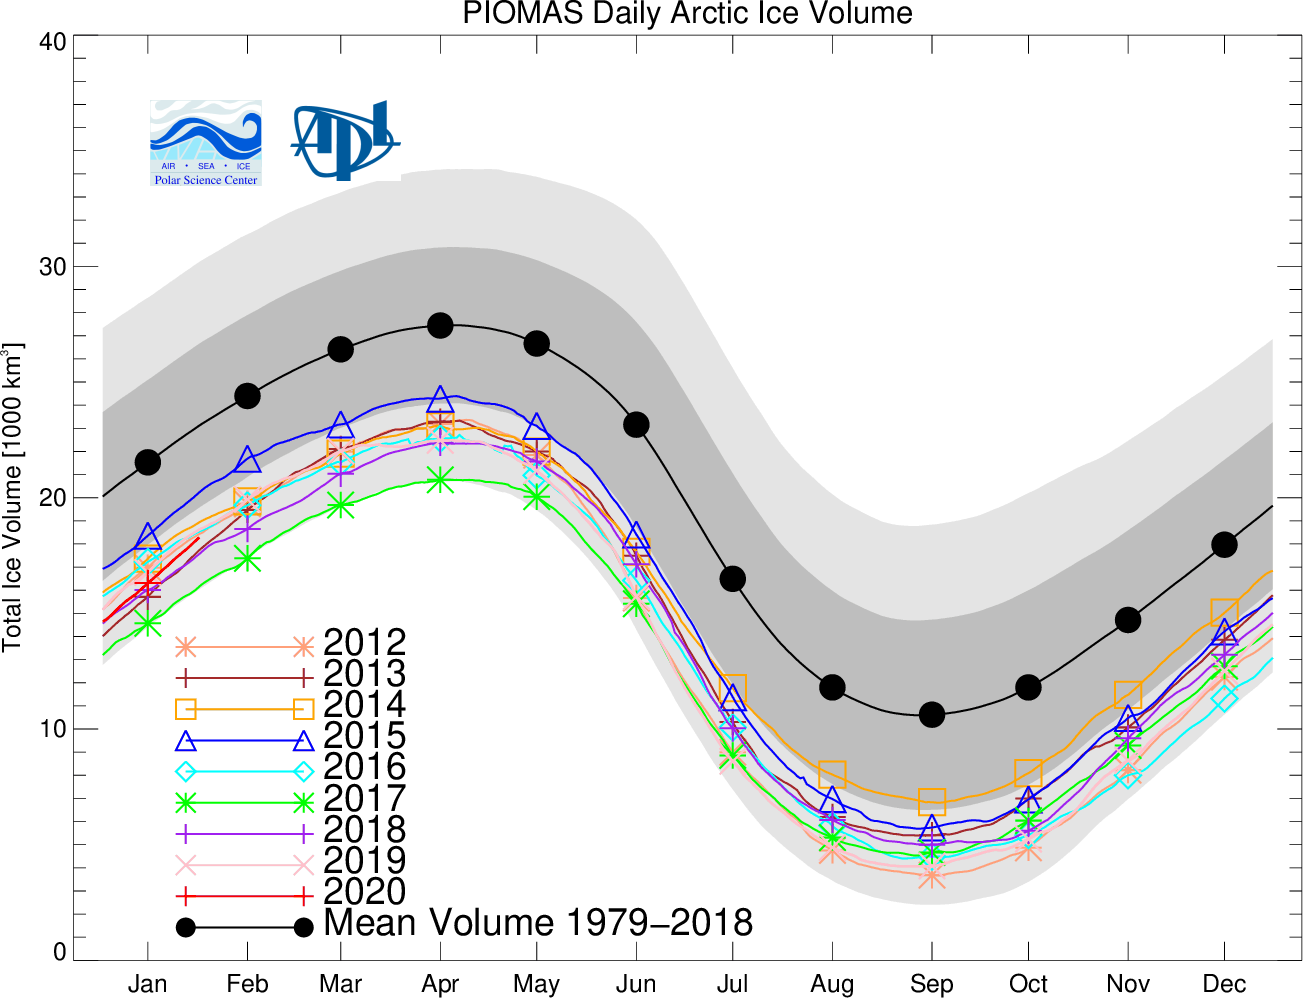
The next PIOMAS update referred to above has now arrived. Here’s the Polar Science Center’s graph:
Over on Climate Etc. angech is already exclaiming:
Strange it did go up a fair bit the old PIOMAS.
No publicity at the usual going down sites.
Actually it’s not at all strange, because thus far this winter the polar vortex has been remarkably well behaved. By and large cold air air has stayed in the Arctic. There hasn’t been much in the way of cold air intrusions into mid latitudes or warm air intrusions into the Arctic.
Hence it’s not at all surprising that the thickness of sea ice in the Arctic has been increasing slightly more quickly this winter than in other recent years. By way of some longer term context, here are the official Polar Science Center min/max trends:
[Edit – February 4th PM]
Wipneus has just released the January PIOMAS gridded thickness map. Here it is:
[Edit – February 5th]
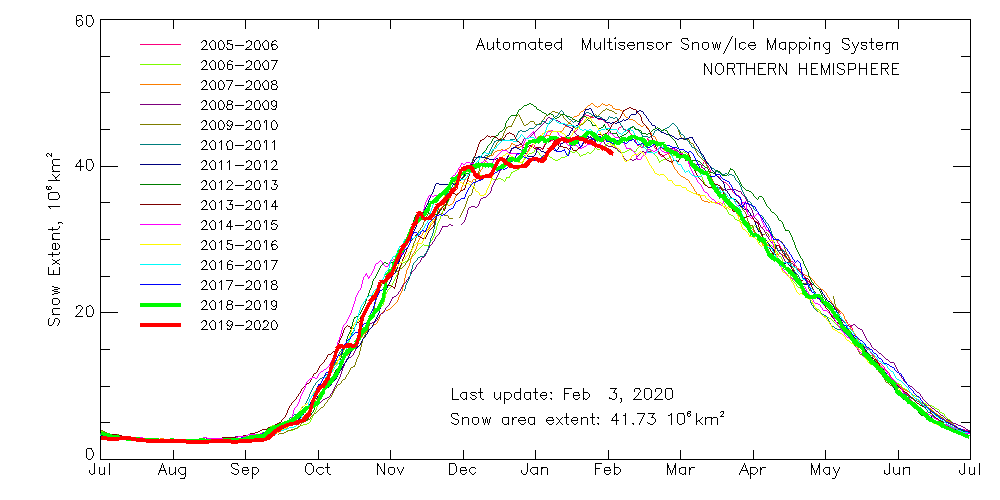
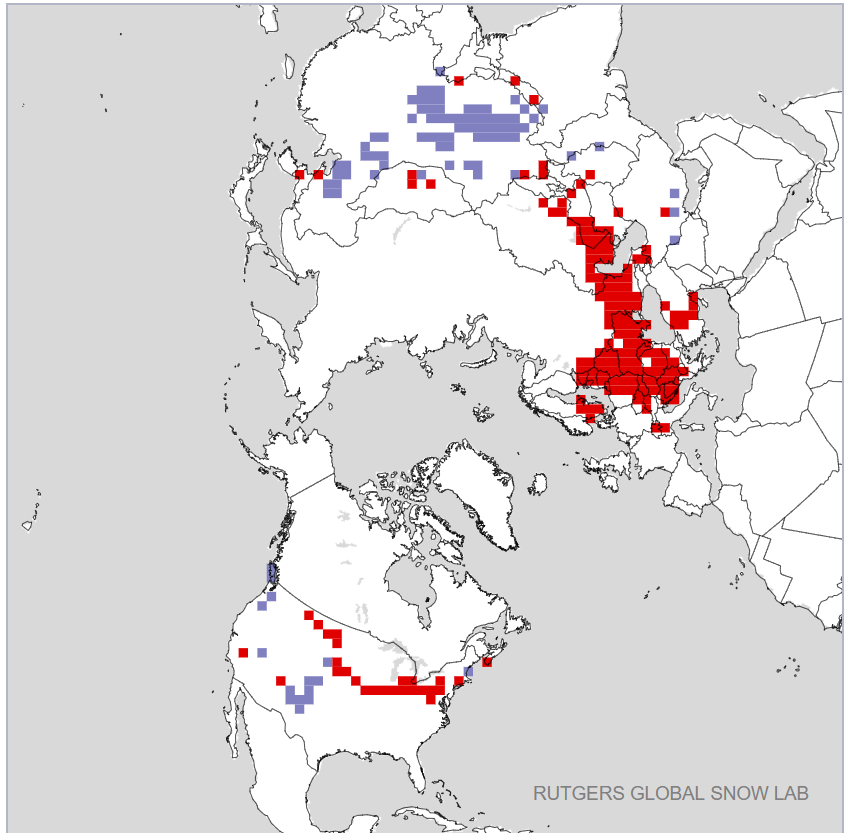
As is all too frequently the case, AdR and other commenters below get very excited about trivial increases in sea ice extent without considering snow extent. One side effect of the lack of cold air outbreaks into mid latitudes so far this winter currently looks like this:
[Edit – February 6th]
The AWI and PIOMAS sea ice thickness maps above look somewhat different at first glance. That being the case, I’ve written a program to crunch the AWI numbers. Here’s the result:
The source code plus raw and processed data can be accessed via the Arctic Sea Ice Forum:
Further support for my “polar vortex” theory, from Judah Cohen no less!
I think this plot best sums up the #winter for the Northern Hemisphere –#PolarVortex strength bouncing around from near (daily) record strong to normal all winter long. One more near record strong (PV) for latter half of February. Pretty much the nail in the coffin on this winter pic.twitter.com/OiSZw07VOF
I am forced to ponder once again why the CryoSat-2/SMOS thickness “measured” numbers just above seem to be more at variance with PIOMAS in 2020 than in previous years:
[Edit – February 22nd]
Here’s another weekly NRT volume update:
This time I’ve left off the NRT data from February 6th onwards, since the “issue” referred to above obviously hasn’t been solved yet. As an added bonus here’s a graph showing the trends (or lack thereof) on 3 dates during the October to April freezing season:
This website uses cookies to improve your experience. We'll assume you're ok with this, but you can opt-out if you wish. Cookie settingsACCEPT
Privacy & Cookies Policy
Privacy Overview
This website uses cookies to improve your experience while you navigate through the website. Out of these, the cookies that are categorized as necessary are stored on your browser as they are essential for the working of basic functionalities of the website. We also use third-party cookies that help us analyze and understand how you use this website. These cookies will be stored in your browser only with your consent. You also have the option to opt-out of these cookies. But opting out of some of these cookies may affect your browsing experience.
Necessary cookies are absolutely essential for the website to function properly. This category only includes cookies that ensures basic functionalities and security features of the website. These cookies do not store any personal information.
Any cookies that may not be particularly necessary for the website to function and is used specifically to collect user personal data via analytics, ads, other embedded contents are termed as non-necessary cookies. It is mandatory to procure user consent prior to running these cookies on your website.