This isn’t exactly “shock news”, since we (slightly hesitantly!) predicted this 5 days ago.
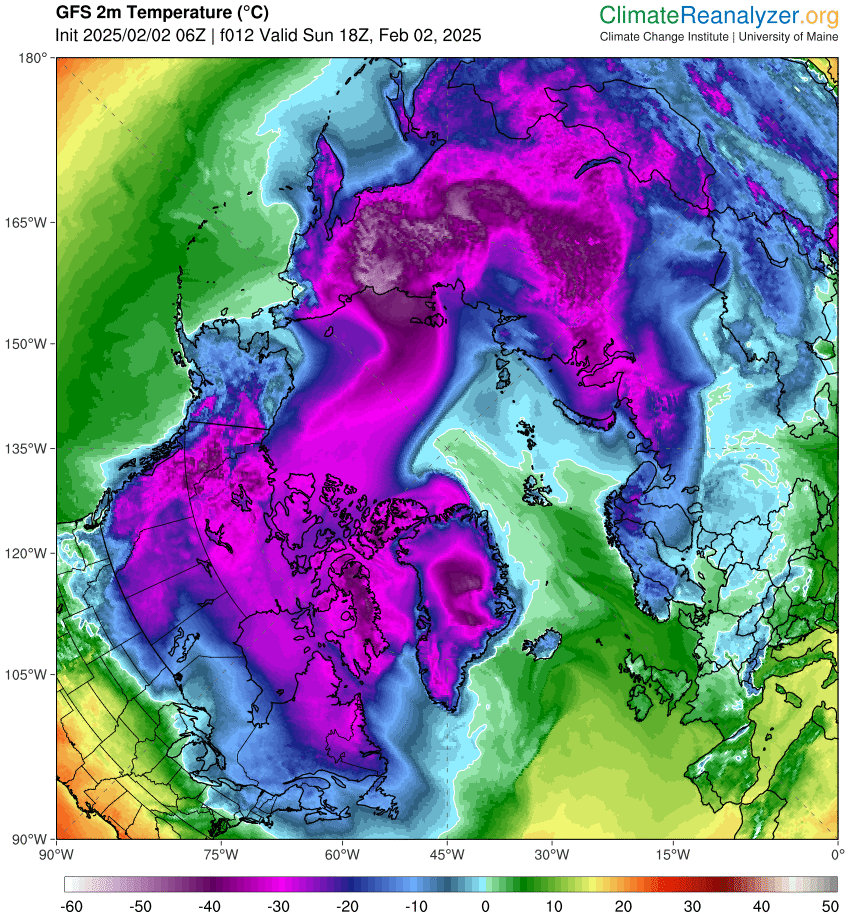
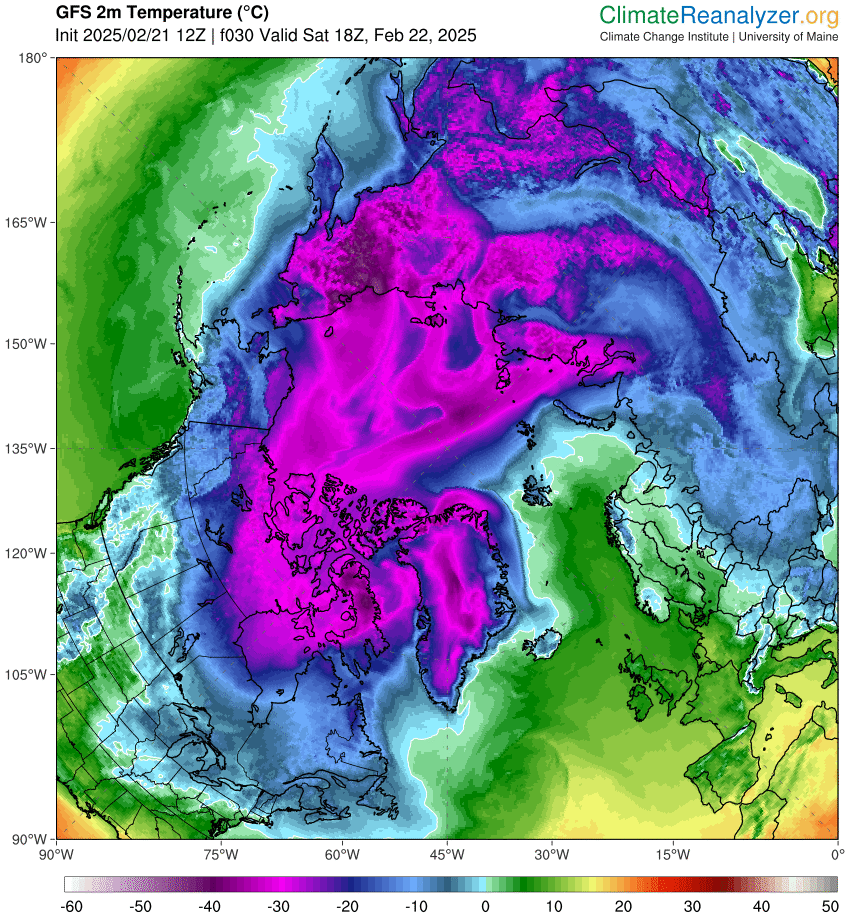
A GFS 2 meter temperature chart revealing greater than zero degrees Celsius at the North Pole later today:
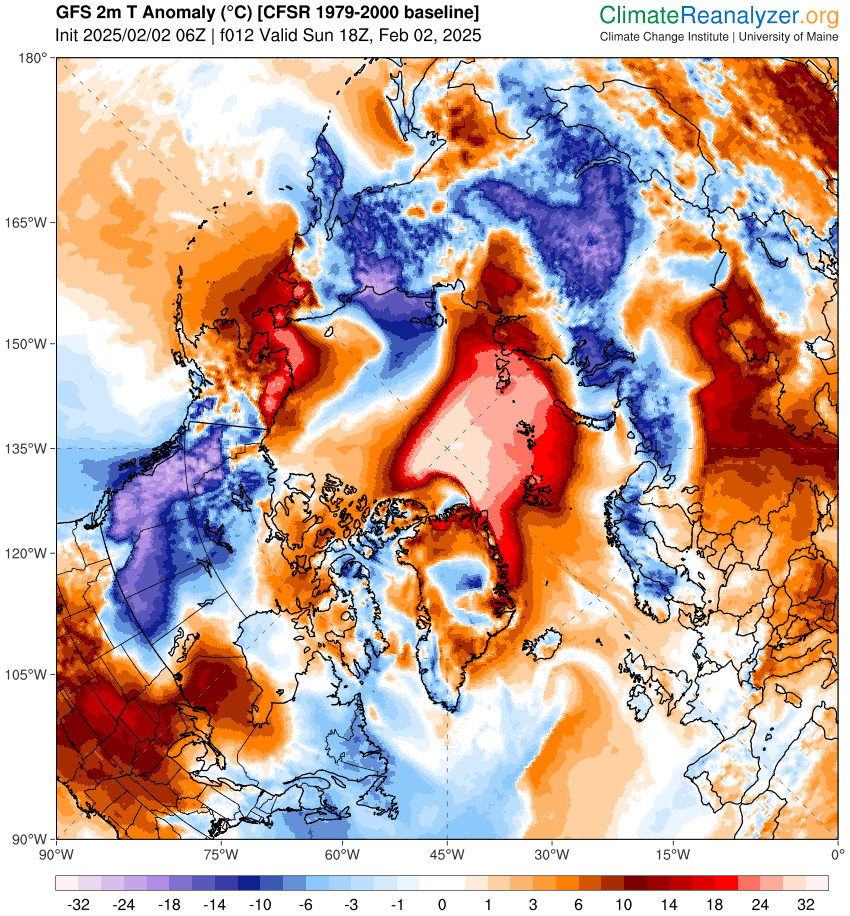
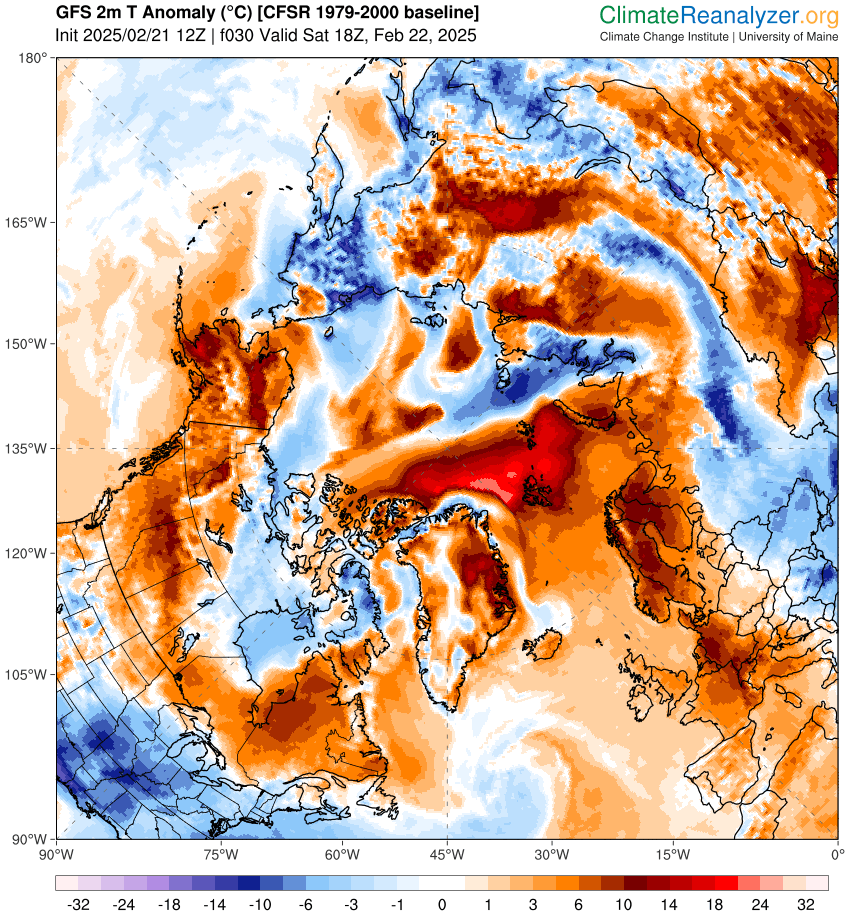
The 2 meter temperature anomaly at the Pole is almost off the charts:
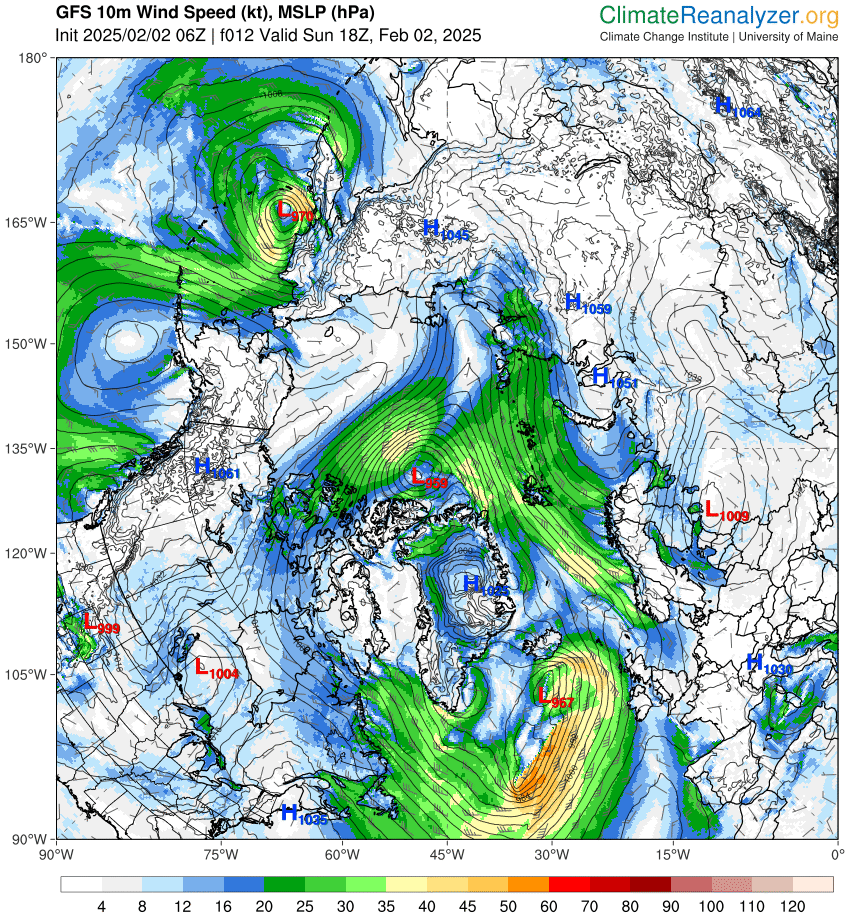
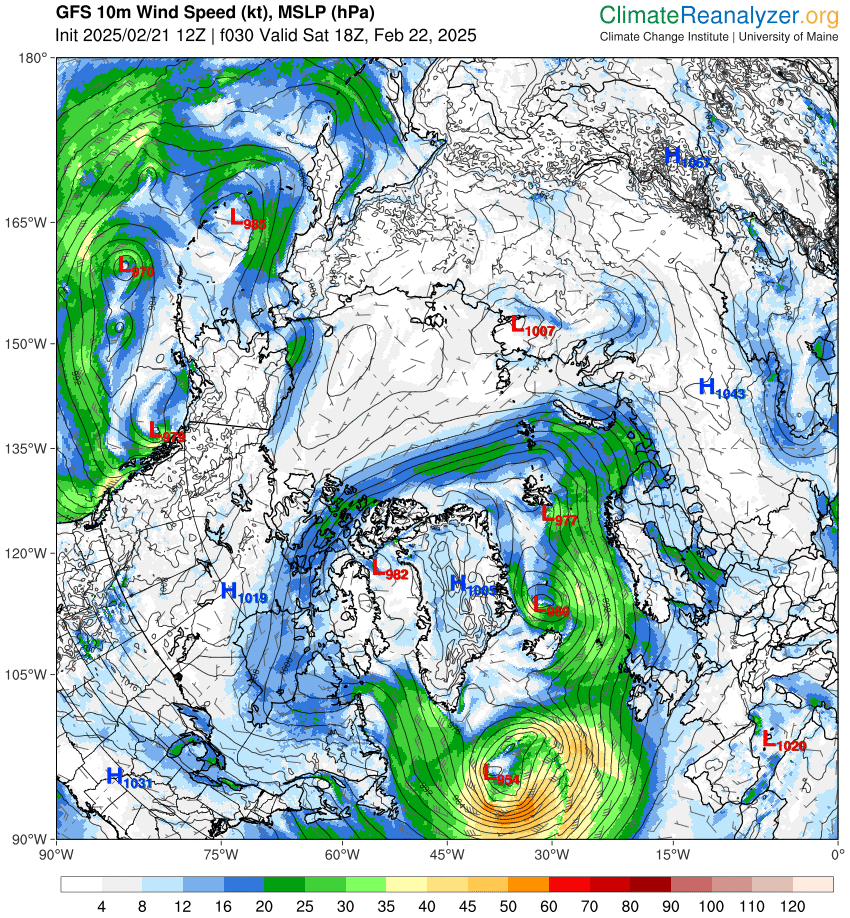
Plus the cause of these unusual numbers, a cyclone with central pressure of 959 hPa spinning north of Ellesmere Island at 18:00 UTC this evening:
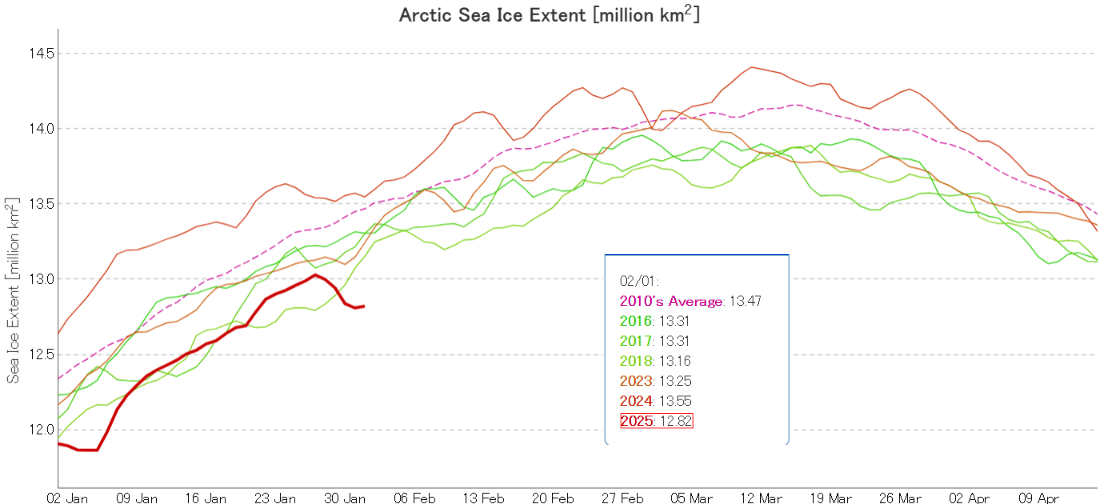
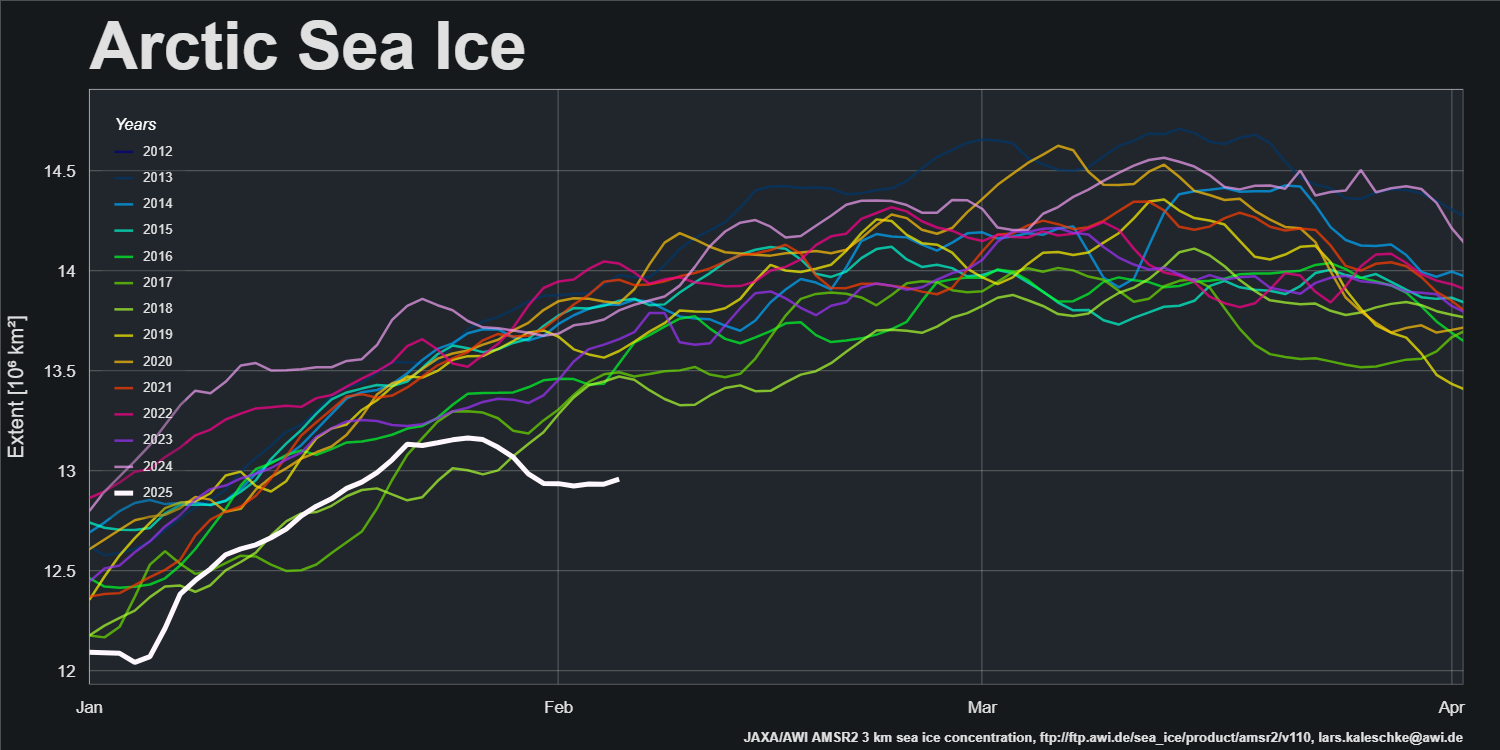
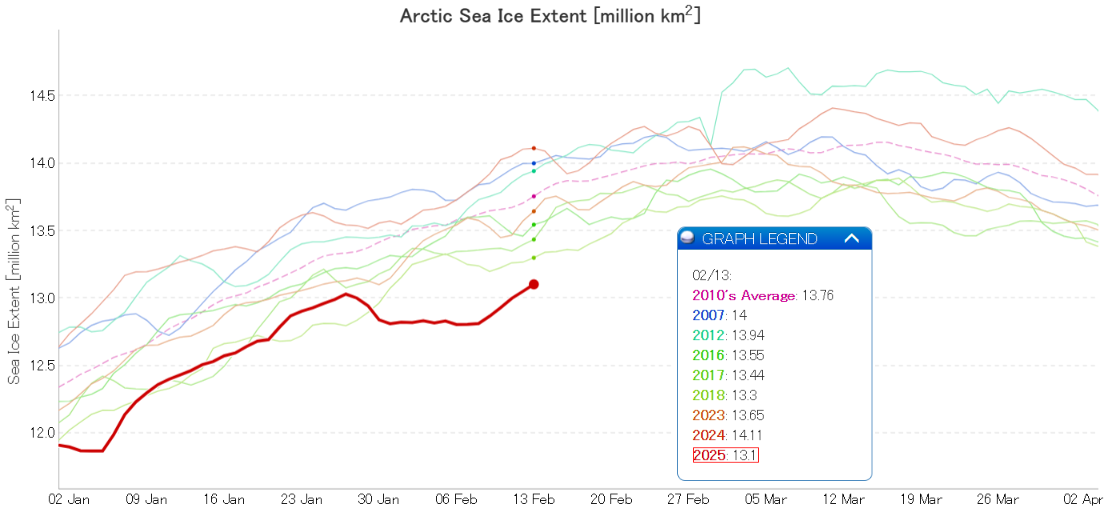
All of which has led to the JAXA/Vishop Arctic sea ice extent being the lowest for the date since 1979 at least by a significant margin:
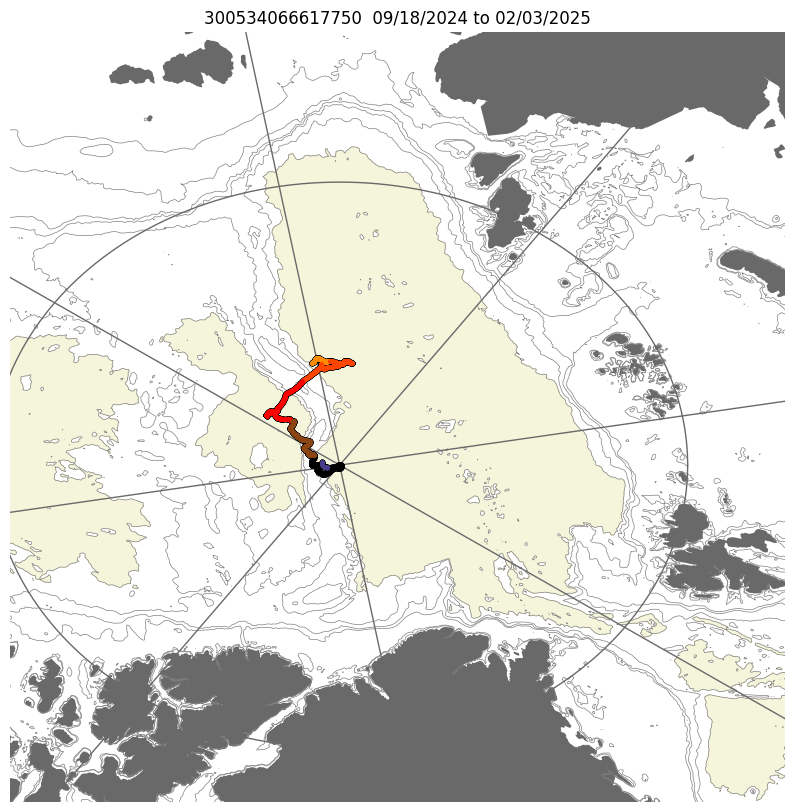
Thanks to a heads up from @Joackiie on BlueSky, I have just learned that the data from snow buoy 300534066617750 confirms that the atmospheric temperature at the North Pole did briefly become positive yesterday.
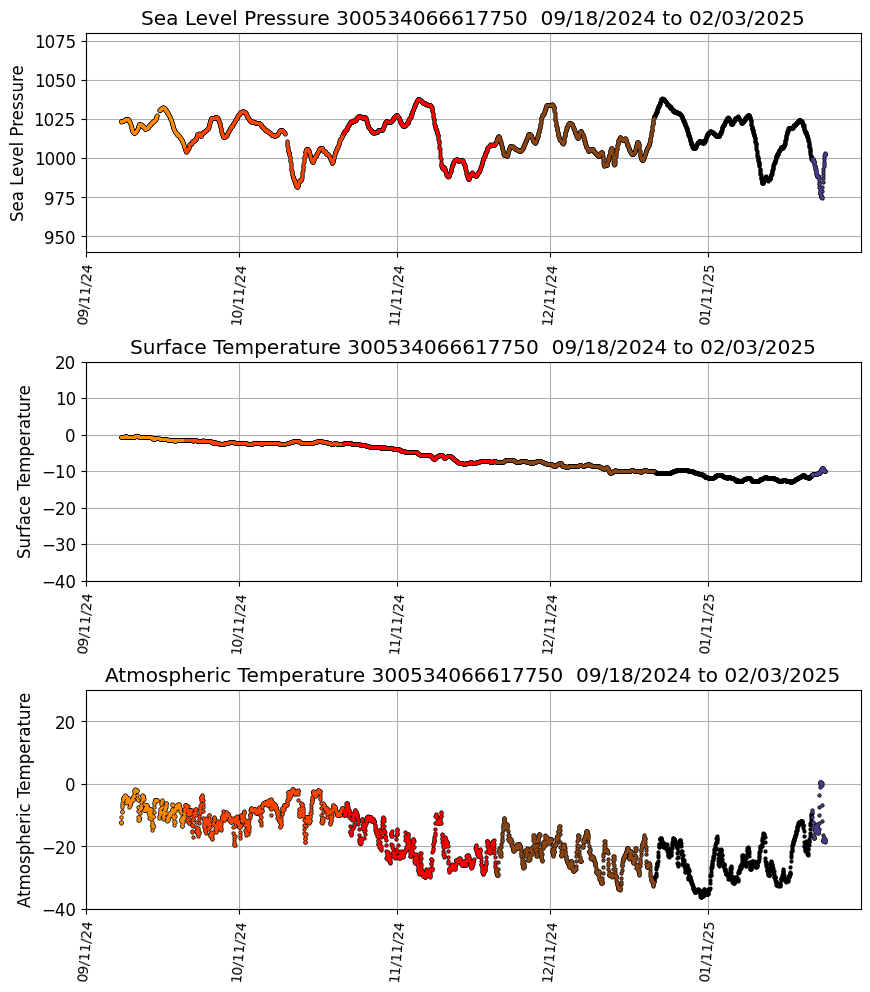
Pressure dropped below 975 hPa:
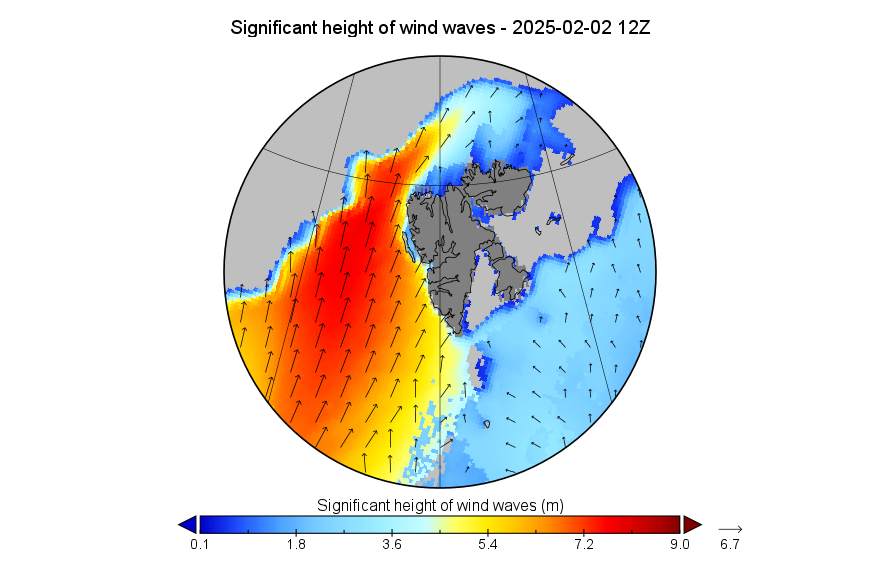
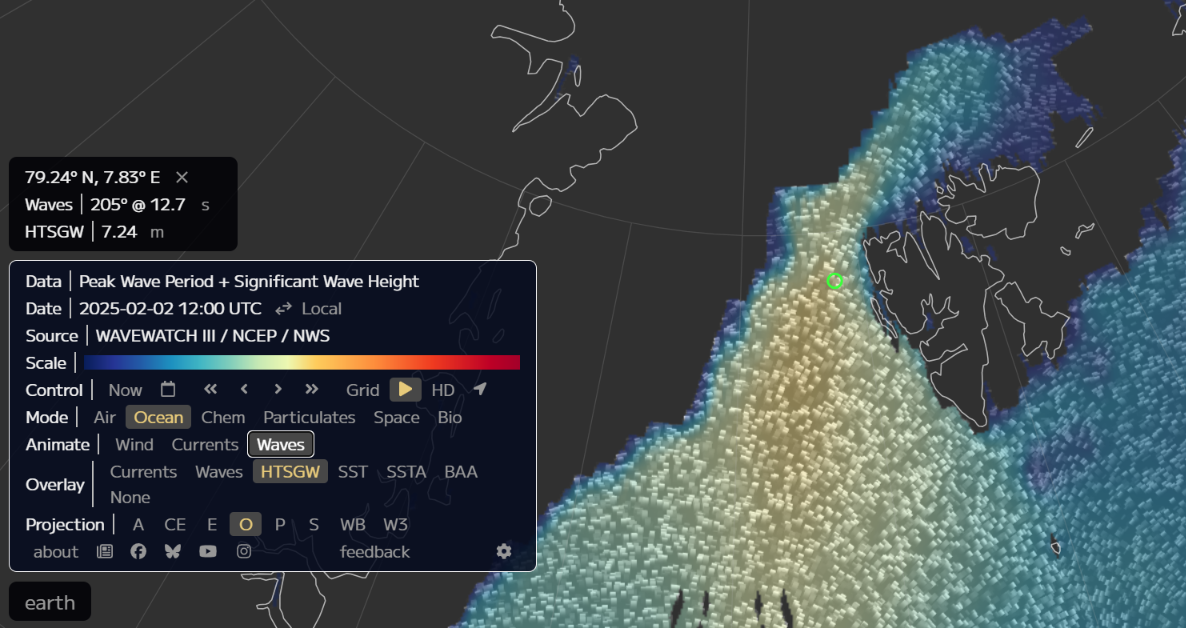
Here’s a close up of the Wavewatch III model’s predicted wave size for noon on February 2nd, centred on Svalbard:
Here too are earth.nullschool‘s maps of temperature:
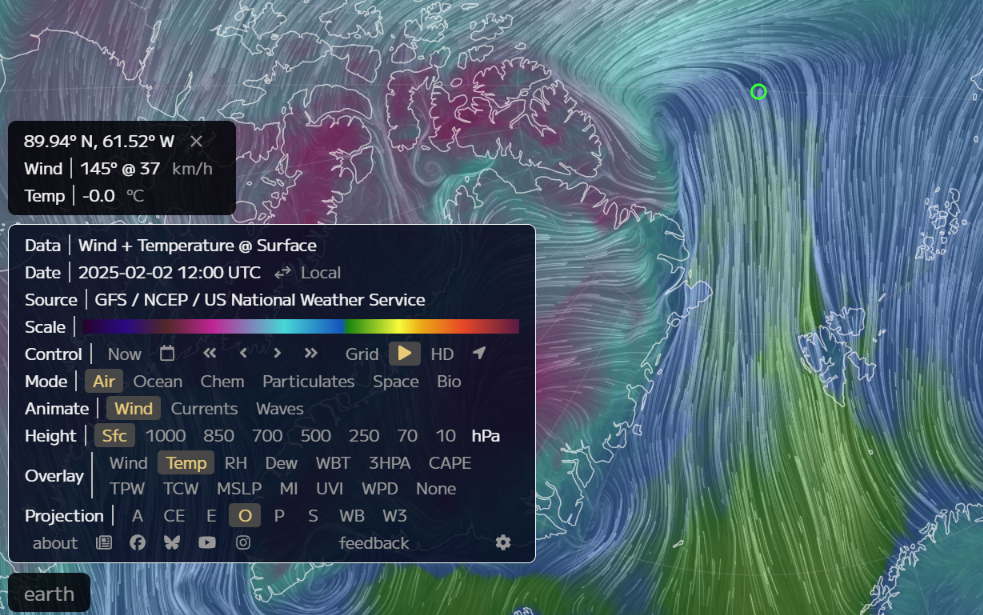
and wind wave significant height near Svalbard for the same date and time:
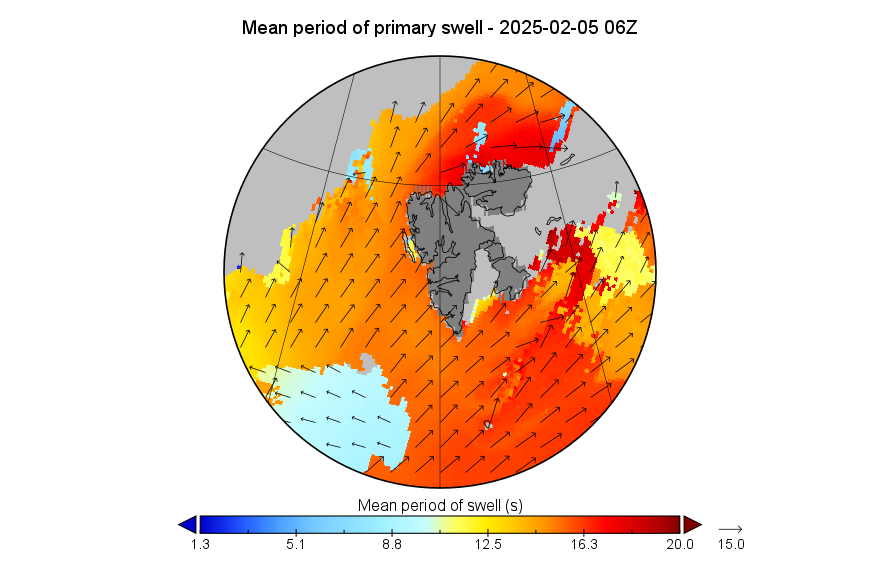
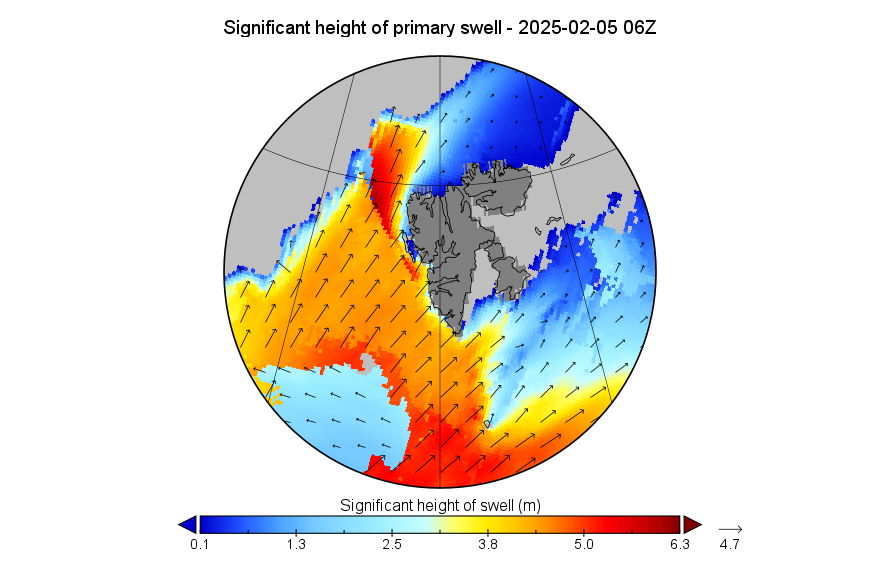
Here is the February 5th 0Z Wavewatch III surf forecast for 6Z:
Has anybody ever previously surfed the north shore of Spitsbergen in the dark?
Do Red Bull UK have access to choppers with searchlights?
I called the Great White Con Arctic basin big wave surfing team leader Andrew Cotton to give him the heads up, but he didn’t pick up. Perhaps he’s en route to the far north even as we speak?
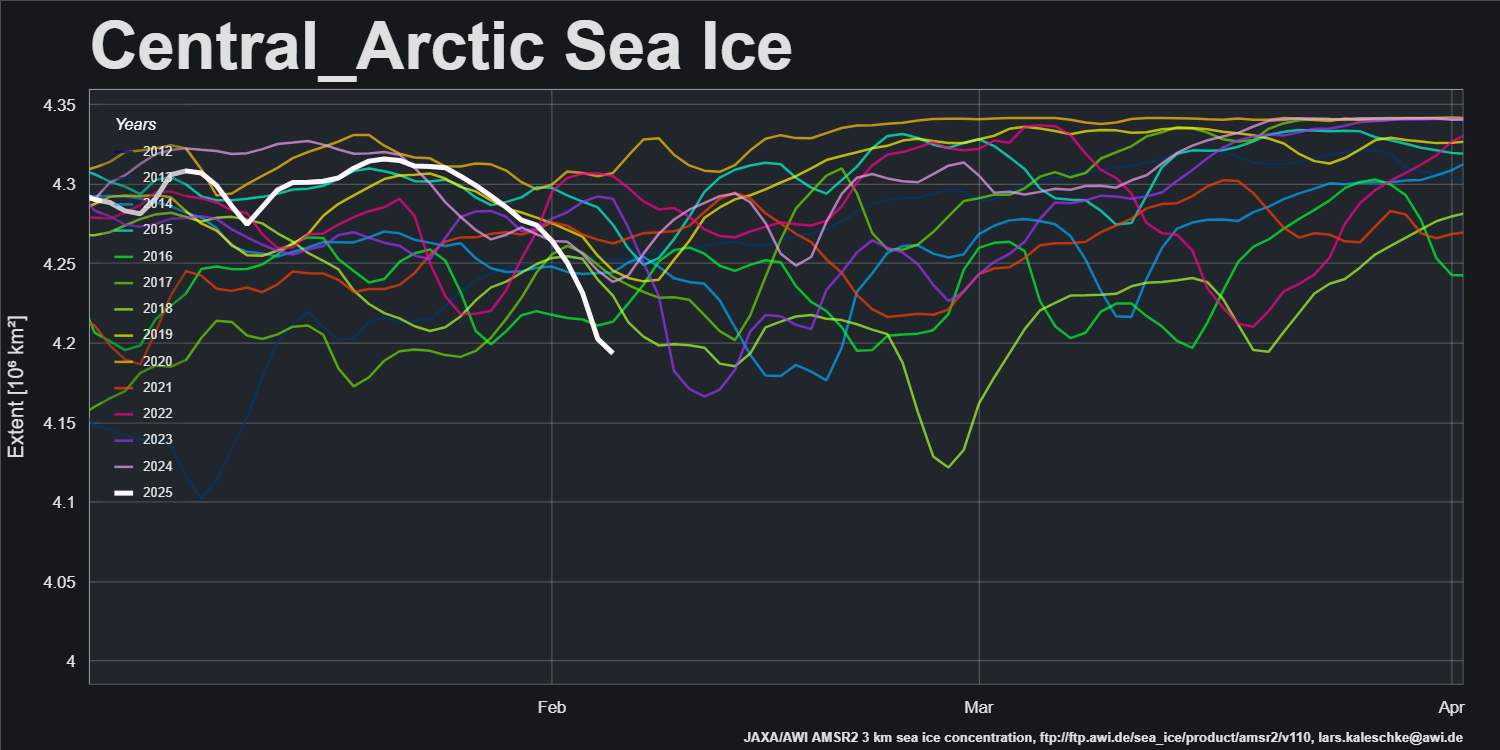
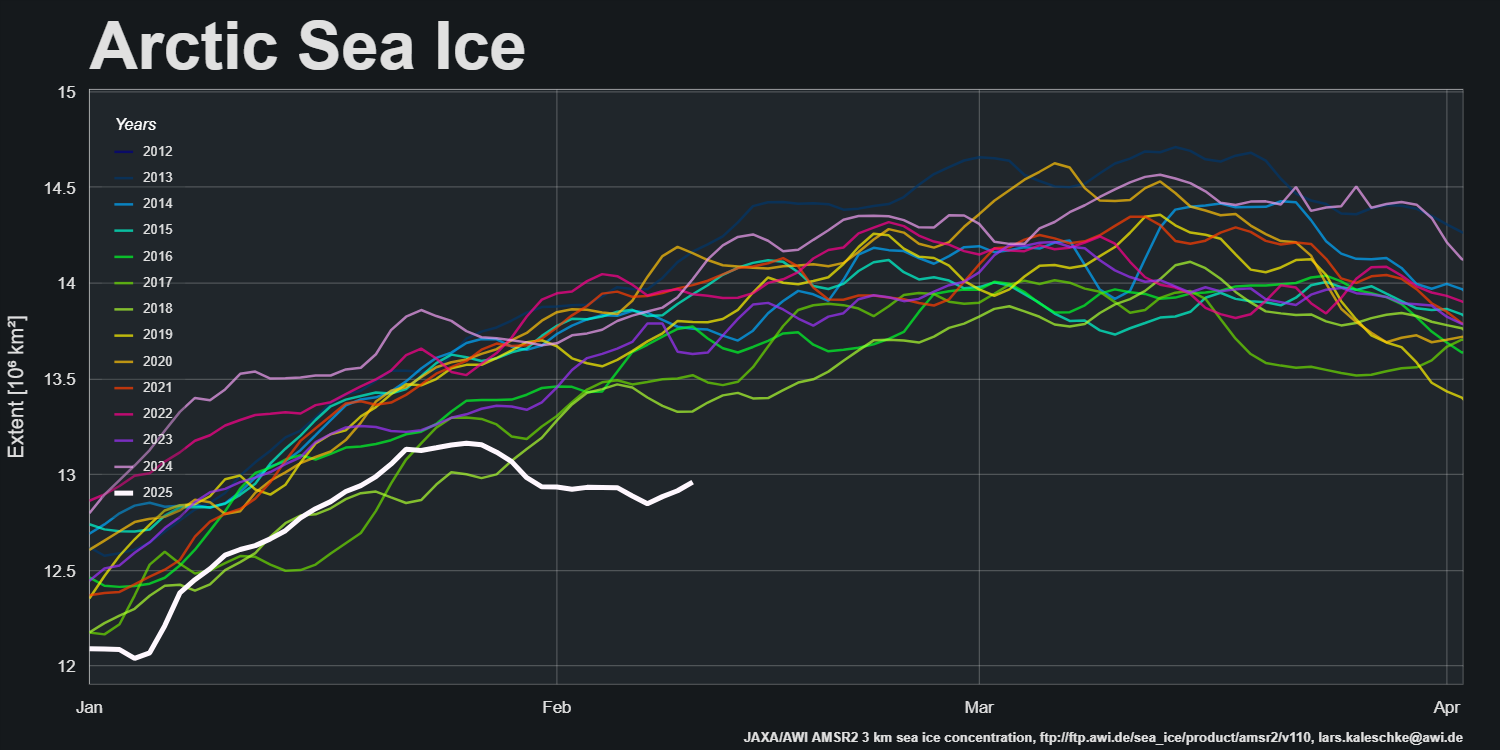
Currently both pan Arctic and Central Arctic Basin sea ice extent are lowest for the date in the AMSR2 record:
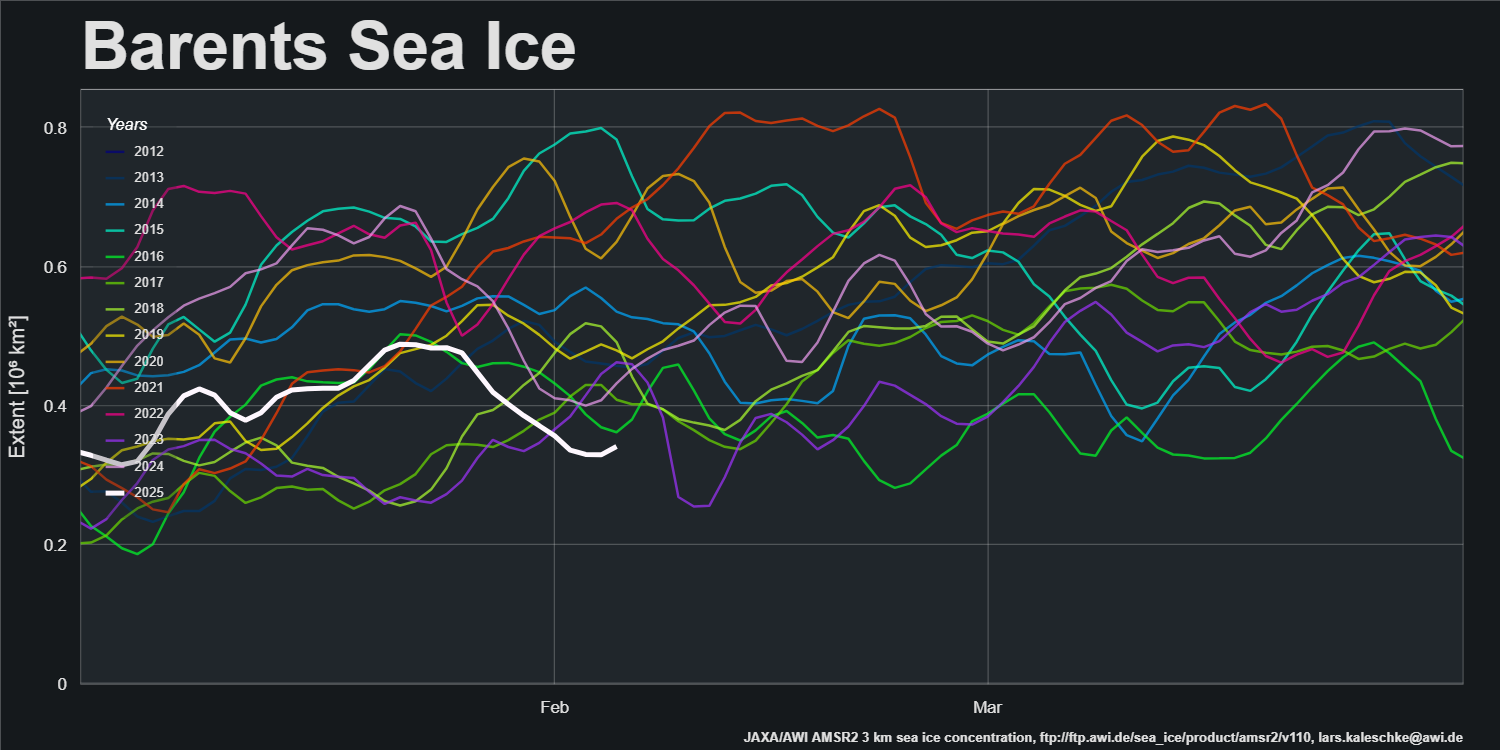
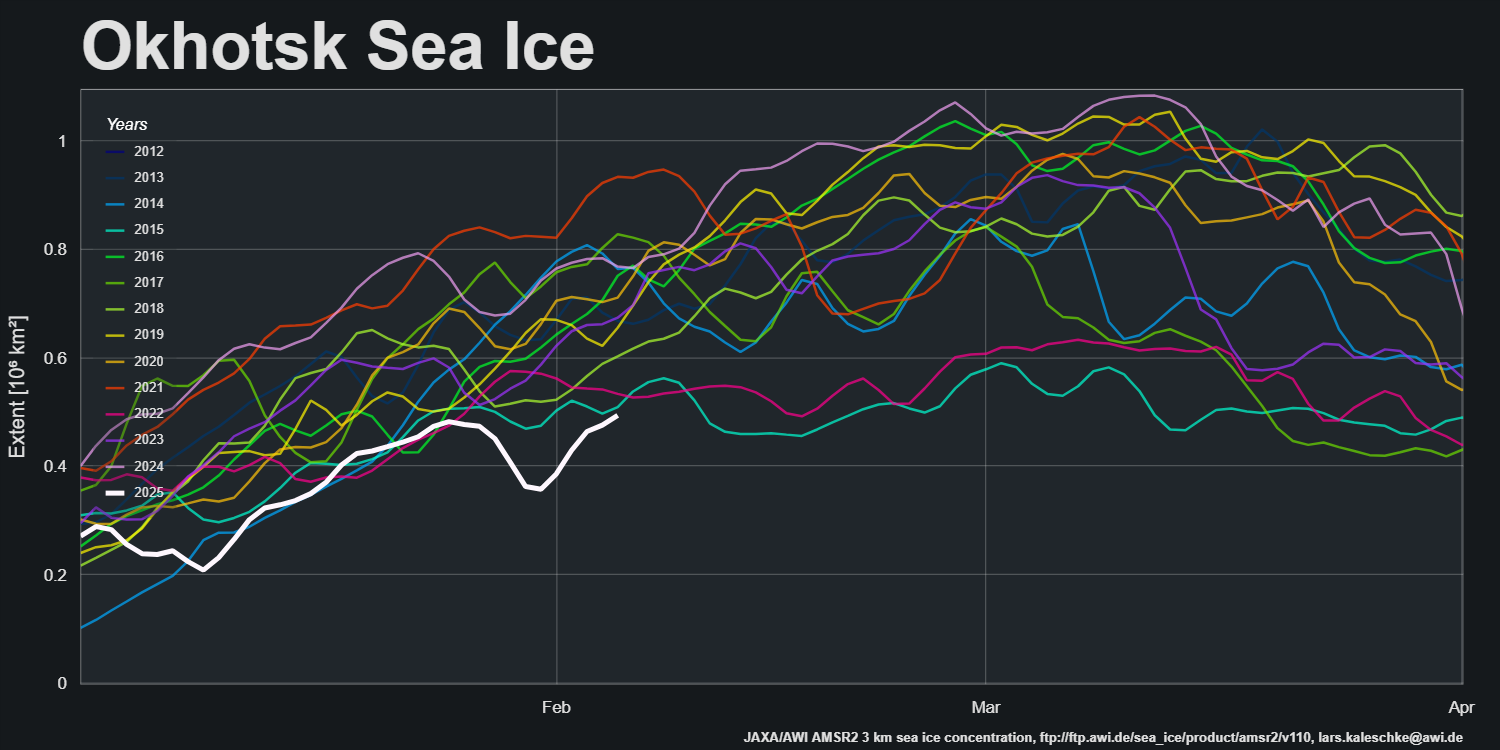
Given the “surf forecast” above it probably won’t come as a surprise to discover that the OSI-SAF’s Svalbard sea ice area metric is also currently at a record low level. The same applies to extent in the Sea of Okhotsk and the Barents Sea:

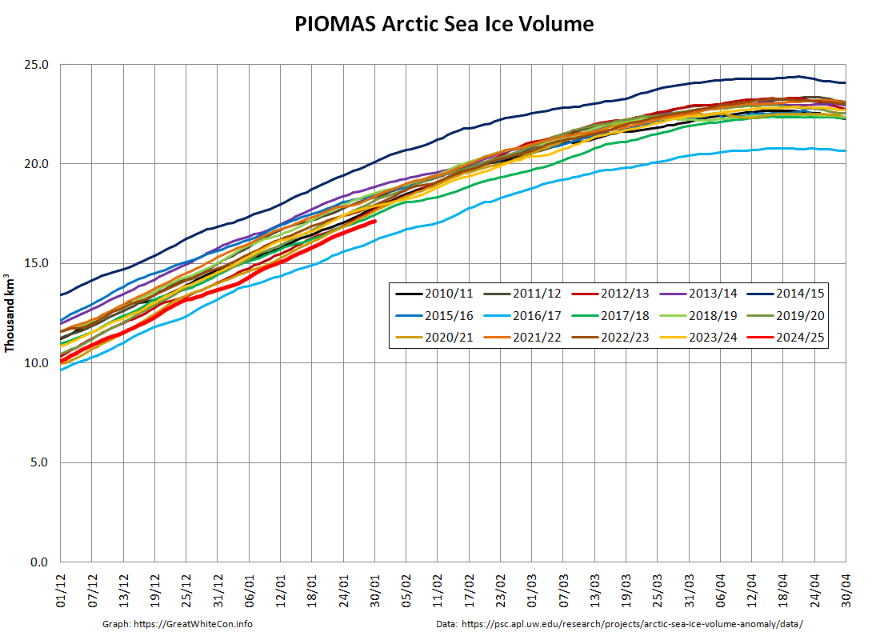
The January 2025 PIOMAS gridded thickness data has been released:
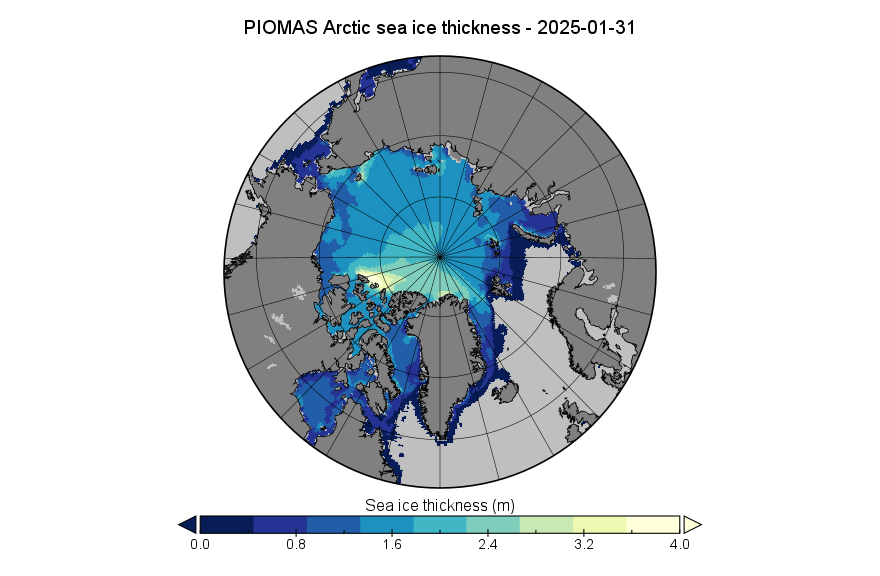
By January 31st Arctic sea ice volume had increased to 17.11 thousand km³, still 2nd lowest for the date in the PIOMAS record:
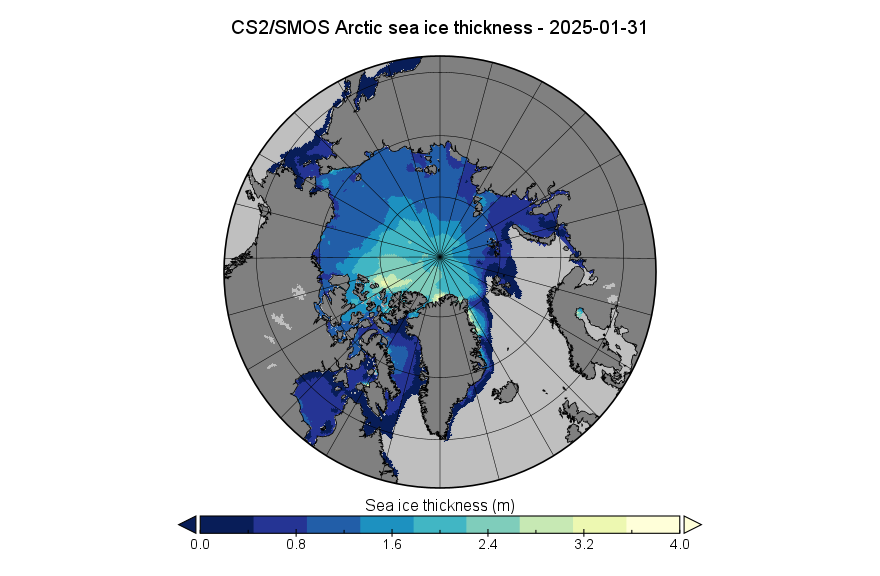
For comparison purposes, here is the “near real time” CryoSat-2/SMOS merged thickness data from the Alfred Wegener Institute:
Together with the associated volume graph:

At long last Arctic sea ice extent is starting to recover:
JAXA/ViSHOP extent has reached a new high of 13.10 million km² for the year:
Another warm air incursion into the Arctic Basin has begun. The GFS 2 meter temperature chart shows temperatures reaching zero degrees Celsius and above in the Fram Strait and northern Barents Sea tomorrow evening:
Temperatures anomalies are over 20 degrees Celsius between Greenland and Svalbard:
A procession of low pressure areas are feeding warmth and moisture from the North Atlantic through the Norwegian Sea and into the Central Arctic:
To be continued…
I don’t really know if it’s an error but it looks like this storm managed to create some open water areas in NE Greenland. Also this “gyre” in the subpolar Atlantic will generate more problems until Sunday at least, looking in the troposphere at 500 hPa i can see a really interesting pattern, namely a butterfly block between an anticyclone in the Pacific and one in the Kara Sea, according to my archive something like that also happened in 1985. In the end, these cyclones aren’t good news for the Atlantic flank.
Hi Ion,
Thanks for your input. You make some pertinent comments!
Are you by any chance a “professional” in these matters?
Hopefully I’ll have the time to add some more pertinent info of my own soon, but currently I’m also (madly?) busy on (anti!)social media.
Big waves in the Arctic demand the skills of professional big wave surfers!
Jim
I’ll be modest here, i’m not an expert, just an observer. I use my knowledge of meteorology to analyze perhaps one of the most obvious sign of GW, the decline of Arctic sea ice, it’s a tragedy, i must say but i think we need to look more onto it.
Any news on the Piomas monthly volume for January?
It should be out soon!
The gridded thickness data is out, but I’m frantically busy on non Arctic stuff just at the moment.
PIOMAS versus CS2 should be up later today.
Jim Massa has a new ocean heat content talk on the “meers” youtube channel. Seems like the record low extent/volume of arctic ice is due to the nonlinear ohc increase – stratification is messed up so more heat going to the surface to the melt the ice. It’s also messing up phytoplankton that creates aerosols to cool the atmosphere. It’s all gonna accelerate – the “jerk” kicking in.
The last 2 lowest maximum volumes,2017&2018, turned into tame melting seasons. I wonder if the aerosols will save the Arctic this summer, because it’s looking like another low maximum this year.