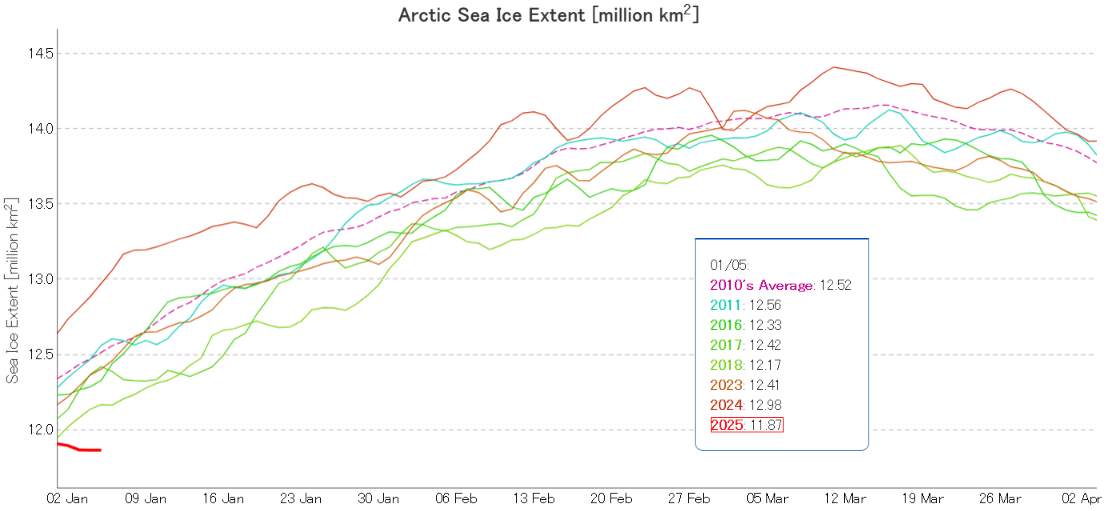
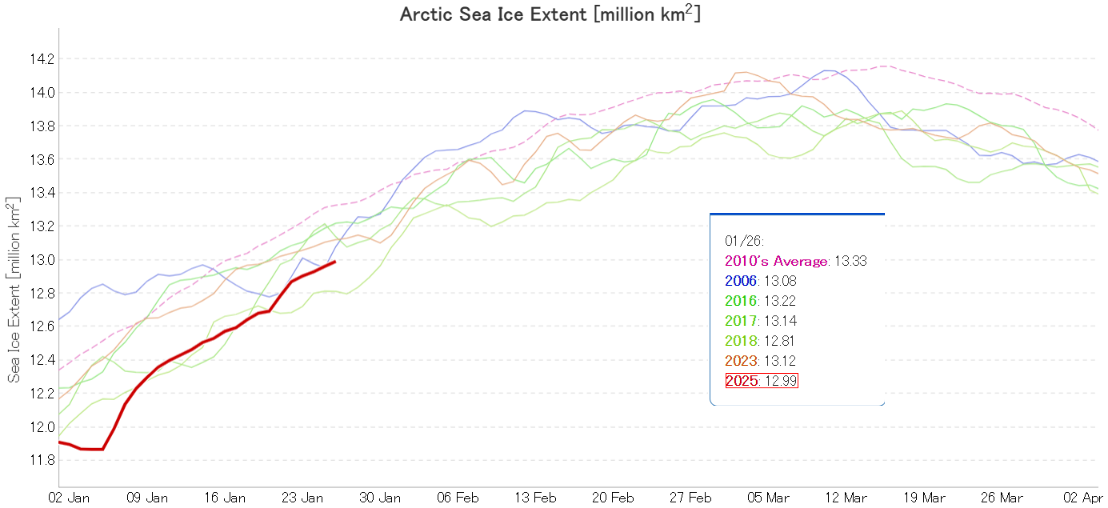
The New Year began with JAXA/ViSHOP extent lowest for the date in the satellite era, just below 2018 . Since then extent has reduced, and there is now a large gap:
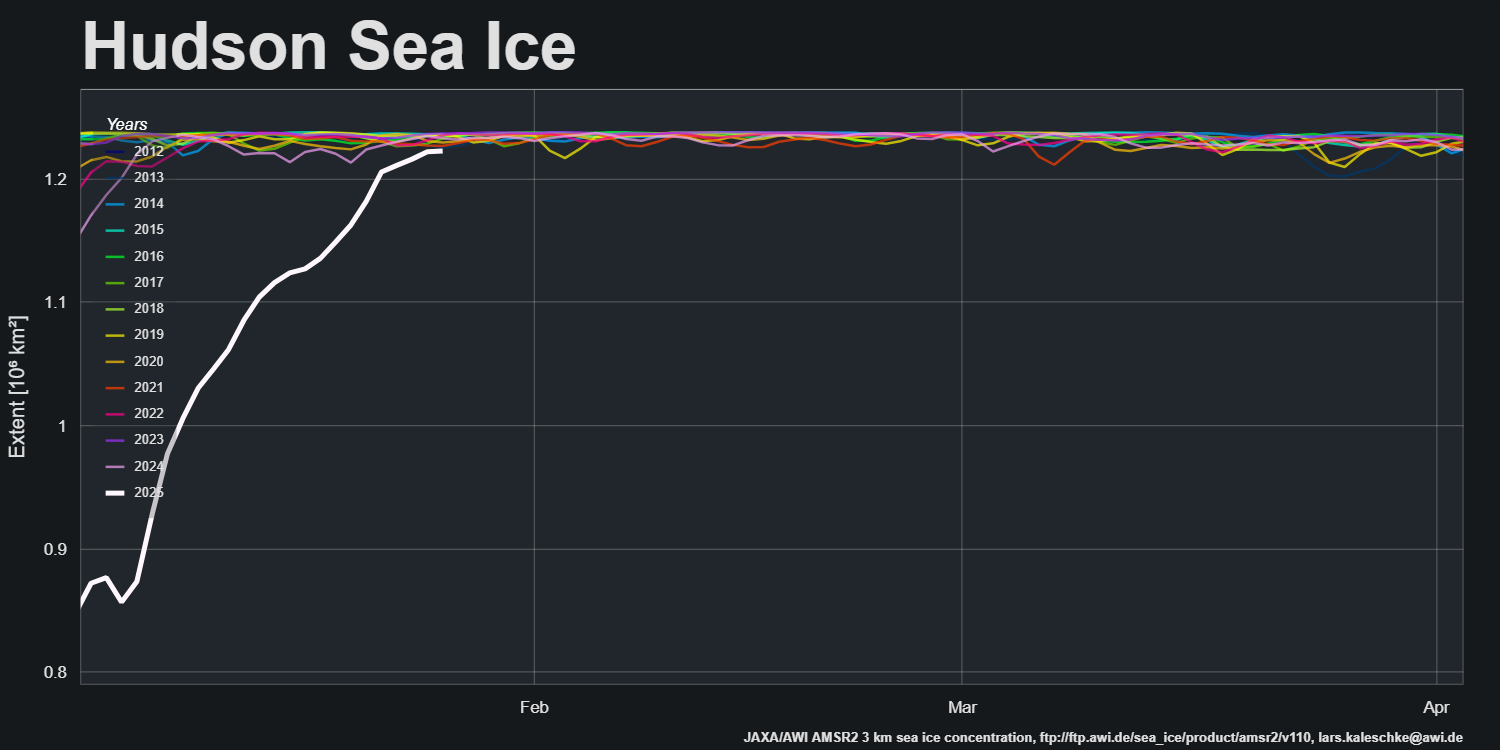
The primary reason for this is the remaining open water in Hudson Bay:
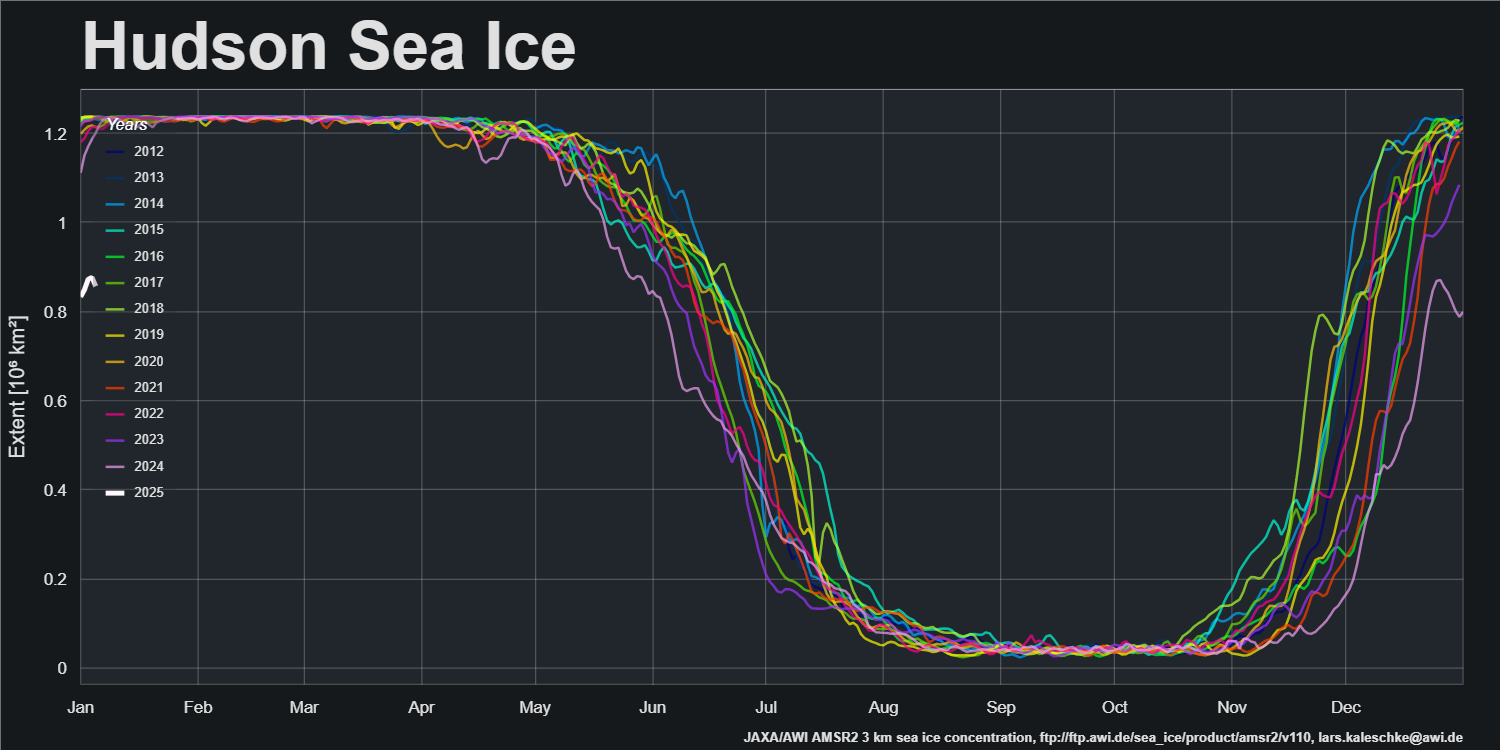
In previous years Hudson Bay has been covered by sea ice by this time of year, but in 2025 a large area remains unfrozen in early January!
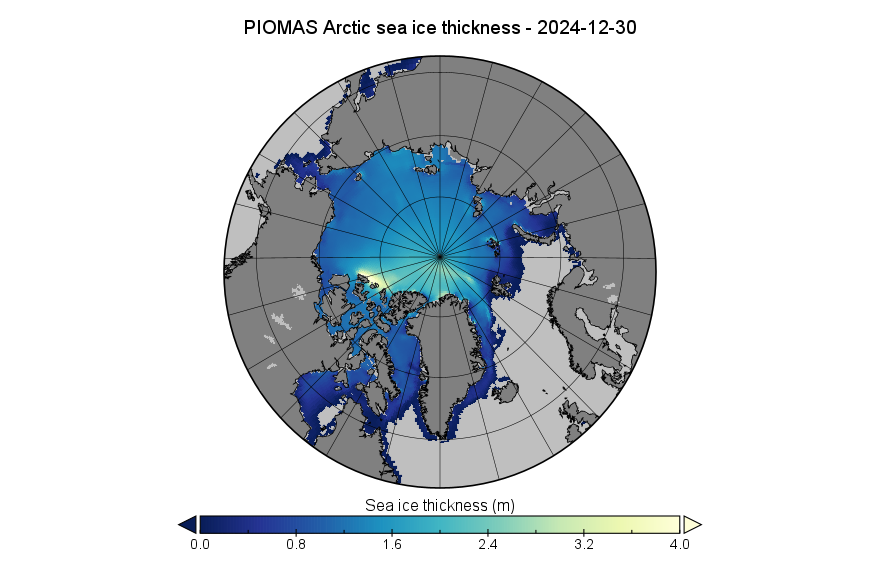
Due to the way PIOMAS handles the leap years the last gridded thickness data of 2024 is dated December 30th:
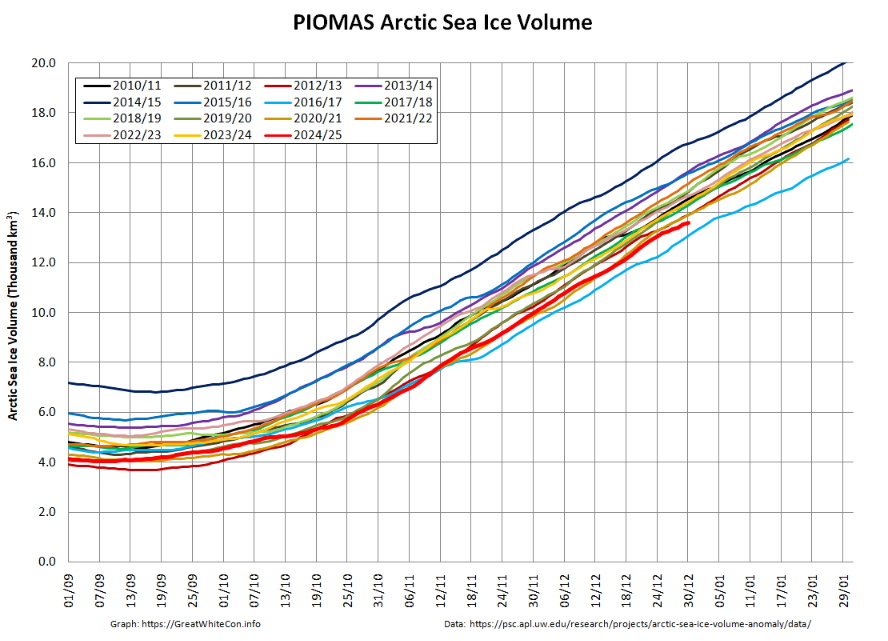
By December 30th Arctic sea ice volume had increased to 13.61 thousand km³, 2nd lowest for the date in the PIOMAS record:
The “near real time” CryoSat-2/SMOS merged thickness data from the Alfred Wegener Institute reveals a larger area of thick ice north of the Canadian Arctic Archipelago, whilst PIOMAS shows thicker ice along the coasts of the islands:
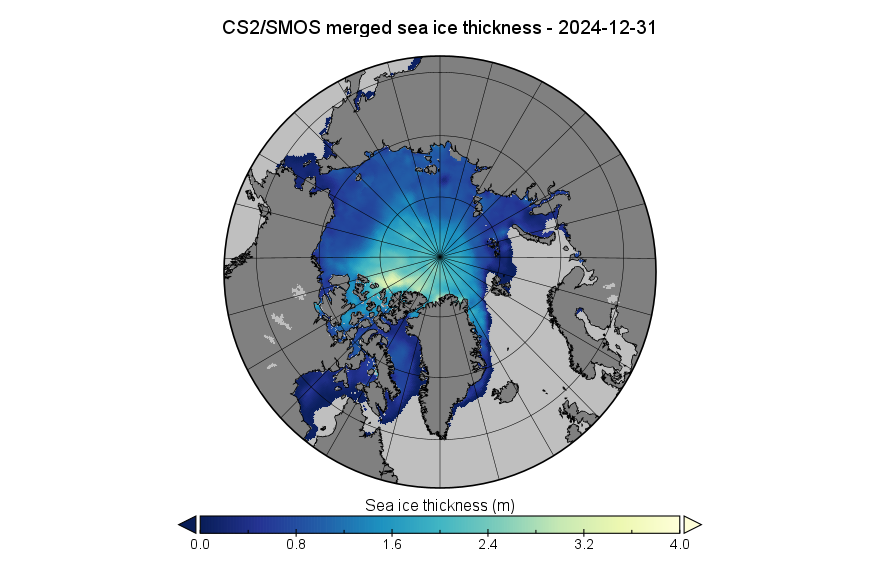
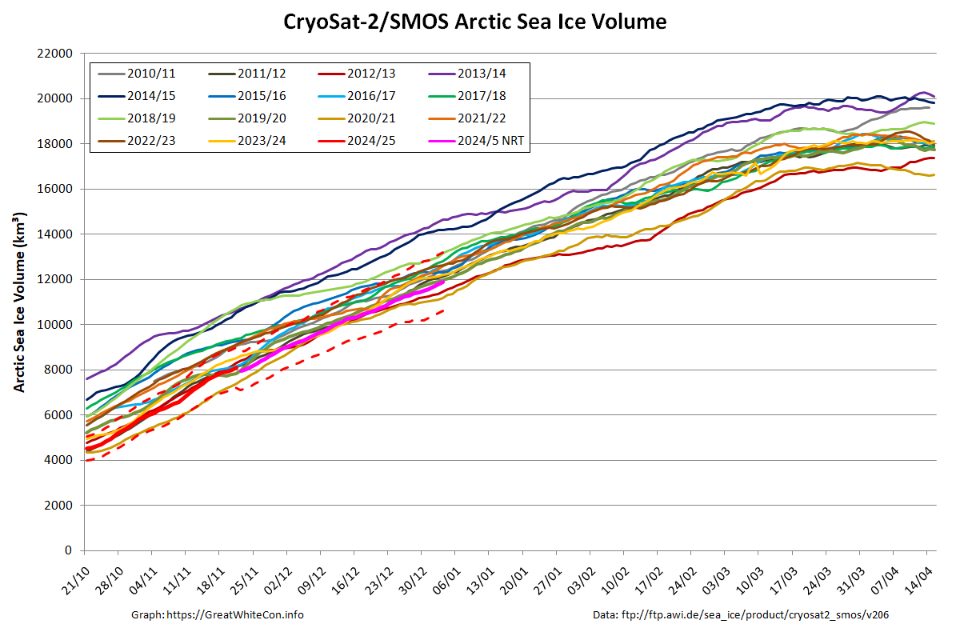
CryoSat-2/SMOS volume is currently 3rd lowest for the date, but likely to be revised upwards when the reanalysed data is released:
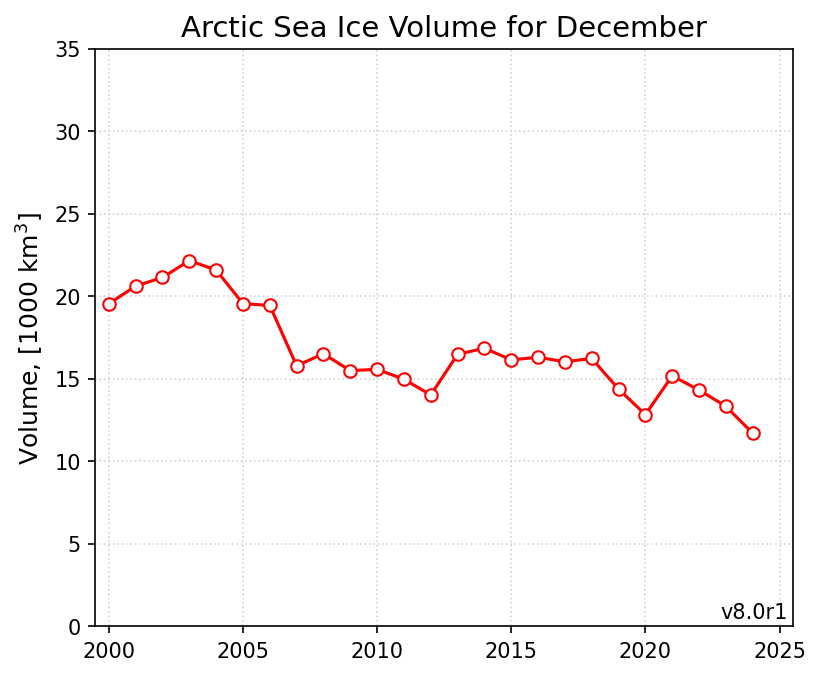
The DMI modelled Arctic sea ice volume December monthly graph continues to show Arctic sea ice volume lowest for the time of year:
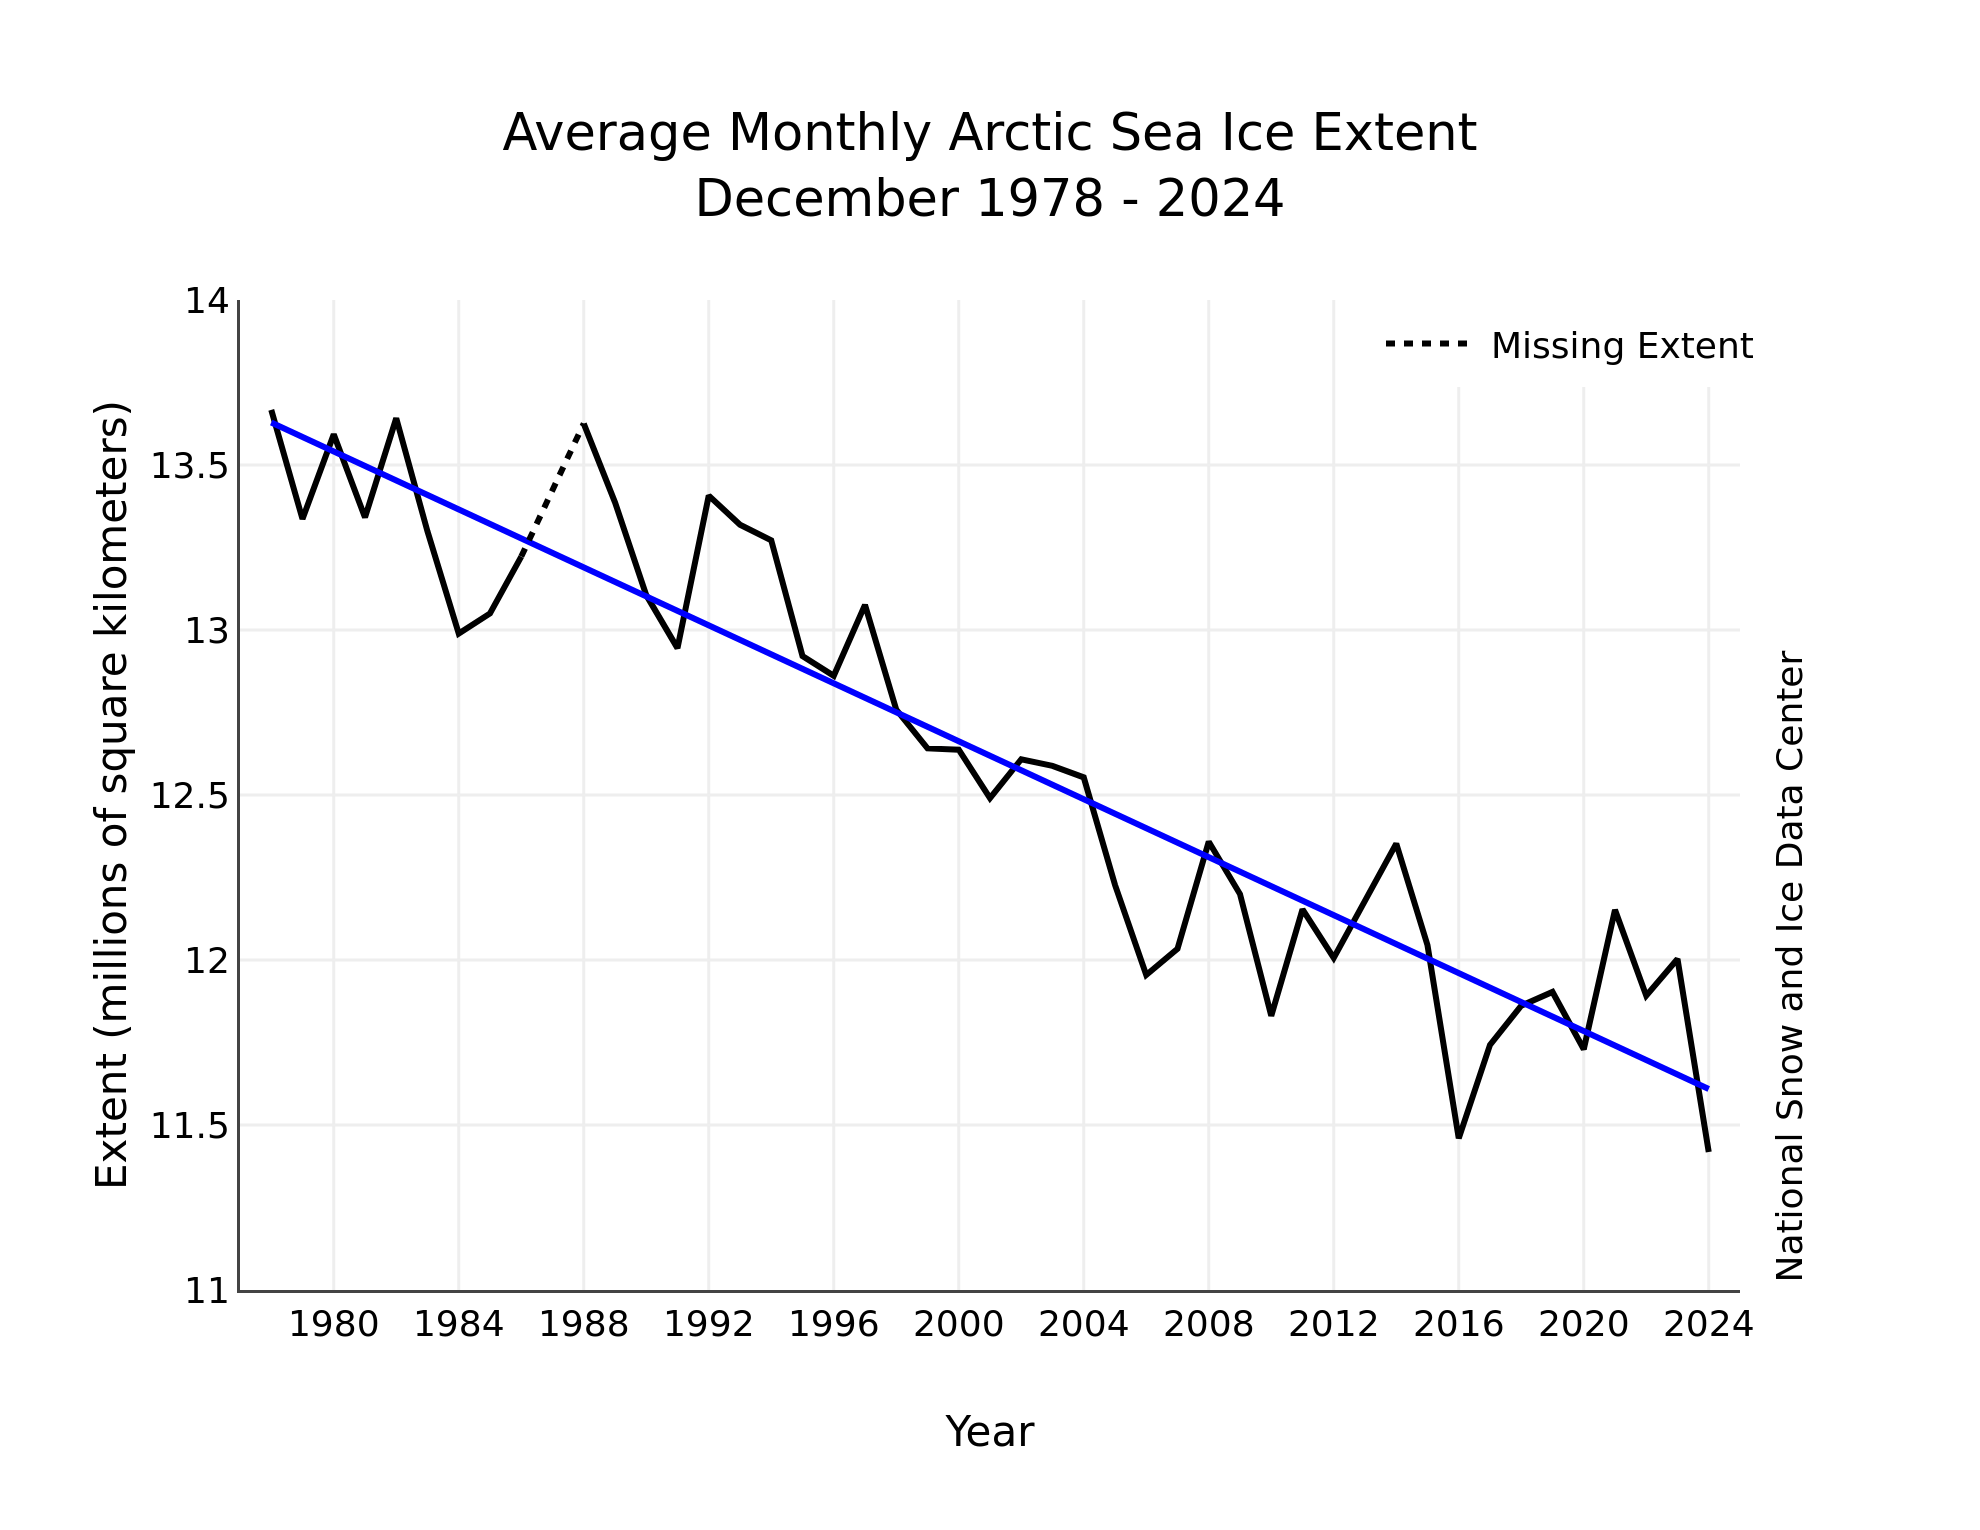
According to the December edition of the National Snow and Ice Data Center’s “Sea Ice Today” analysis:
Arctic sea ice extent for December averaged 11.42 million square kilometers, the lowest extent in the satellite record for the month. This comes on the heels of the third lowest extent for the month in November 2024. The December extent was 40,000 square kilometers below the previous record low for the month set in 2016, and 1.42 million square kilometers below the 1981 to 2010 average.
By the end of December, ice extent remains well below average in Hudson Bay, as well as off the Labrador coast, continuing the pattern seen in November. Extent also remains low in the northern Barents Sea, most likely caused by the import of warm Atlantic waters into the region and favorable atmospheric circulation patterns.
December air temperatures at the 925 millibar level (approximately 2,500 feet above the surface) were above average over essentially all of the Arctic Ocean, and with a spatial pattern very similar to that observed for November. Especially notable is a continuation of the prominent area of warmth north off the Canadian Arctic Archipelago and Greenland, where similar to November, temperatures were up to 8 degrees Celsius above average. Less prominent but also worth noting is the area of unusual warmth centered over eastern Hudson Bay, where sea ice has yet to form. This feature manifests large heat and moisture fluxes from the open water to the atmosphere.
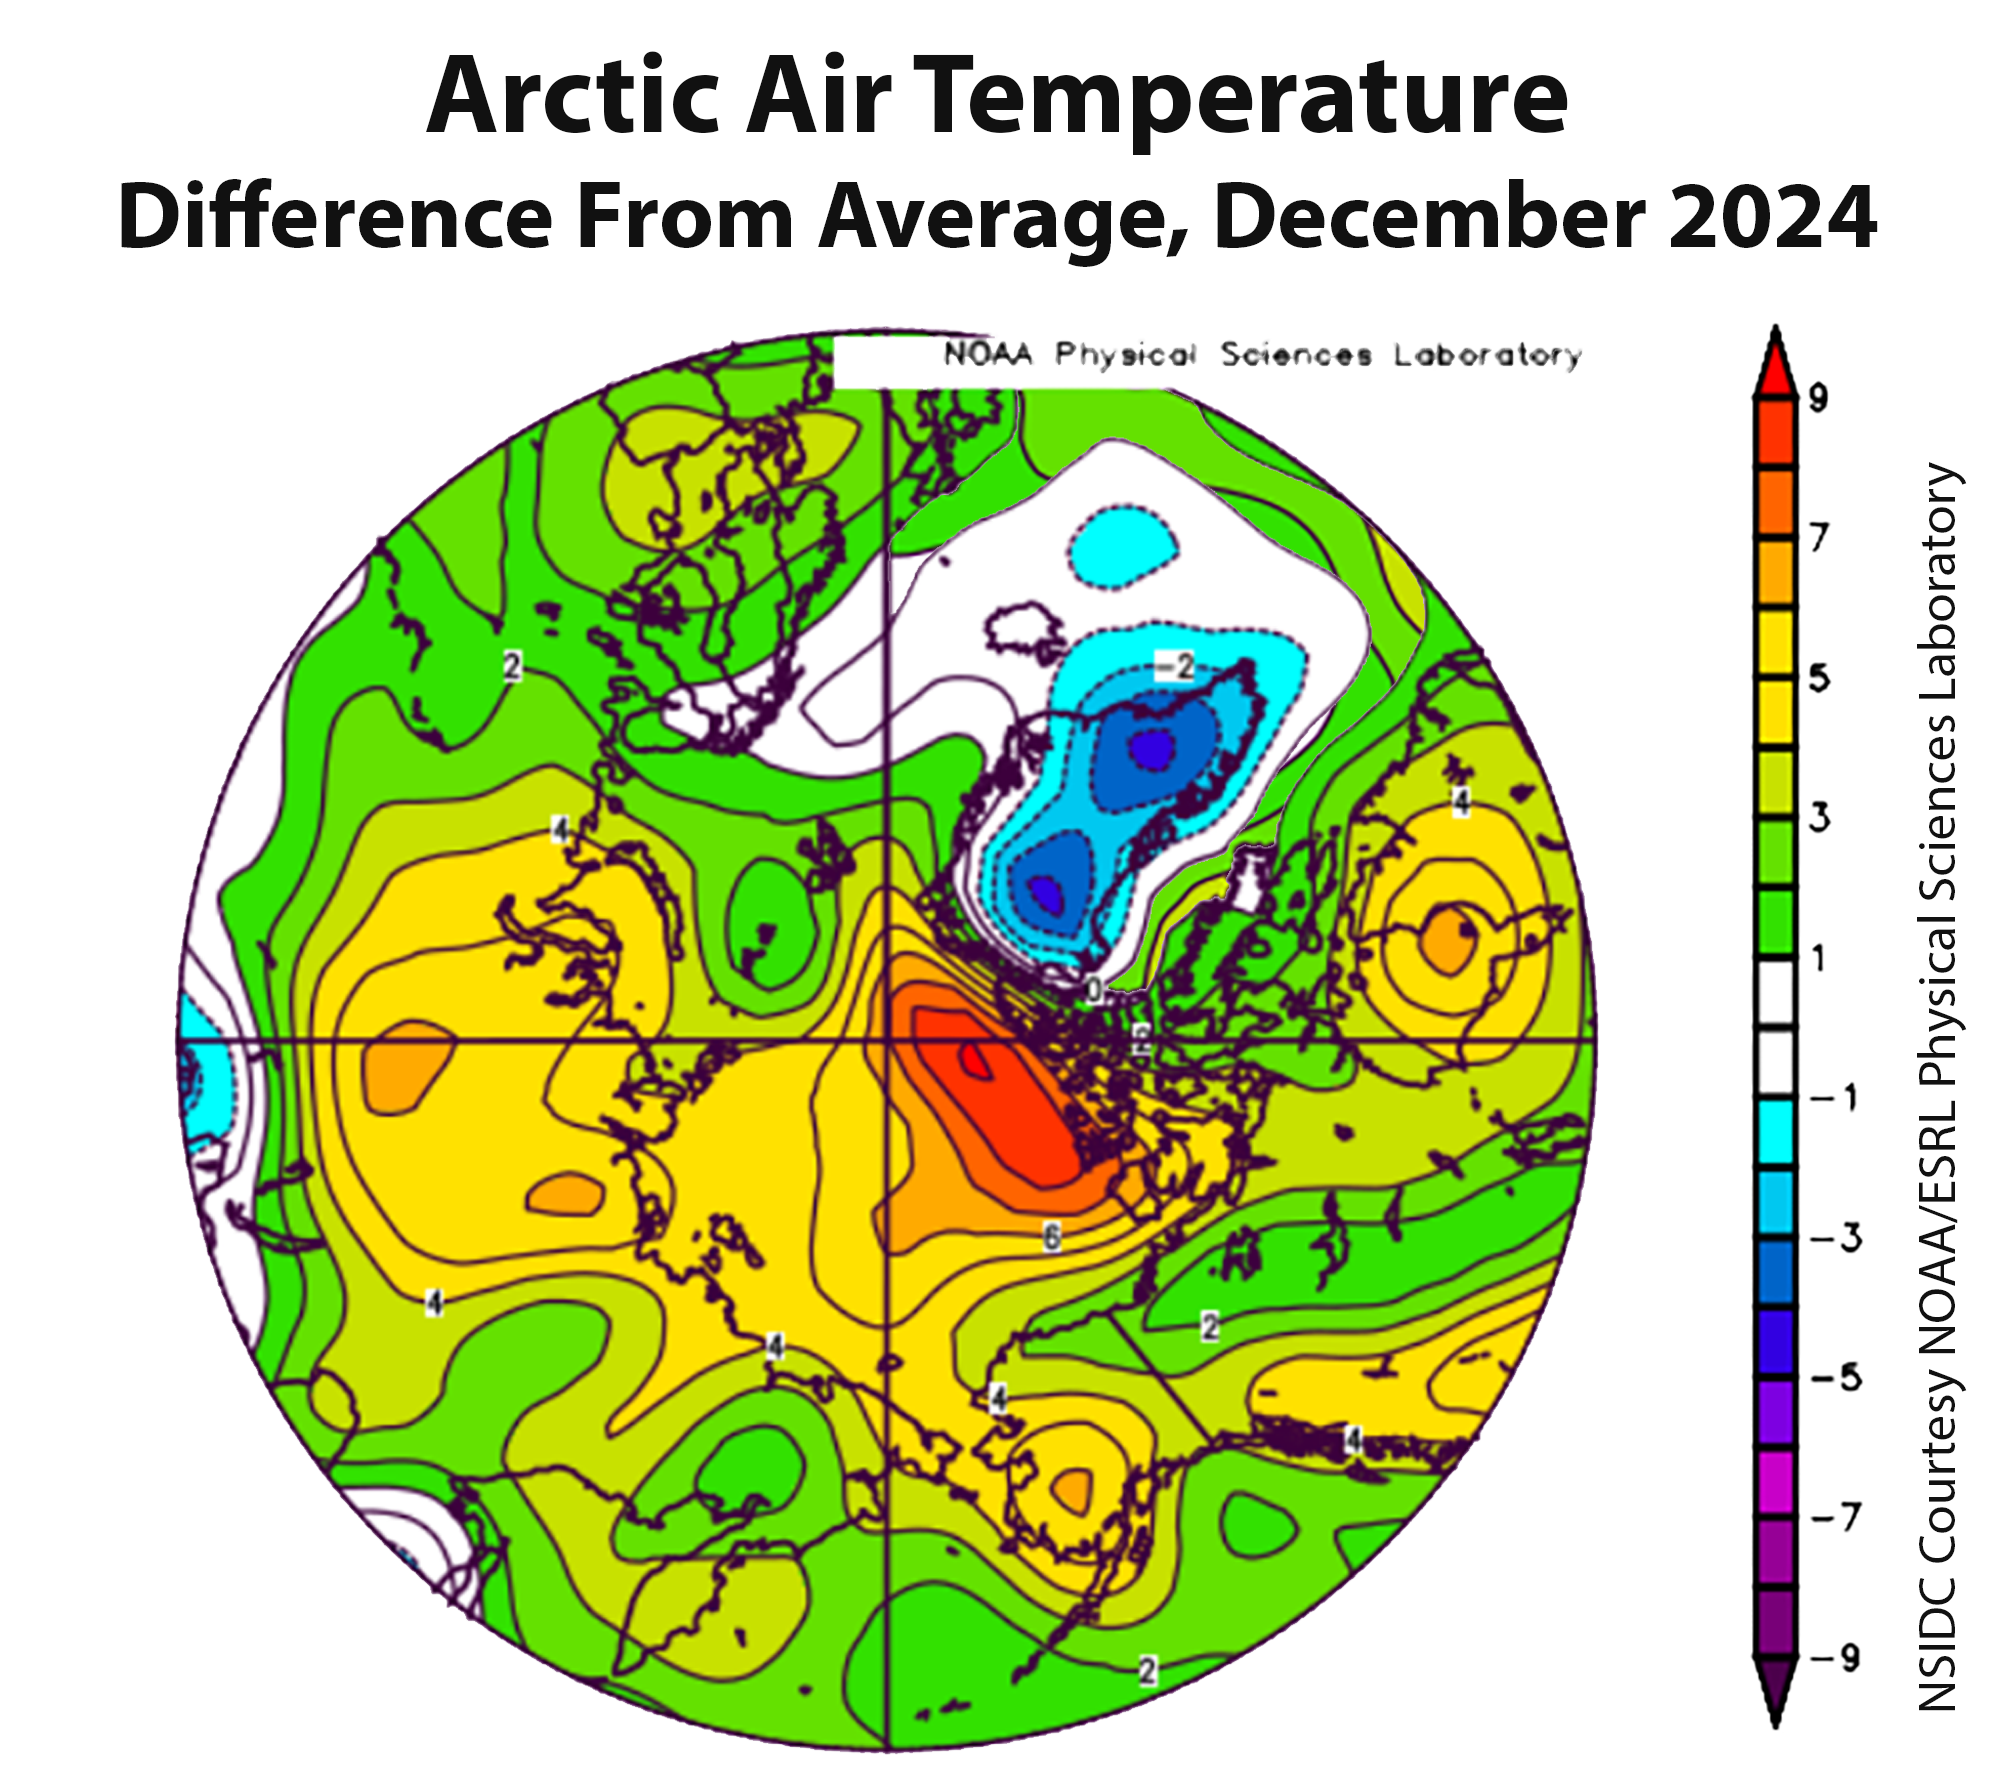
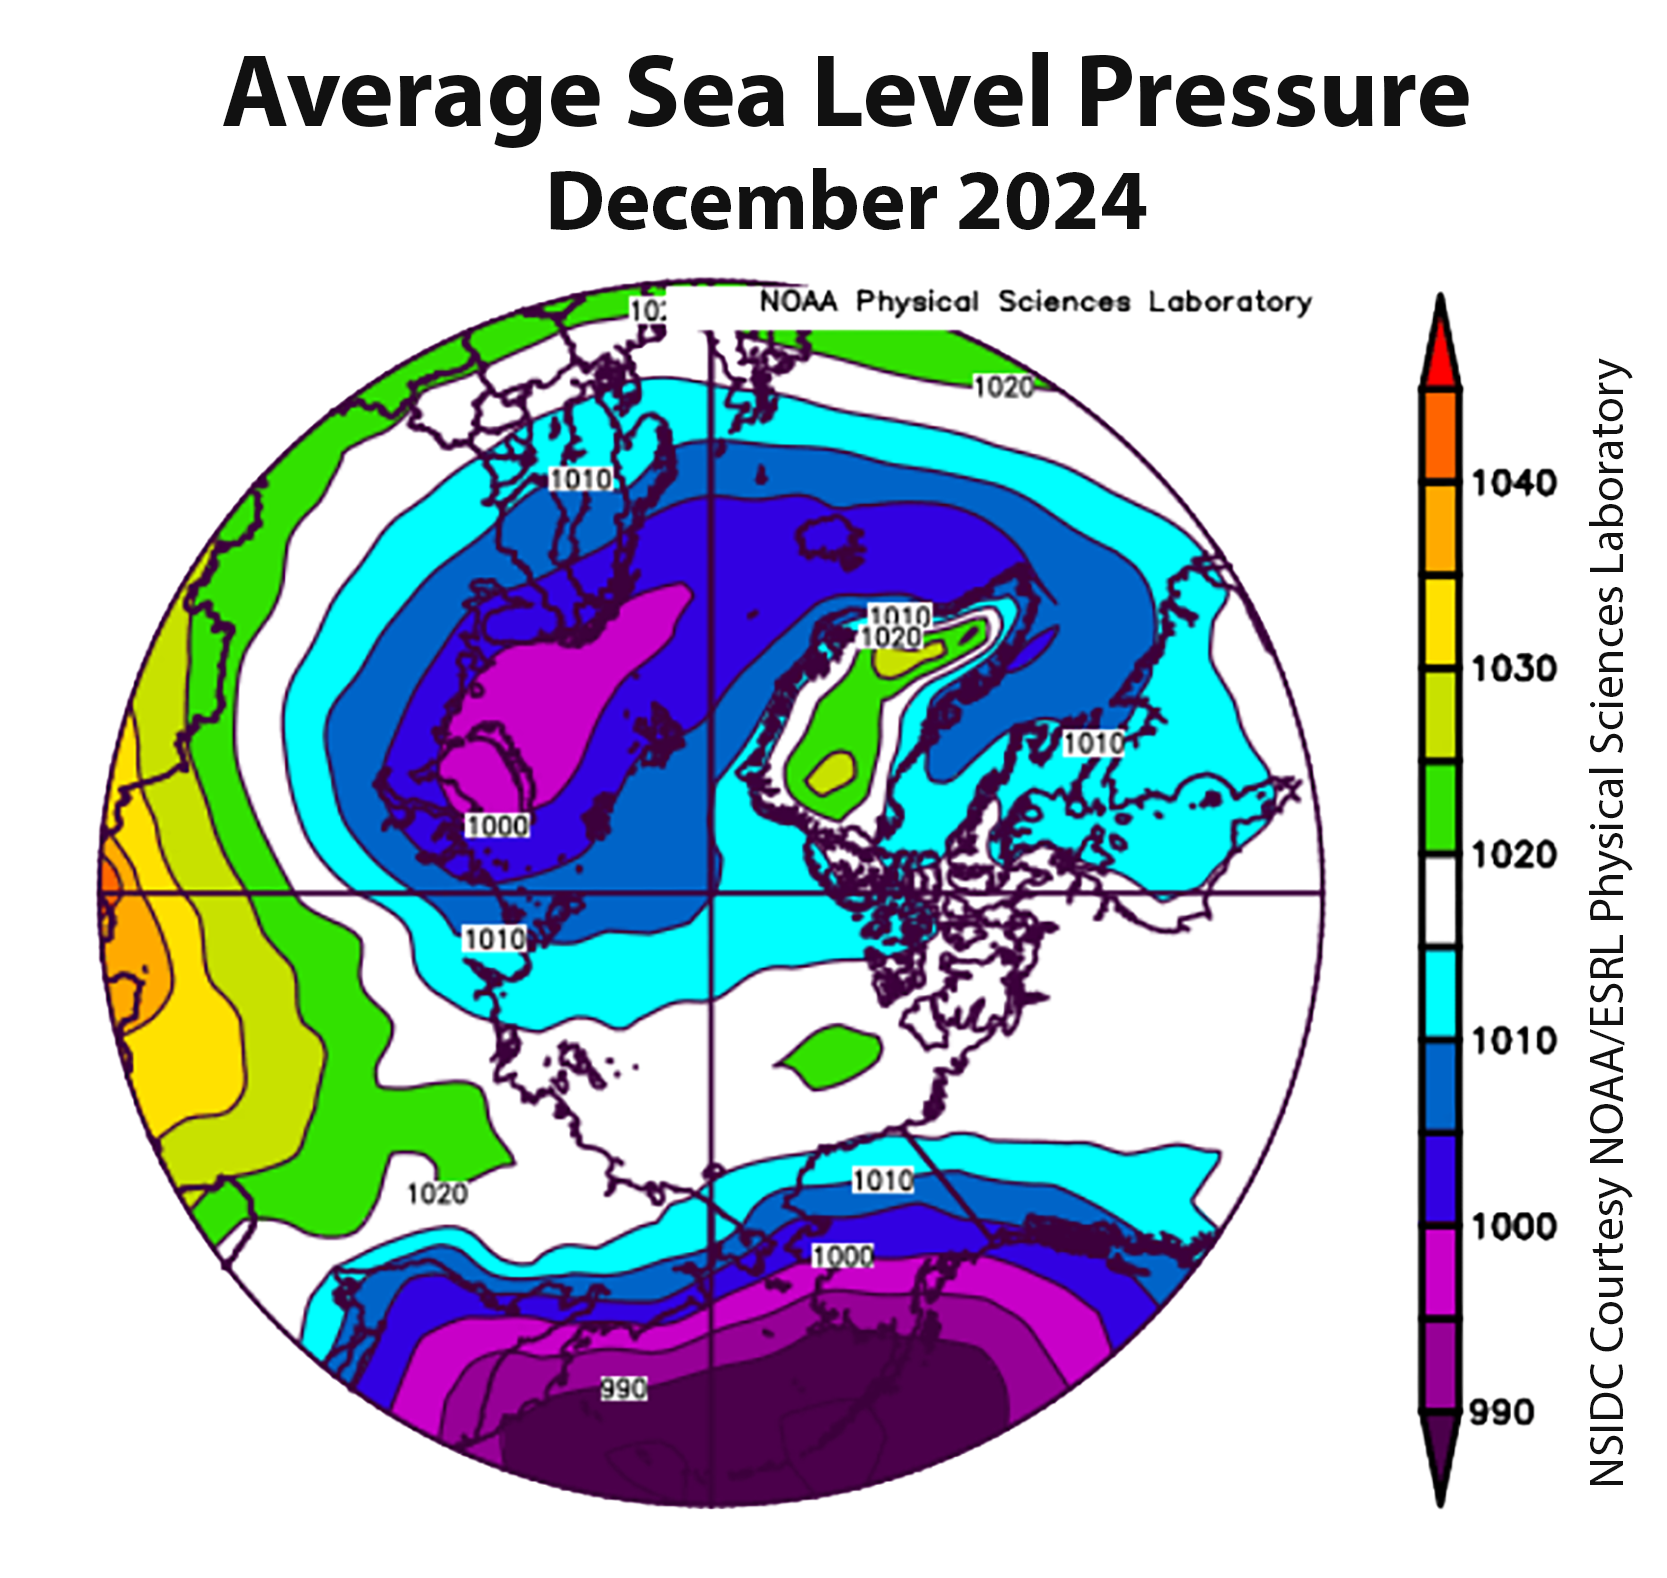
At least in a qualitative sense, such persistence seems unusual. Given that regional temperature patterns are strongly driven by regional patterns of atmospheric circulation, patterns of sea level pressure for the two months were also very similar. Both months were characterized by strong centers of low pressure over the Atlantic and Pacific sides of the Arctic, with a ridge of relatively high pressure extending across the Chukchi and Beaufort Seas. However, it is not clear how these patterns relate to the persistent band of unusual warmth north of the Canadian Arctic Archipelago and Greenland.
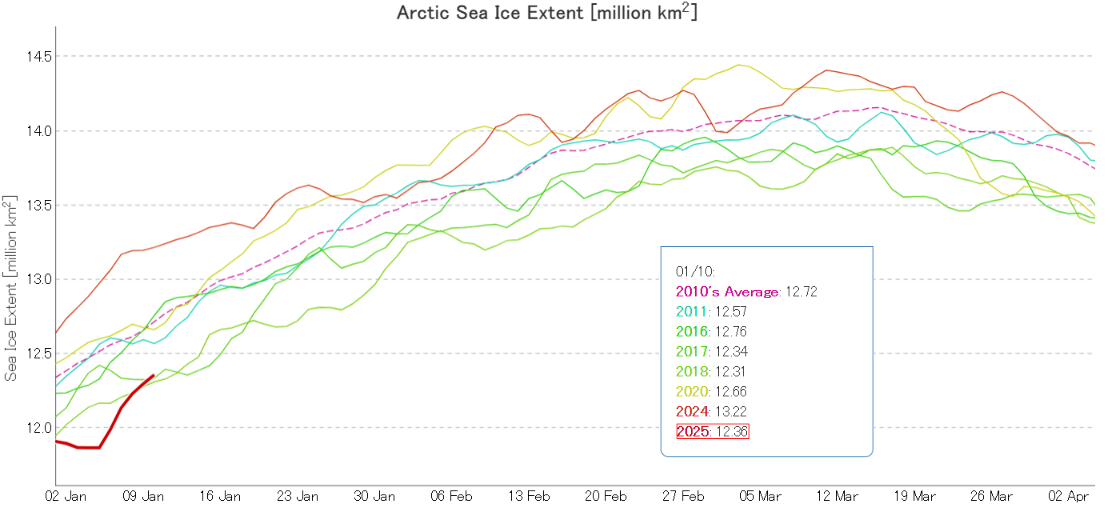
In other news JAXA extent is now 3rd lowest for the date, behind 2018 and 2017:
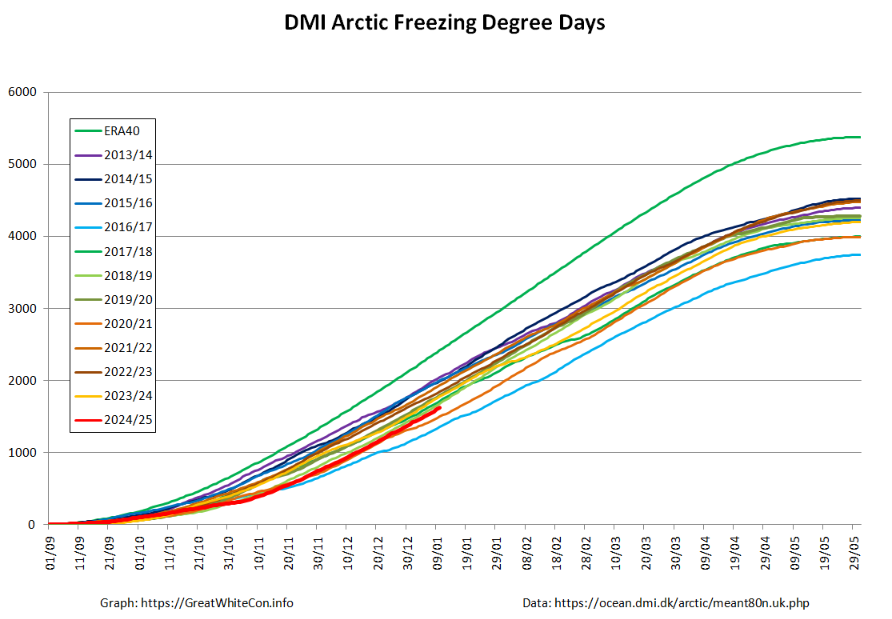
DMI’s high Arctic freezing degree days metric is also currently 3rd lowest for the date:
At long last Hudson Bay is (almost!) covered in sea ice:
Amongst the other peripheral seas, extent in the Sea of Okhotsk is also currently lowest for the date in the AMSR2 record:

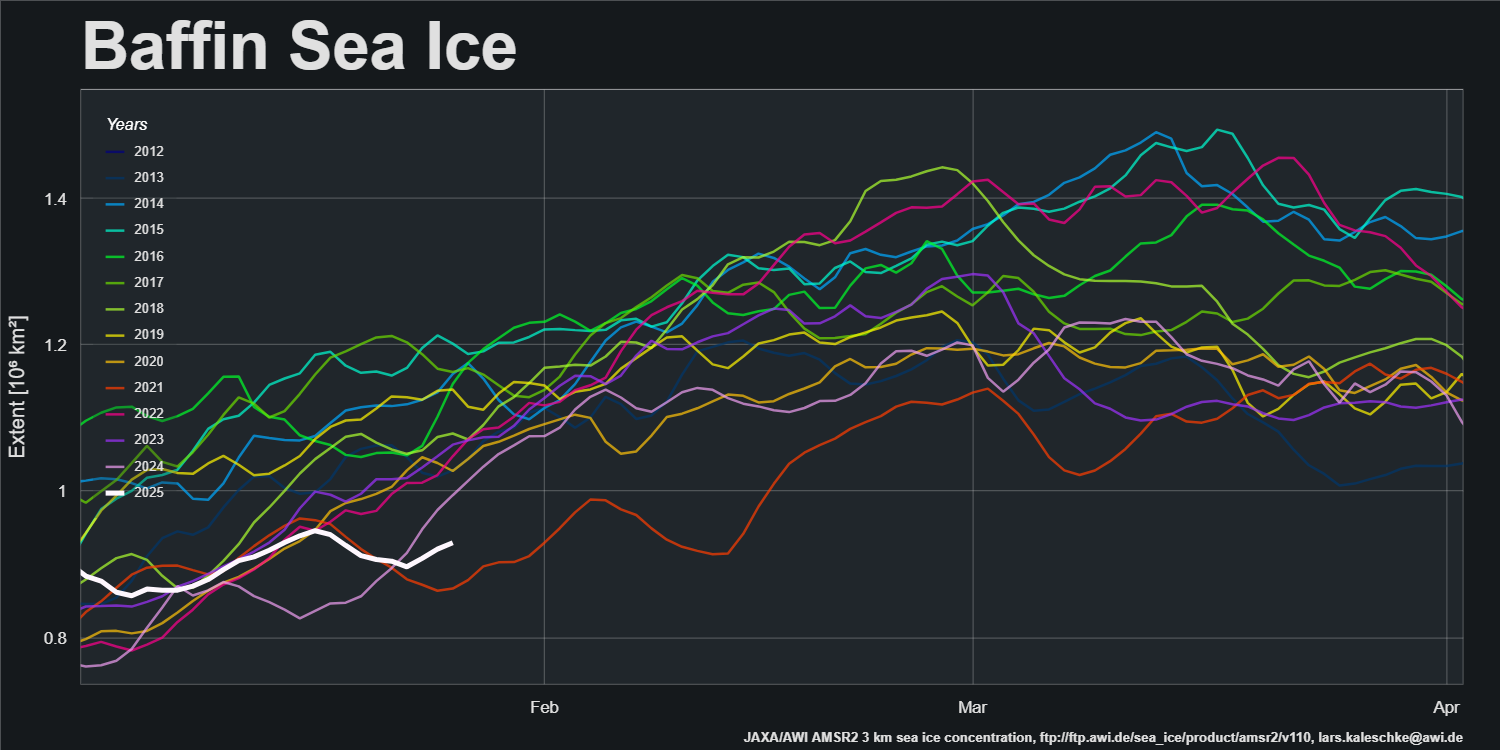
whilst Baffin Bay extent is second lowest for the date
JAXA/ViSHOP pan Arctic extent has (almost!) reached 13 million km², and is also currently second lowest for the date in the satellite era:
In other news the currently comparatively calm Central Arctic is forecast by GFS to get much windier and warmer by the end of the weekend:
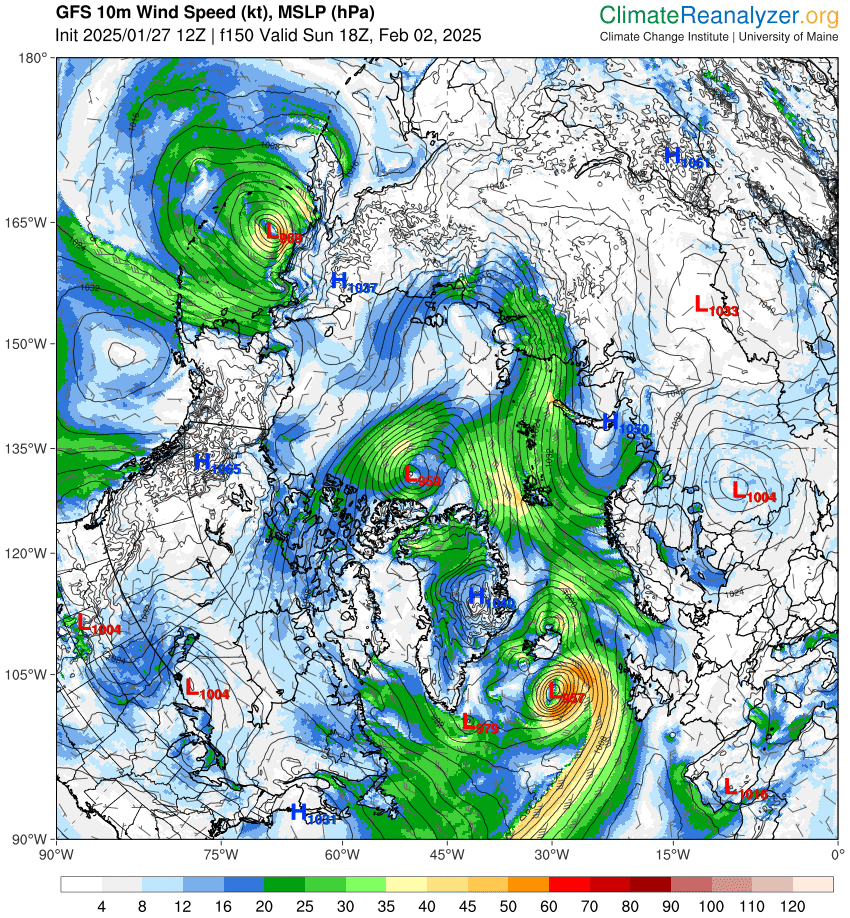
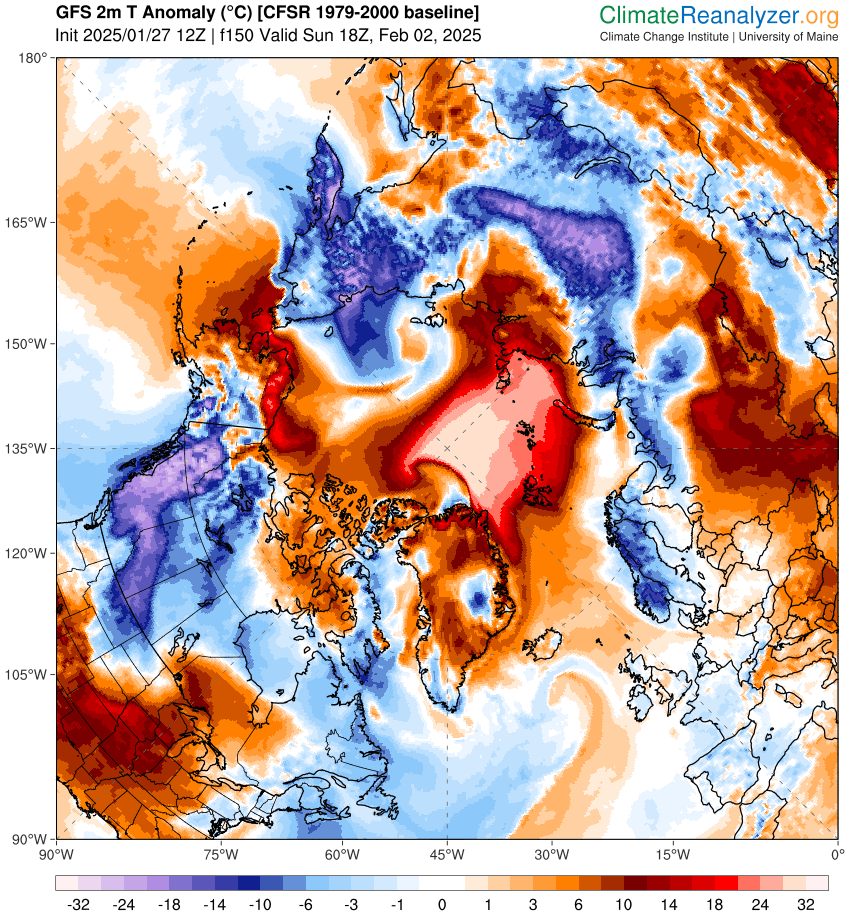
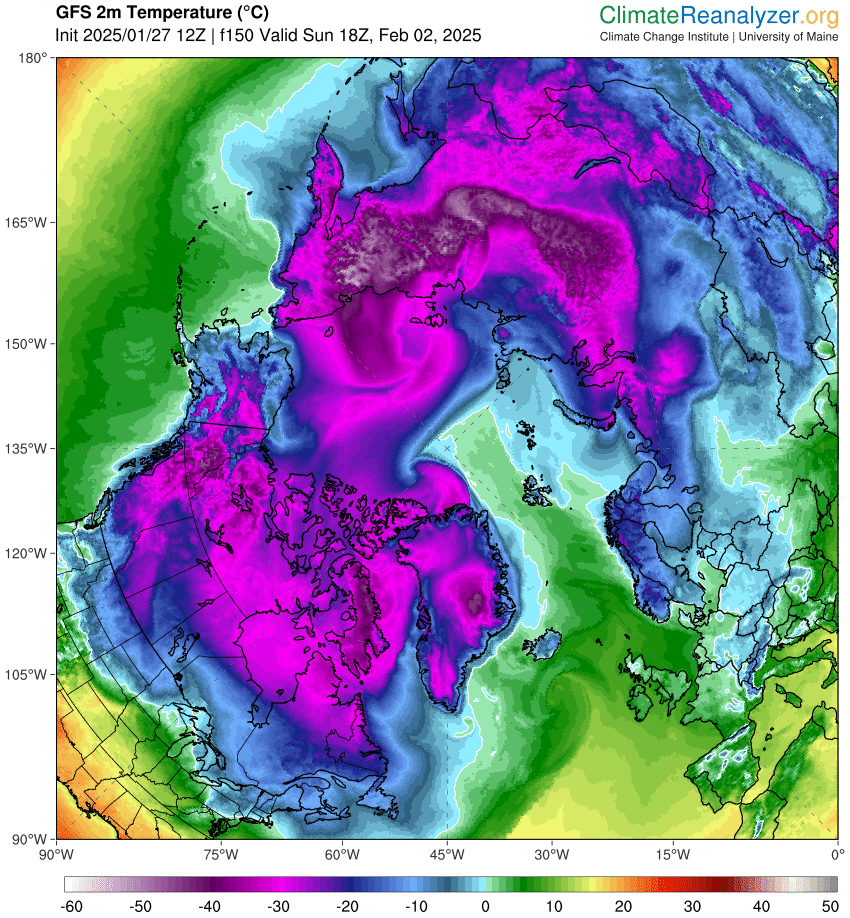
It remains to be seen whether this forecast verifies!
Watch this space!