Peter, a welcome new denizen here at the Great White Con Ivory Towers, appears to have parachuted into our far north summer hideaway on the shores of Santa’s Secret Summer Swimming Pool straight from Tony Heller‘s Unreal Climate Science blog.
Prompted by Peter I wandered over to Tony’s place where I found to my surprise that he has recently been busy warming up an old chestnut of his that has been debunked numerous times over the past decade. Allegedly:
Between 1990 and 2001, the IPCC rewrote the Arctic sea ice satellite record, and changed a trend of ice increasing to ice decreasing.
Here’s a previous chestnut rewarming event preserved for posterity:
Sadly Tony’s side of the “debate” has been deleted by the powers that be at Twitter, so here are the two graphs in question, combined by Mr. Heller into one illuminating animation:
I posted this comment on Tony’s blog last night (UTC), but he hasn’t got back to me yet:
Neither has anybody else. That’s probably because this morning my words of wisdom are still only visible to Tony and I?
[Edit – October 5th]Progress at long last! Vegieman directs the attention of Tony’s band of merry (mostly) men to:
However for some strange reason he neglects to mention that Tony’s link labelled “2001 IPCC Report” doesn’t lead to that graph!
[Edit – October 9th]Not a lot of people know that since things have gone quiet at Tony’s place I popped into Paul Homewood’s echo chamber, where rewriting the Arctic continues apace:
Needless to say my helpful comment is currently invisible.
Watch this space!
My initial comment now seems to be visible to all and sundry, so here’s a follow up:
My second comment has attracted a response, so…
Hi Jim, hope you haven’t forgotten me 🙂 So how would our bet have ended up if you had been happy to use DMI metrics instead of your preferred metric, heh i even gave you area instead of extent as i was so confident in winning.
Such a pity my charity won’t be seeing your money,even the moral victory isn’t enough to replace how happy that would have made me.
Kind regards Bit Chilly
How could I possibly forget you Chilly?
Sadly, beloved though they are by “skeptics” of all shades, DMI’s metrics leave a lot to be desired.
In the continuing absence of Cryosphere Today data I’ll go and have a look at NSIDC area. Once I have a spare 5 minutes in amongst working for a living and educating Steve/Tony and his faithful flock of followers!
If the truth doesn’t serve your purposes then resort to the good ol’ ad hom’ attack?
If precedent is any guide that is where matters will rest.
1) Sign off with an ad hominem attack
2) Refuse to answer the question, whether implied or direct
3) Move on to the next denialist trope.
Let’s see if this has any effect?
My latest comment is visible to all and sundry this morning (UTC).
However as previously surmised, no response has yet been forthcoming.
Jim: Thanks for your expose on the lies. I remember my dad giving me Dixie Lee Ray’s book about how environmental science was really just socialism, etc. And so I went through the book detailing all the environmental errors ( I mean I did get an undergraduate degree in the new “environmental option” of International Relations)…. And my point is here you are literally 30 years later having to do the same work of exposing the same stupid lies to brainwash the masses.
I just found out that James Lovelock’s GAIA model science was actually funded by Dutch Royal Shell – with an agenda to it of course. It’s a fascinating expose as well.
Thanks for your kind words Drew.
Paraphrasing a more famous bon mot somewhat:
It takes but a moment to retweet sea ice decline denialist BS. It takes a lot of hard work to debunk that BS!
Gotta link to the Lovelock exposé by any chance?
It will come as no surprise to our regular readers that I have no further progress to report this morning at either UnReal Climate Science or NALOPKT.
Hi Jim,
I thought you would have deleted my comments and I am quite impressed that you haven’t.
I dont agree with some of what Tony Heller writes because he does have a habit of exaggerating or leaving out some reinvent information so I always check his statements.
You redacted the link I provided where Heller has merely assembled some newspaper articles which show Arctic alarmism was rampant in the early 2000s with climate scientists from all the major institutions saying summer Arctic ice would be gone or nearly gone by 2012 or so.
I asked you to comment on these, not Tony Heller but you responded by attacking Heller which is just ducking and weaving.
I ask you again to comment on the Arctic alarmism expressed in these newspaper clippings which are real and please don’t redact the link this time.
[Link redacted – Mod]
Cheers,
Peter
Thank you for your kind words Peter.
Discussions here focus on Arctic science and data. However I do occasionally indulge in a bit of pre-bunking and/or debunking.
What relevance do you suppose “newspaper clippings”, ancient or modern, have on Arctic science and/or data?
Would it surprise you to learn that my helpful comment at NALOPKT remains invisible to all and sundry, and that no answer has been forthcoming to the most recent question I posed at unReal Climate Science?
Peter, these alarmists are growing madder and more irrational.
Maybe it is time for us to give it up, nature has its own watch and time.
Par for the course Mountaineer. Ad hom instead of answering questions! At the risk of repeating myself:
What does the text in the IPCC report associated with the graph Mr. Heller labels “Arctic Sea Ice – IPCC 1990” say?
Jim,
My point is that all the top Arctic climate scientists in the early 2000’s were gleefully announcing that the Arctic was in a death spiral, there were no exceptions that I know of.
Then there was David Viner from UEA predicting that kids wouldn’t know what snow was.
Here in Australia we had scientists from our major scientific organisations saying the drought was “the new normal” and that the dams would never fill again. They also declared that our snow cover would be reduced by 45% by 2020.
But the dams are now overflowing and we’ve had record snow for the past few years. None of them has ever apologised for their failed predictions.
Its the same with the Arctic, with the major metrics showing that it stopped shrinking in area and volume 10 years ago but alarmists keep saying that it is still reducing which is a porkie.
I am persuaded by data, not opinions, models or “consensus” so can you tell believe to be the most compelling data that shows the Arctic is still shrinking.
Don’t be ridiculous Peter. You appear to be persuaded by “newspaper clippings”!
Cecilia Bitz is a “top Arctic climate scientist”. Here yet again is her CV:
https://GreatWhiteCon.info/2022/09/facts-about-the-arctic-in-september-2022/#comment-643286
See also her assorted papers op cit.
This site is full of the Arctic data you allegedly seek. Why don’t you take a good hard look at it? What do you make of this information for example?
Australias weather conditions have shown long term trends in Western Australia. This year is sure to be a corker: a few years ago it was 38C at 9am…
Thats because the currents, in the ocean and the atmosphere, have been tightening around Antarctica.
The poles are changing and so are the tropics.
I was in Melbourne three years ago and it blows a gail for two weeks and then you cook for a week.
Everything is dry already so id be careful of bushfires this year..
Hey, Jim!
What exactly do you need from Mr Heller graph attached text?
That Figura is 7.20 from ipcc_far_wg_I_chapter_07-1-1.pdf
Observed Climate Variations and Change
C.K. FOLLAND, T.R. KARL, K.YA. VINNIKOV
—
Sea-ice conditions are now reported regularly in marine
synoptic observations, as well as by special reconnaissance
flights, and coastal radar. Especially importantly, satellite
observations have been used to map sea-ice extent
routinely since the early 1970s. The American Navy Joint
Ice Center has produced weekly charts which have been
digitised by NOAA. These data are summarized in Figure
7.20 which is based on analyses carried out on a 1° latitude
x 2.5° longitude grid. Sea-ice is defined to be present when
its concentration exceeds 10% (Ropelewski, 1983). Since
about 1976 the areal extent of sea-ice in the Northern
Hemisphere has varied about a constant climatological
level but in 1972-1975 sea-ice extent was significantly less.
In the Southern Hemisphere since about 1981, sea-ice
extent has also varied about a constant level. Between 1973
and 1980 there were periods of several years when
Southern Hemisphere sea-ice extent was either appreciably
[…] In the Southern Hemisphere since about 1981, sea-ice
extent has also varied about a constant level. Between 1973
and 1980 there were periods of several years when
Southern Hemisphere sea-ice extent was either appreciably
more than that typical in the 1980s.
That means cyclical variations occur but ice was much lower at the start of records.
You’ve saved Peter the effort Mountaineer!
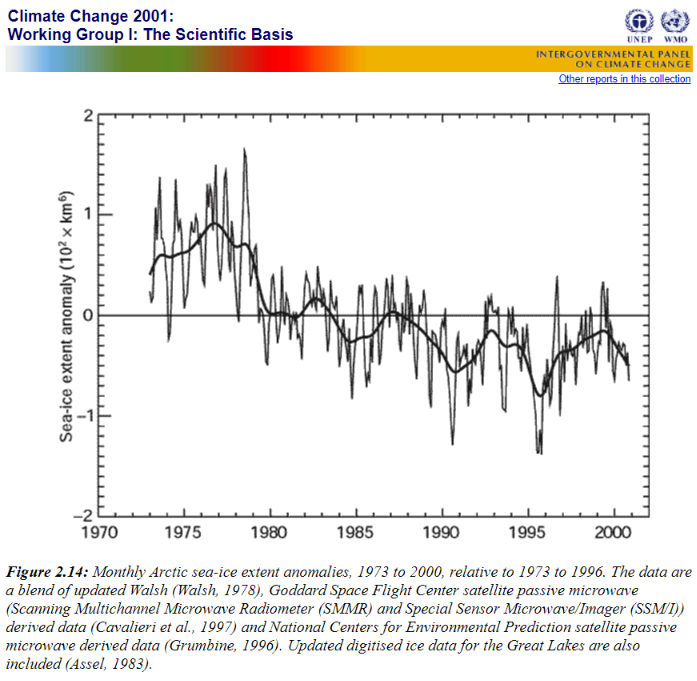
To briefly summarise, manually produced “weekly charts have been digitised by NOAA” and are “based on analyses carried out on a 1° latitude x 2.5° longitude grid.” over an undefined area of “the Arctic”. The data is presented in the form of anomalies from an undefined “constant climatological level”.
How does that compare with Mr. Heller’s “IPCC 2001” data?
Jim, OK, I now understand your eye for detail, and I admire that, however,
{{How does that compare with Mr. Heller’s “IPCC 2001” data?}}
Does it really matter? Should not we focus on this IPPC 1990 dataset for a moment? What does it tell us all? First, that IPCC has been changing its record data (adjustments, or torturing the data).
Second, if we can admire the authors of that time for a moment and trust their results, the oscillations we see since the start of that data mean simply that nothing is so much unprecedented as the media and biased researchers are saying NOW!
Really, we should not need go into too much detail that cannot enlighten the path of our quest better. We only run the risk of losing what we pursuit. Aristotle said that himself, I read in hiss Ethics. I reckon we should put the record straight again, first
Thanks for your kind words Mountaineer. However do we have to go over this yet again?
Yes, it matters. Although apparently not to Mr. Heller.
No, it doesn’t tell us that the IPCC has been “adjusting” or “torturing” the data. That’s a product of Mr. Heller’s evidently extremely fertile imagination.
The fact that the Arctic sea ice extent metric undergoes considerable “internal variability” from year to year is apparently not in dispute. Nevertheless, here’s another graph that Peter evidently hasn’t seen before:
Not to go into too much detail, because we should not need, but you sound biased..
Jim,
1. The “newspaper clippings” show that all the Arctic “experts” were predicting the demise of summer Arctic ice by 2012 or thereabouts.
It’s nothing about being “persuaded”, it’s merely acknowledging how wrong these alarmists got it and they are still doing the same to this day.
2. I plainly said I am not persuaded by opinions, only by data, but you keep referring me to opinions.
3. I asked you to provide me with what you consider to be the most compelling
Data that shows the Arctic is still shrinking, not a link to a person with an opinion.
If you think she has data showing the Arctic is shrinking, please articulate it to me so I can assess it.
I have shown you data showing that Arctic ice extent has been about the sane since 2007 (masie) but you refuse to acknowledge that.
I have shown you that Arctic ice volume has remained about the same since 2012 (PIOMAS) but you refuse to acknowledge that.
Again, I repeat, I am not influenced by “experts”, models, predictions or “consensus”, I am only influenced by the data. If you believe that Arctic ice is currently shrinking, PLEASE tell me what data leads you to this conclusion.
But I suspect you do not know of any data showing the Arctic is shrinking (I don’t)
Cheers,
Peter
Peter,
1) No they don’t
2) I keep referring you to science and data.
3) I (belatedly!) showed you some fresh data. What do you make of it?
4) Here is what an NSIDC scientist has to say about MASIE data:
https://GreatWhiteCon.info/2016/02/dmi-masie-and-the-sea-ice-index-an-interview-with-walt-meier/
I suggest that you read it.
Jim,
Just did a bit of research on Celia Bitz and here is a quote from her…. “Talking to people, it’s pretty inescapable that we’ve never seen sea ice loss like this in human history,”
Lol!
Scientists have established that Vikings cultivated barley in Greenland 1000 years ago in land that is now permafrost which meant that Greenland would have been far hotter than it is today and by implication Arctic ice would have been far smaller than today.
But Celia who was “talking to people” doesn’t seem to know about this era, it was called the medieval warm period. She obviously didn’t talk to the scientists excavated Old Greenland Viking settlements.
“LOL!” constitutes the whole of your scientific argument?
FYI here’s another quotation from the article I presume you’re referring to:
Where’s your link to research suggesting that “Arctic ice would have been far smaller than today”?
Here’s my link, which comes to a different conclusion:
https://www.researchgate.net/publication/51825483_Reconstructed_changes_in_Arctic_sea_ice_over_the_past_1450_years
“Bitz said it’s startling how much the amount of multiyear ice has shrunk, over 50 percent since 1999”
Here is the data trend from NSIDC for multiyear ice (black line) which did reduce by over 50% “since 1999”.
However, Cecelia just forgot to mention one teensy weensy crucial detail and that was that the multiyear ice has remained about since 2008! In fact it appears to be increasing slightly since then.
This correlates closely with ice extent and area.
I have search the NSIDC and NASA Arctic websites and there is no mention of the FACT that Arctic ice extent, area, volume, multiyear ice has now plateaud for over 10 years.
Jim, don’t you think this is just a little bit deceitful?
You’re the one being deceitful Peter.
At the risk of repeating myself, your due diligence leaves a lot to be desired:
What both NASA and NSIDC do is to only use September minimum extents to base all their alarmism on and that is deceitful.
Jim, you have also used minimum extents above and conveniently left out 2021 and 2022 which both show Arctic ice extent significantly greater than 2020. Naughty.
But why is using ONLY minimum extents deceitful?
Let’s do a hypothetical and say the March maximum extent increased exactly the same as the September minimum extent decreased
This would mean that the average extent would have stayed the same and clearly demonstrates that only using minimums is deceitful.
If you use extent averages instead of minimums there has only been about 15% drop from 1979 to about 2008 and has remained about the same since then.
There is abundant evidence that Arctic ice extent was low from about 1930 until about 1947 and my guess is that current extent is about the same as it was then.
Cheers
The graph you refer to is not mine. It was published by the NSIDC in 2020. Evidently Walt Meier isn’t precognitive. Here’s a link to the relevant article:
https://nsidc.org/arcticseaicenews/2020/09/arctic-sea-ice-decline-stalls-out-at-second-lowest-minimum/
Your “due diligence” has let you down once again Peter. For more on “average extent” please see:
https://GreatWhiteCon.info/2021/10/facts-about-the-arctic-in-october-2021/
Here’s an NSIDC graph of Arctic sea ice extent in March:
They do of course helpfully provide such graphs for every month of the year.
Can you by any chance provide a link or three to all the “abundant evidence” of which you speak?
Your researchgate link shows no significant change from 800- 1200 and is a reconstruction using proxy data of some sort and presumably correlating Arctic ice with temperature.
If we use Greenland ice core temperature (attached) there is a dramatic difference around 1000AD would have meant Arctic ice had shrunk considerably but the Researchlink reconstruction has erased the MWP which is absurd.
Vikings grew barley in Greenland around 1000AD and that land is permafrost today. So common sense should tell you that Arctic ice was far smaller than today for much of the MWP.
Cheers,
Peter
Good morning Peter,
Did you read the article I linked to?
Your alleged “common sense” does not constitute science. Where is your evidence for the correlation between GISP2 data and Arctic sea ice extent/volume/age?
From speakmylanguage
“Everything is dry already so id be careful of bushfires this year”
Lol!
We are in our third year of laNina and it’s been raining heavily down the east coast. The dams are full, the ground is sodden and….horror of horrors, my golf course has been closed for the past week because it is covered in lakes of water.
I’m from Western Australia. The weather is so different here they had to stock the rivers with fish because they apparently always dried out leaving much less diversity. Thats why most aboriginal trade routes are on the east.
Something to do with ocean gyres.
Jim,
NSIDC has two Arctic datasets, SII (Started in 1979) and MASIE(Started in 2006). SII extent is determined by examining grids of 25km x 25km which is 625 km2.
MASIE grids are 4km x 4km (16km2) and have a much precision than SII but MASIE is a bit of an embarrassment to NSIDC because it shows no increasing extent trend since 2006.
Nowhere on the NSIDC website will you see am image of MASIE data and you can only download a file into Excel as I have done.
SII is pretty much the same as MASIE and the trend from 2008 shows no decrease. The NSIDC website also seems a bit embarrassed of SII and nowhere on the site will you find an image of all SII data, there is only an image of SII September minimum extent which is quite deceitful because minimum extent is not representative of ice extent but it paints a much more alarmist picture.
The following is an image showing all data and you will see that average ice extent has decreased from 12.5 million km2 in 1979 to 10.3 million km2 now and its been pretty much the same since 2007.
Cheers,
Peter
Good morning Peter,
Did you read the article I linked to?
Apples and oranges… 8^\/-<
The second paragraph seemingly makes little sense…
“The 42-minimum-extent values in the satellite record can be broken down into three 14-year periods. Most notably, minimum extents in the last 14 years of the time series are the lowest 14 in the 42-year record (Figure 2b). All three periods show a downward trend. The middle period, 1993 to 2006, shows the steepest downward trend of 13.3 percent per decade, relative to the 1981 to 2010 average. The earliest period, 1979 to 1992, has a downward trend of 6.4 percent per decade, while the most recent period of low extents, 2007 to 2020, has a downward trend of 4.0 percent per decade.
The overall, downward trend in the minimum extent from 1979 to 2020 is 13.4 percent per decade relative to the 1981 to 2010 average.”
How can the overall average be higher than the highest 1/3 of the period in question?
I haven’t checked the numbers myself. However I assume it’s because the one year “gap” between the 3 segments is included in the overall figure, but not in the individual segments.
See in particular 2006 versus 2007.
I didn’t think about that: makes sense.
“2007 to 2020 has a downward trend of 4% a decade…”. And what if you used all the data, including 2021 and 2022? Flat to barely down. Happy to do the calc, but I think you should do it and post the results. BTW, if you do the 10 year trend vs that 15 year trend, you’ll find that it’s up, not down or flat…
Using only September Arctic ice extent to make a case for decline is like only publishing the historical rainfall figures for January (lowest rainfall month in Australia) and making assumptions based on that data.
And of course that is deceitful.
Why does NSIDC only show September minimums and no where on their site will you find an image of the full dataset for SII or MASIE
NASA Arctic site does the same.
And of course the answer is that just a quick glance at all the data shows that Arctic ice has only decreased by about 15% since 1979 and stopped decreasing at least 12 years ago.
These are facts that Jim never acknowledges.
Peter,
At the risk of repeating myself, repeating myself:
Have you clicked any of the helpful links I have provided for your education?
Have you even read my helpful comments above?
If you have, why do you keep repeating such nonsense?
Since Mountaineer hasn’t got around to it yet perhaps whilst you’re clicking links you wouldn’t mind answering this question too?
Why does NSIDC denigrate MASIE when it has far greater precision than SII and shows extent since 2006 has trended about the same?
[Other repetitive assertions redacted – Mod]
Have you still not bothered to read this article Peter?
https://GreatWhiteCon.info/2016/02/dmi-masie-and-the-sea-ice-index-an-interview-with-walt-meier/
I suggest you do so.
It seems you haven’t even bothered to read this thread:
https://GreatWhiteCon.info/2022/10/rewriting-the-arctic/#comment-650254
Peter, it’s perfectly fine to look at January rainfall figures and if trends occur then, and only then, is it reasonable to seek an explanation.
That is the whole point of statistics: they must be carefully interpreted reflecting on why they were taken in the first place.
Good morning Taylor (UTC),
Peter asserts that “Using only September Arctic ice extent… is deceitful.”!
Up compared to what?
Apples versus oranges, perhaps?