If the 2021 maximum Arctic sea ice extent is more your thing then please see the previous article:
“The 2021 Maximum Arctic Sea Ice Extent“
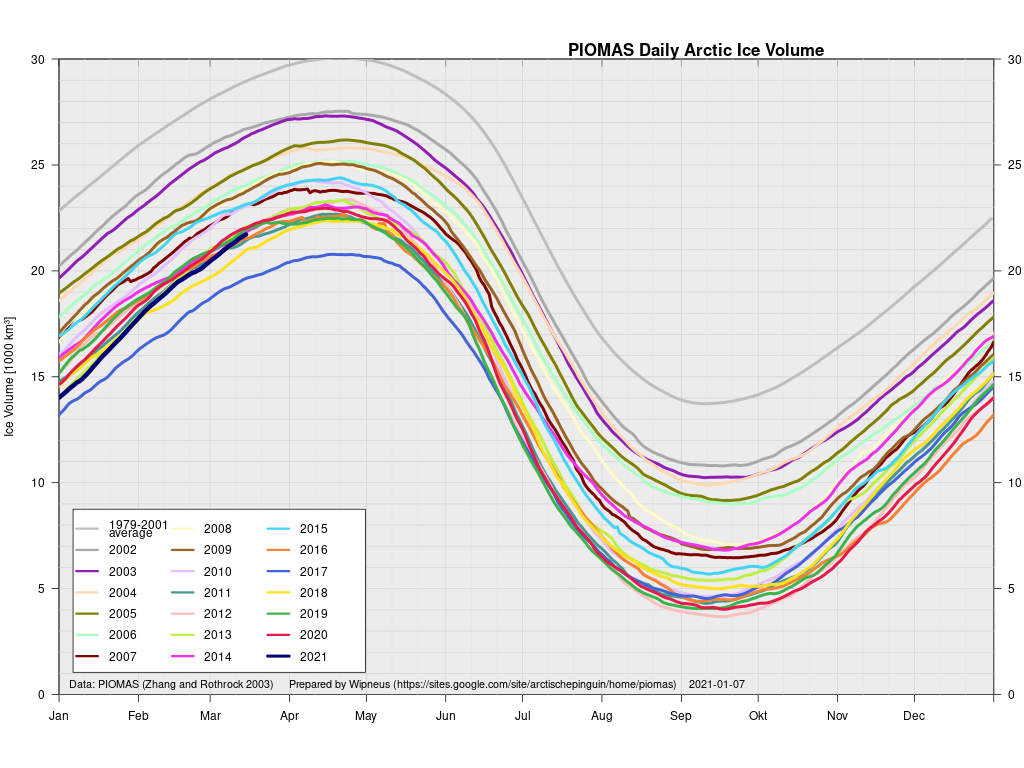
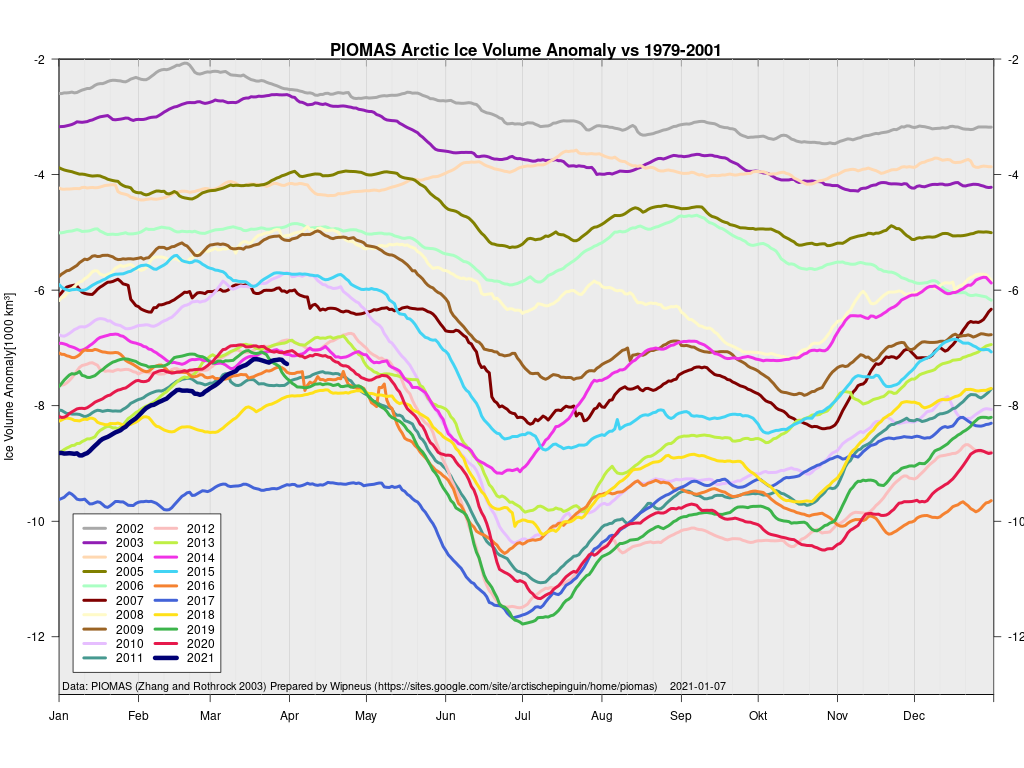
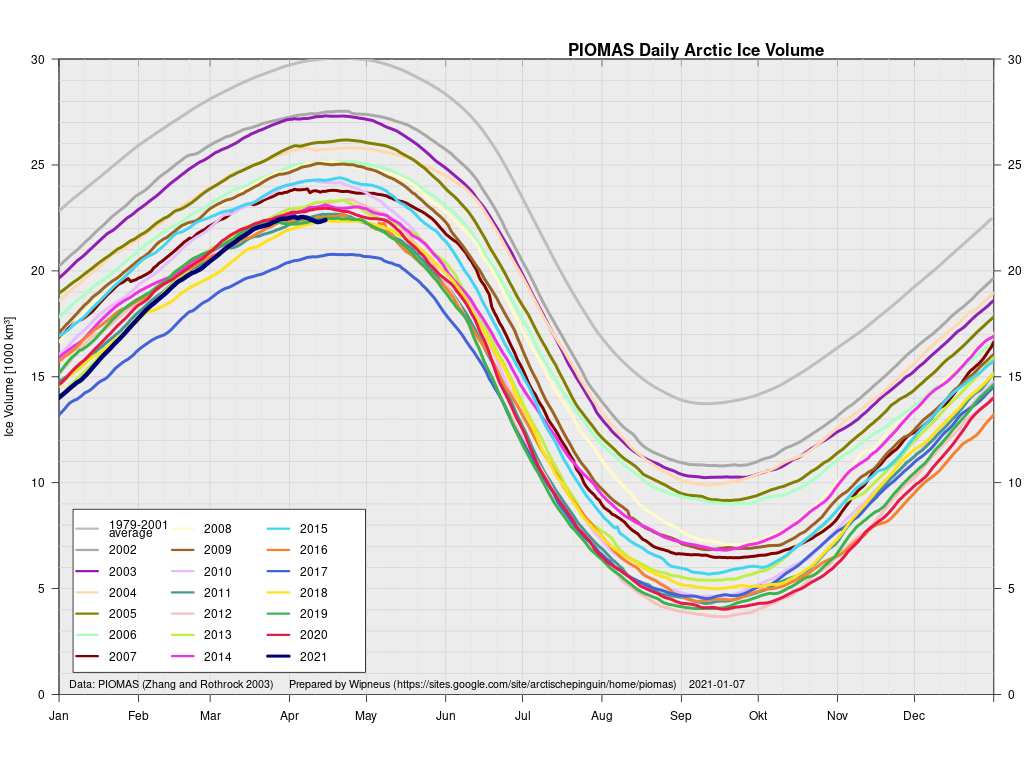
Maximum volume is still several weeks away, but let’s first of all take a look at the PIOMAS modelled volume numbers for February. They are not yet available via the University of Washington’s Polar Science Center web site, but Wipneus has once again crunched the gridded thickness numbers which are already available. Here is what they reveal:
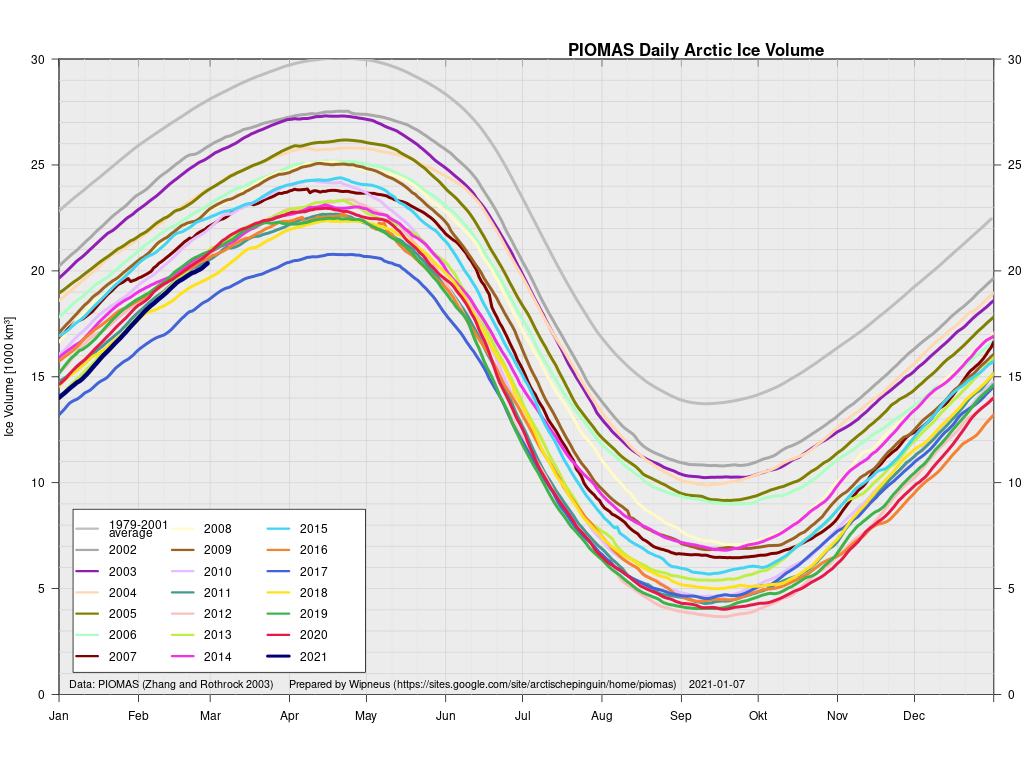
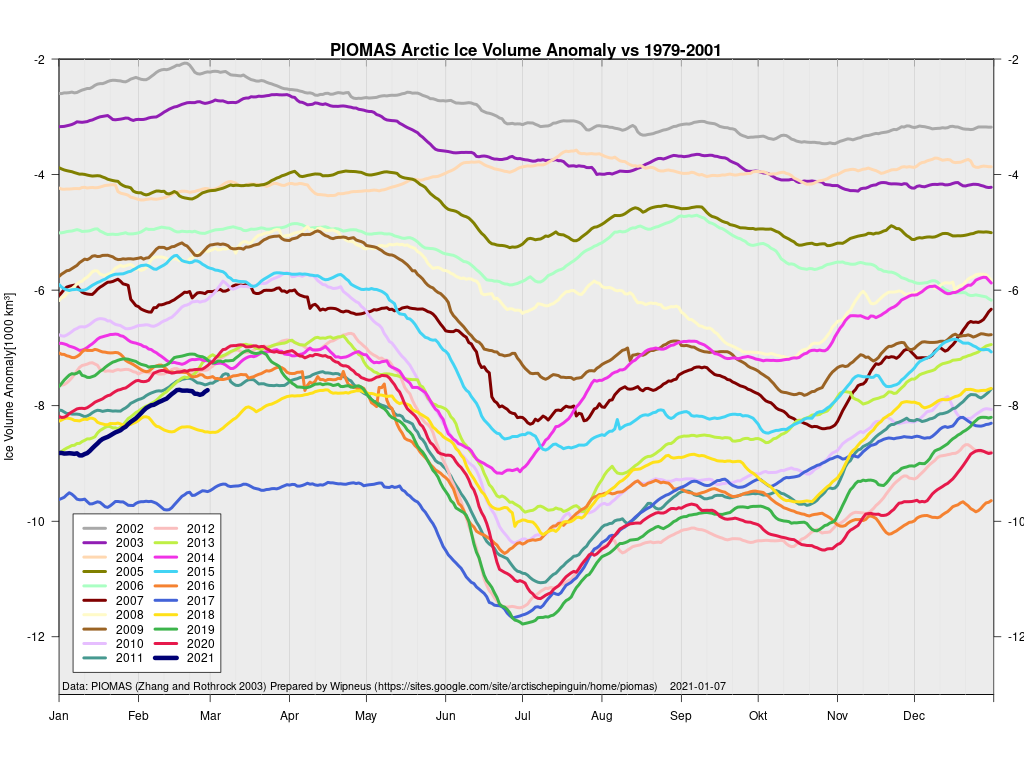
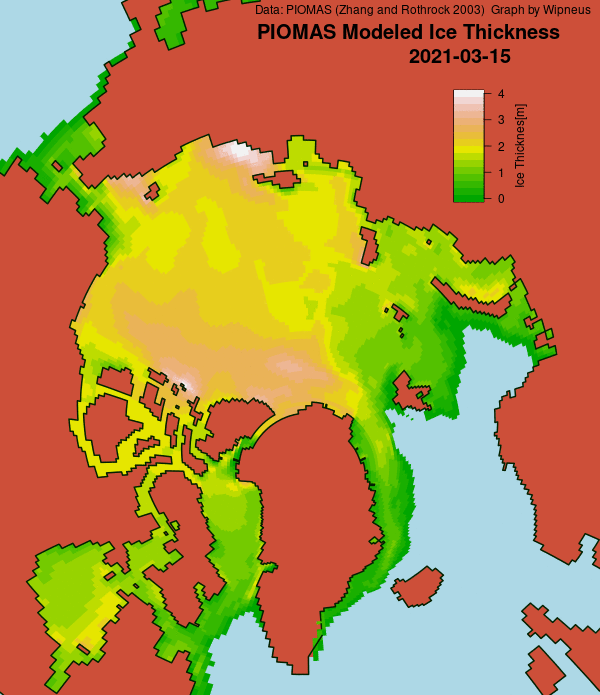
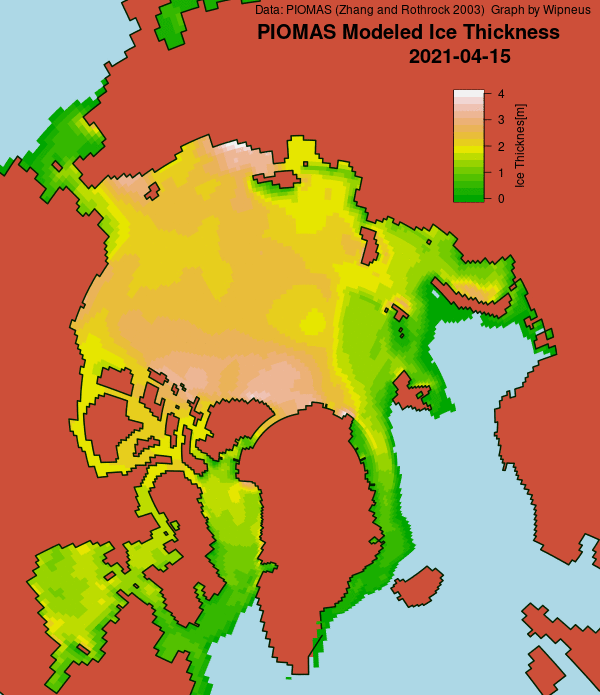
As you can see, it will be a big surprise if the 2021 volume maximum occurs in March rather than April, and 2021 is currently 3rd lowest for the date, behind 2017 and 2018. For completeness here too is the PIOMAS thickness map for the end of February:
This does contain some surprises, such as an area of thick ice along the shore of the East Siberian Sea, but no such thing along the north coast of Greenland, the traditional bastion of “the thickest ice in the Arctic Ocean”.
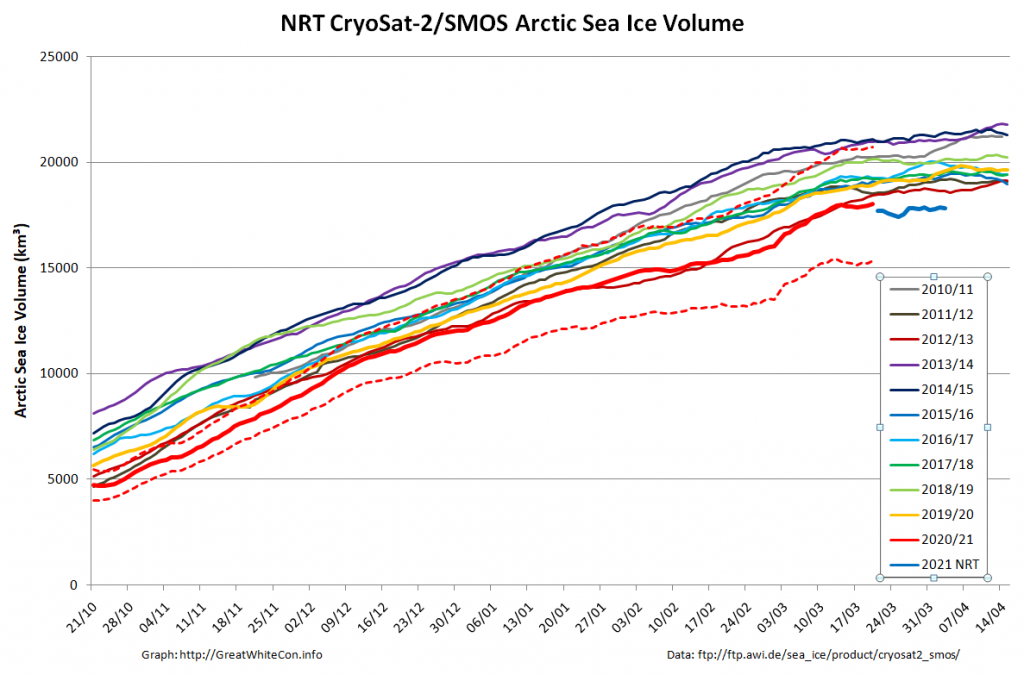
The “measured” Arctic sea ice volume calculated from CryoSat-2 and SMOS thickness data has also updated to February 28th:
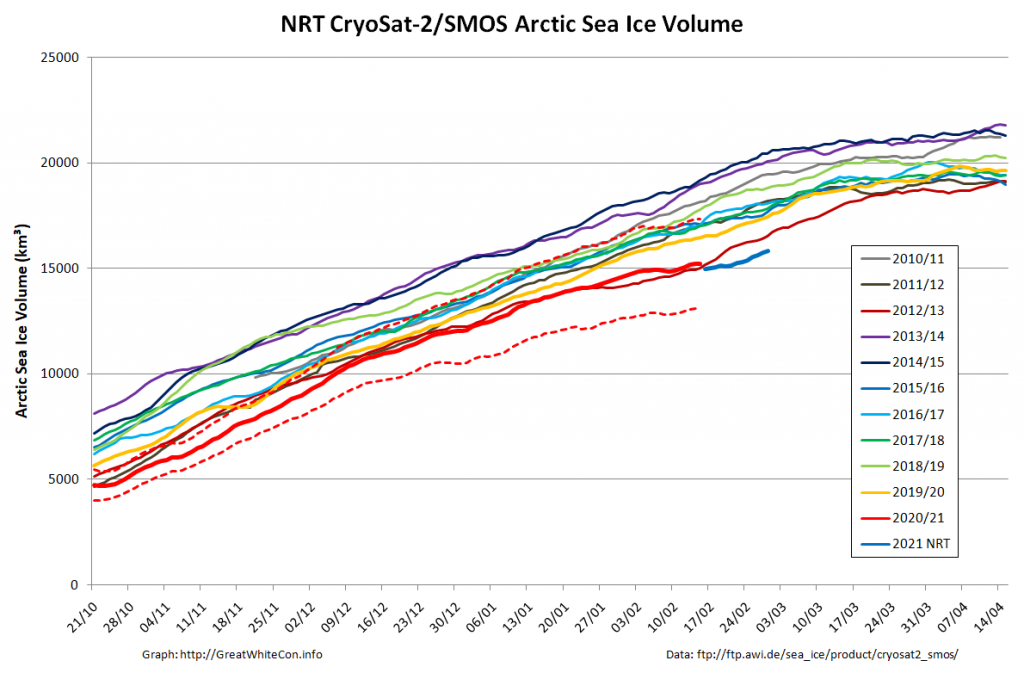
Note that the “near real time” figures graphed in blue will almost certainly be revised upwards when the “reanalysed” data is released in a couple of weeks. Equally certainly they will be “lowest for the date” in the 11 year record.
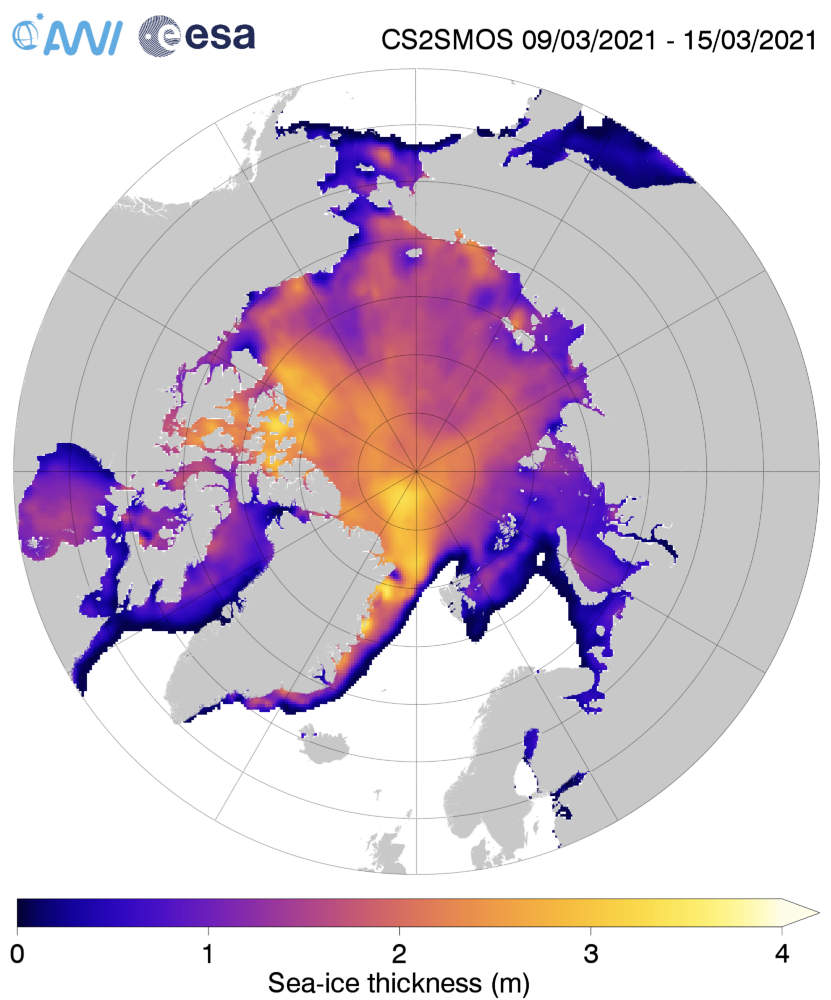
Here also is the CS2/SMOS thickness map for February 28th for comparison purposes:

There has recently been some debate on the Arctic Sea Ice Forum about where the thickest ice in the Arctic is currently located. If you watch this ASCAT animation of the 2020/21 freezing season thus far carefully you can see there is still a large area of multi-year ice around the North Pole, in particular reaching towards Svalbard:
An equivalent area of thicker ice in that area seems to be strangely lacking in this GOFS thickness map:
By way of comparison, here’s ASCAT’s view of the 2019/20 freezing season:
For some further historical context and another ASCAT animation see also:
“Where’s the Thickest Arctic Sea Ice Gone?“
The February 2021 update is now available on the Polar Science Center web site. As well as the latest updates on Arctic sea ice volume it also includes these thickness anomaly maps for both PIOMAS and CS2/SMOS. Note that since CryoSat-2 didn’t launch until 2010 the anomaly baseline in both cases is 2011-2020:
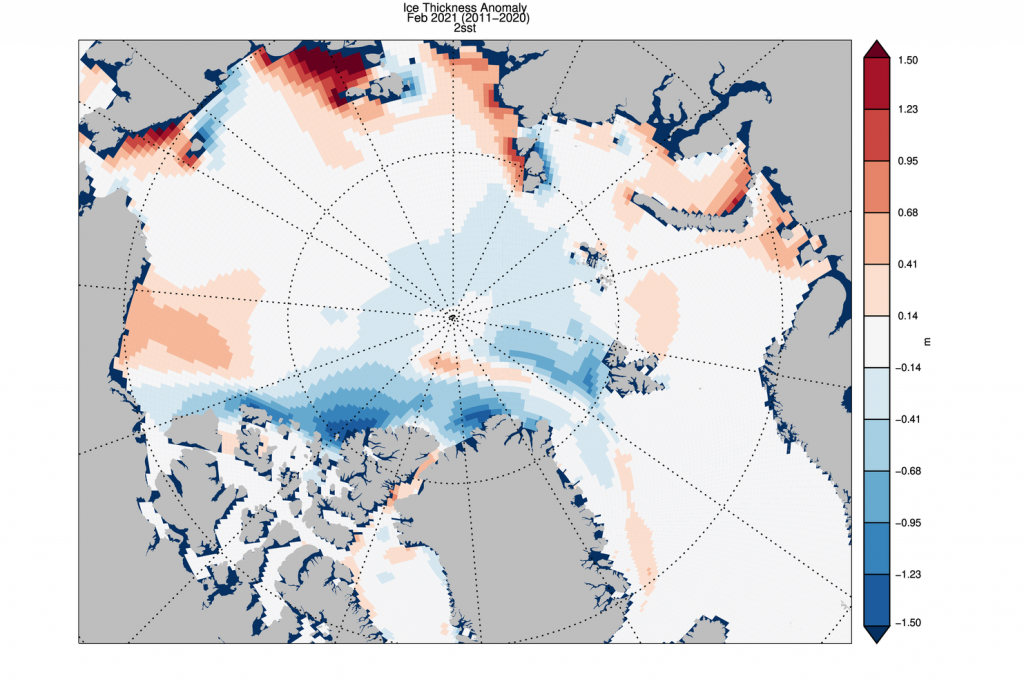
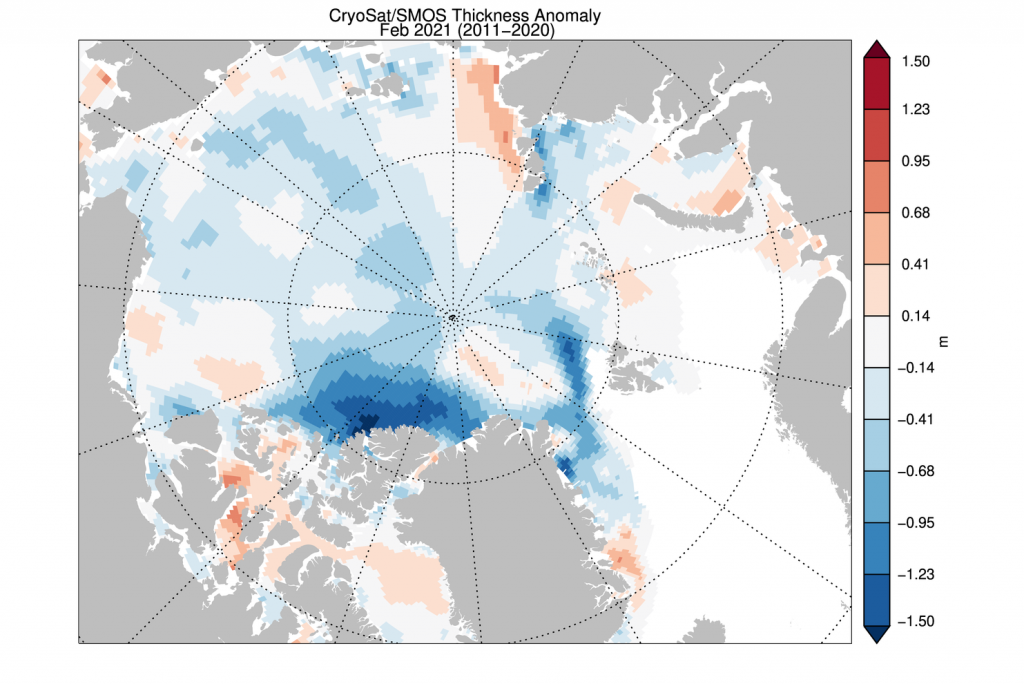
The ice thickness anomaly map for February 2021 relative to 2011-2020 shows a mixture of positive and normal anomalies across the Arctic with strong negative anomalies stretching from North of Greenland into the Eastern Beaufort. Strong positive anomalies exists near the East Siberian Sea, along the Siberian Coast of the Chukchi. Thicker than normal (2011-2020) ice is also present in the Beaufort. A strong positive anomaly is notable in the Laptev Sea. CS2/SMOS satellite data show a broadly similar anomaly pattern but the positive anomalies in the East Siberian and Chukchi Seas are much weaker.
The mid month PIOMAS gridded thickness numbers have been released. Here’s the map for mid March:
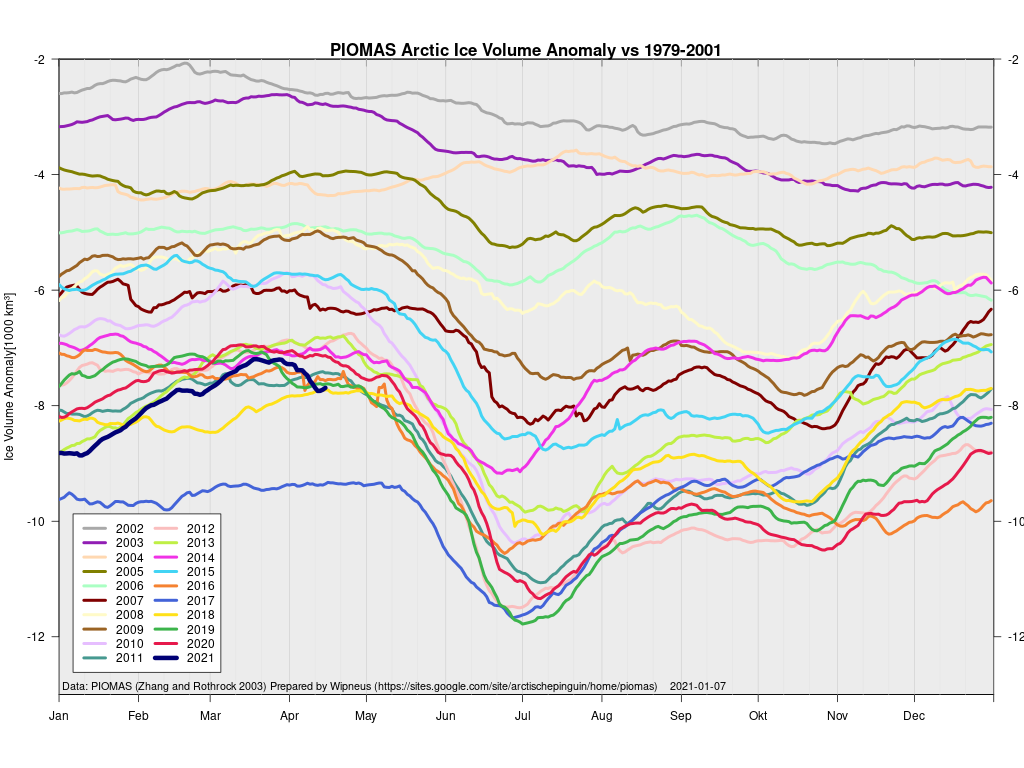
plus the calculated volume and anomaly thereof:

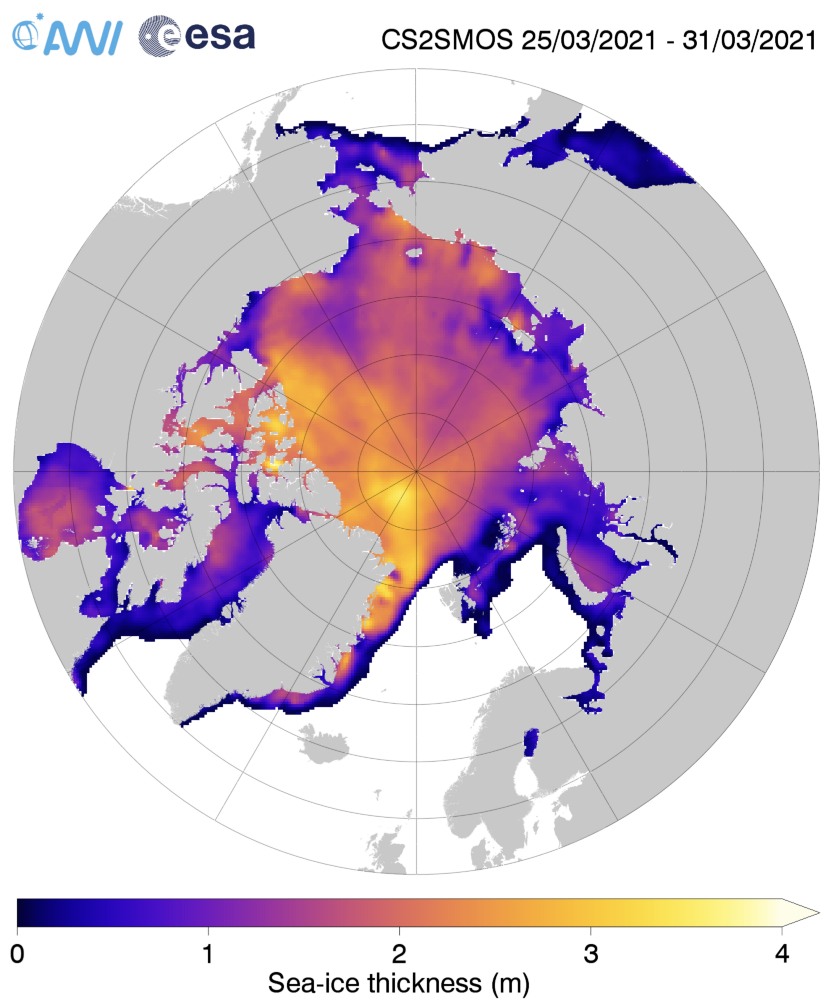
The PIOMAS model currently places 2021 at 5th lowest for the date, with thick ice still building on the shores of the East Siberian Sea. The CS2/SMOS thickness map is still showing significantly thinner ice in the same area:
The end of March PIOMAS gridded thickness numbers have been mapped by Wipneus:
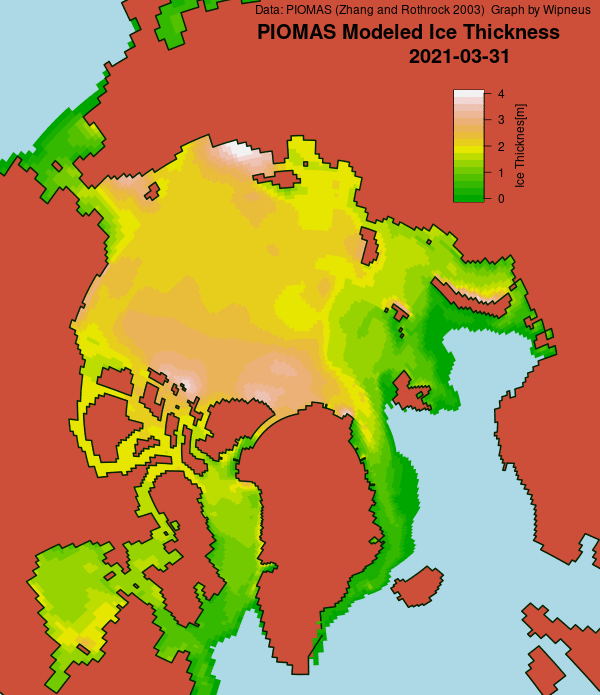
They show the fast ice on the shores of the East Siberian Sea getting ever thicker, but once again C2S/SMOS begs to differ on the current thickness in that vicinity:
Maximum volume is still some weeks away, but according to the available CS2/SMOS data Arctic sea ice volume is currently lowest for the date. As suggested by the discontinuity in the graph, it seems prudent to take the “near real time” values with a large pinch of salt until the reanalysed data is published, since it looks as though there is still an issue with NRT data on the Russian side of the Arctic:
By way of a contrast, 2021 is currently 6th lowest for the date in the PIOMAS data:

Perhaps maximum volume anomaly has been reached for this winter though?
The March 2021 monthly update is now available on the Polar Science Center web site:
Average Arctic sea ice volume in March 2021 was 21,700 km³. This value is the fifth lowest on record for March about 2,000 km³ above the record set in 2017. Monthly ice volume was 38% below the maximum in 1979 and 25% below the mean value for 1979-2020.
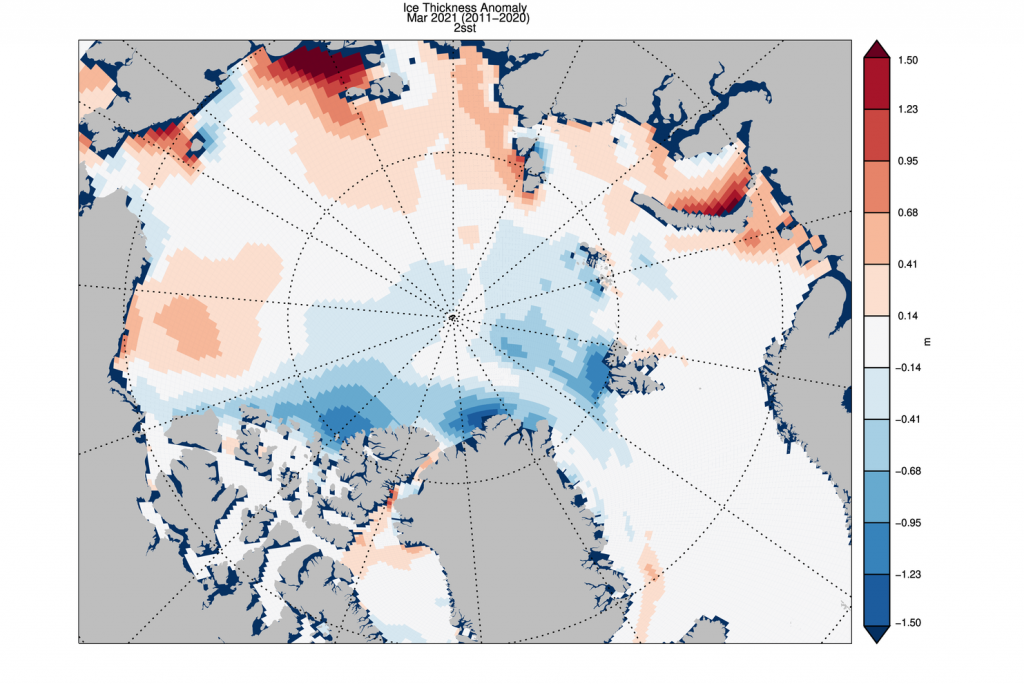
The ice thickness anomaly map for March 2021 relative to 2011-2020 shows a mixture of positive and normal anomalies across the Arctic with strong negative anomalies stretching from North of Greenland into the Eastern Beaufort. Strong positive anomalies exists along the Siberian Coast. Thicker than normal (2011-2020) ice is also present in the Beaufort.
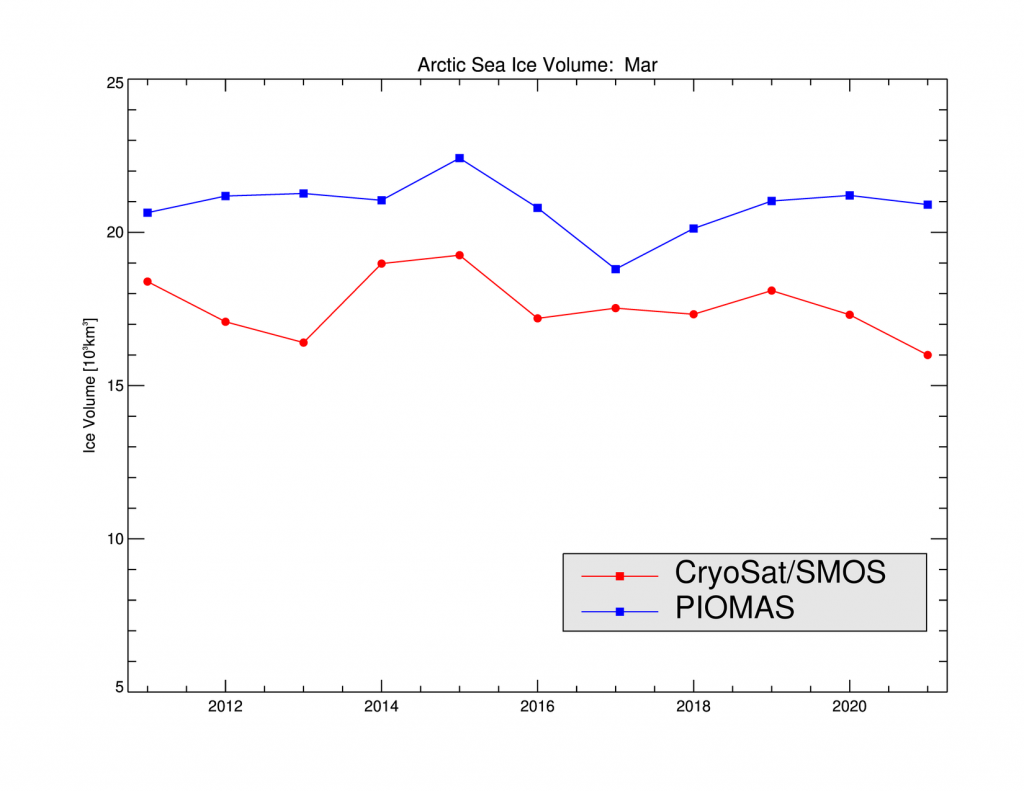
The update also includes this comparison with CryoSat-2/SMOS volume, which highlights the current divergence between the two metrics:
Whilst we eagerly await the mid month PIOMAS update, and having recently validated the Great White Con homebrew volume processing with the professionals, it is not beyond the bounds of possibility that the maximum CryoSat-2/SMOS volume for 2021 will ultimately prove to have occurred on March 22nd or thereabouts:
Here too is the latest AWI “near real time” thickness map:
The mid month PIOMAS gridded thickness data has arrived, and also reveals an early initial peak in Arctic sea ice volume this year, and hence an increasingly negative anomaly:
Here too is the modelled thickness map
and Fram Strait export graph:
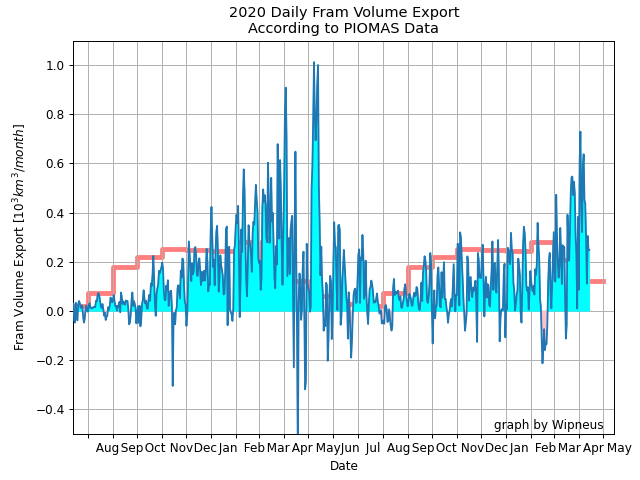
Speaking of Fram Strait export, here’s an informative animation:
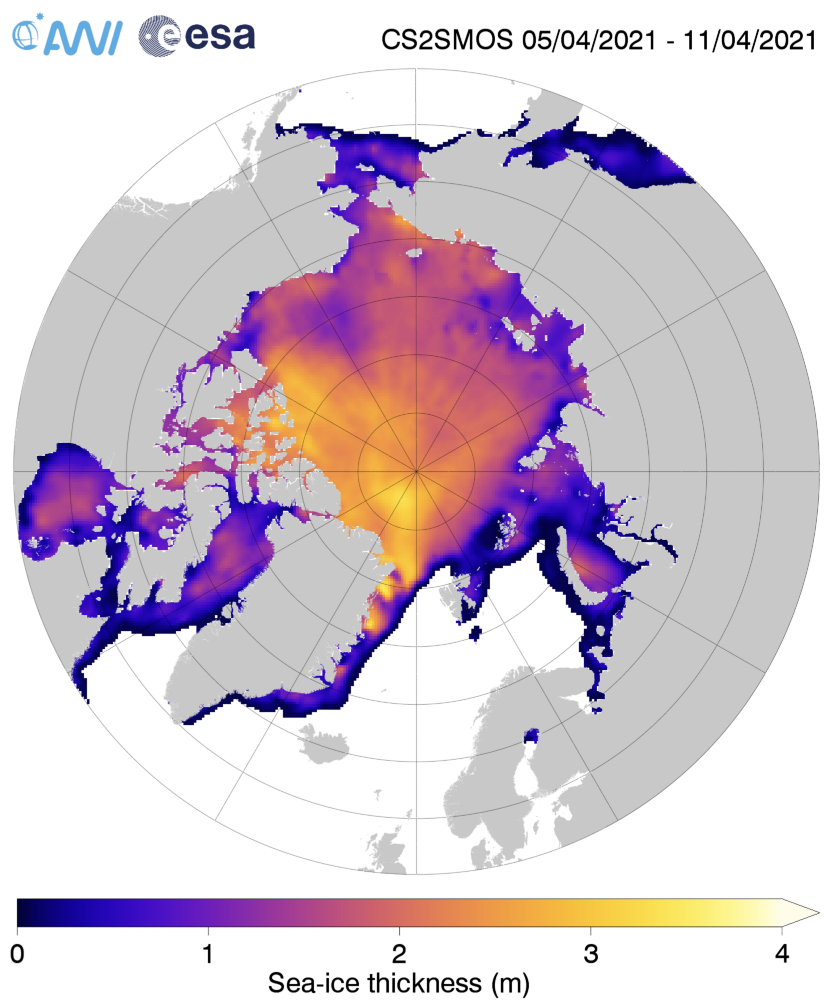
The final reprocessed CryoSat-2/SMOS Arctic sea ice thickness data of the 2020/21 season has just been published by AWI. Here is the resulting volume graph:
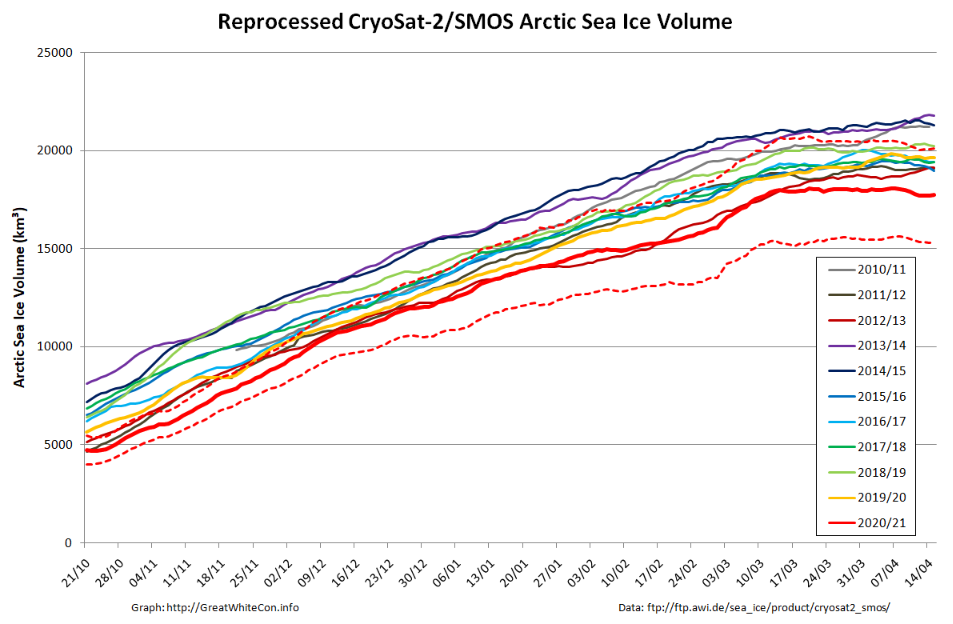
The official PIOMAS numbers for April haven’t been published yet, but Wipneus’s calculation based on the gridded thickness data is remarkably accurate. Subject to a last minute correction the maximum Arctic sea ice volume metrics for 2021 read as follows:
PIOMAS – 22550.0 km³ on April 3rd
CS2/SMOS – 18060.5 km³ on April 7th
Watch this space!
Thank you for your excellent Arctic ice analysis. I really appreciate your clarity and the ability to logically prioritize the information as a simple, straightforward analysis. This is in great contrast to some people just being mired down in the empirical data as a “forest for the trees” problem. haha.
Clarity is important in communication: you can tell when people do or don’t know what they are talking about.
My favourite Shakespeare line is, “Brevity is the soul of wit.” What a lesson!
Hey, has anyone read “On Writing: Memoir of a craft”, by Stephen King? So interesting to see inside how he structures things- he reckons he hardly ever resorts to plot but relies on the strength of the situation to organise what ends up on the page. Editing is par for the course, of course, but it was cool to read about how his brother, mother and uncle all taught him little relevant things – etc… very cool.
(Oh, btw, he starts with the statement that most books on writing are full of it so the shorter he makes the book the less chance it will be full of waffle. He also recommends another book, more dedicated to the proper use of grammar which he didn’t want to harp on about because he recommended this as having pretty much everything you need to know, which was even shorter.
So, Brevity once again it would seem is the shot…)
In short, I second the comment by voidisyinyang ~#^\/-|<
At present machinery competes against man. Under proper conditions machinery will serve man. There is no doubt at all that this is the future of machinery, and just as trees grow while the country gentleman is asleep, so while Humanity will be amusing itself, or enjoying cultivated leisure – which, and not labour, is the aim of man – or making beautiful things, or reading beautiful things, or simply contemplating the world with admiration and delight, machinery will be doing all the necessary and unpleasant work. The fact is, that civilisation requires slaves. The Greeks were quite right there. Unless there are slaves to do the ugly, horrible, uninteresting work, culture and contemplation become almost impossible. Human slavery is wrong, insecure, and demoralising. On mechanical slavery, on the slavery of the machine, the future of the world depends. And when scientific men are no longer called upon to go down to a depressing East End and distribute bad cocoa and worse blankets to starving people, they will have delightful leisure in which to devise wonderful and marvellous things for their own joy and the joy of everyone else. There will be great storages of force for every city, and for every house if required, and this force man will convert into heat, light, or motion, according to his needs. Is this Utopian? A map of the world that does not include Utopia is not worth even glancing at, for it leaves out the one country at which Humanity is always landing. And when Humanity lands there, it looks out, and, seeing a better country, sets sail. Progress is the realisation of Utopias.
(Oscar Wilde, The Soul of Man under Socialism)
“From now on, the earth will never cease to have seed-sowing and harvest, cold and heat, summer and winter, and day and night.” – Genesis 8:22
Great centres of civilization have come and gone leaving their tracks in the desert for thousands of years. Climate change is not new.
Babel, Ur, Ramesseum, Nineveh, Persepolis, Palmyra…
NASA on “Climate change and the rise and fall of civilizations”:
https://climate.nasa.gov/news/1010/climate-change-and-the-rise-and-fall-of-civilizations/
Would you quibble with their conclusion?
Jim, I would agree that the ‘maintenance’ of civilization depends on the stability of the assumptions (including climate) that it was built on. However, every great civilization in the past was created during a period of warming (Minoan, Roman, Renaissance, Current Climate Optimum) and was damaged or destroyed when those conditions changed. Our (relatively primitive) technology rescued civilization from the Little Ice Age, and today’s technology will power us through the next cold period (if we don’t rely too much on renewables). That’s the adaptation for which we need to prepare. Imagining we can create ‘climate stability’ is hubris, and carbon capture is its poster child.
Jim, further to this article, do you believe, as the article says, that the climate has ‘been stable for the last twelve thousand years’? I guess they mean by stability that we haven’t had a catastrophic Ice Age in that time, but that seems a pretty low bar to measure stability. Today’s steady warming (.14C/decade) seems pretty non-alarming by that standard. What’s all the fuss?
At a guess ‘the fuss’ is in part about this sort of thing?
and:
Not to mention:
Perhaps the suggestion is to endeavour to avoid an excess of ‘climate instability’?
When do you anticipate ‘the next cold period’ arriving?
Who is ‘we’, I would contend!(?!?) Yes, we must necessarily quibble because civilisation did not build itself!!
Like viruses the rich are not an exact enemy….
“I guess they mean by stability that we haven’t had a catastrophic Ice Age in that time, but that seems a pretty low bar to measure stability.”
No, that’s obviously not what they mean, and I’m not just guessing. What they mean is we haven’t had a crazy spike of increased CO2 with its accompanying warming spike (with its own wild temperature swings, drought and floods). But, hey, we do now.
The article says:
‘It’s not surprising that climate change has doomed so many populations, Blom says. After all, it was when weather patterns finally became predictable about 11,500 years ago that complex civilizations finally formed in the first place. A stable climate ensured that crops would grow year after year, and a reliable source of food freed people to settle down and develop culture.’
https://climate.nasa.gov/news/1010/climate-change-and-the-rise-and-fall-of-civilizations/
We have had 40 years of steady CO2 growth during which the temperature has increased at a linear rate of .14C/decade (1.4C a century). At that rate (an no assurance it will continue, given natural variability), we will be up a further 1.1C by 2100, well within the ‘no panic’ parameters laid down by the IPCC. So there is no ‘spike’ and in the meantime that CO2 has driven greening of the planet and crop productivity.
If you want to talk about ‘wild temperature swings’ try checking on the 18th and 19th centuries during the Little Ice Age. We’ve nearly pulled out of that distressing time and are nearing another Optimum, and I, for one, am hoping we won’t repeat that swing downward.
What relevance that has to CO2 is still not clear, given the previous MWP (not to mention the Minoan and Roman periods).
BTW, you might want to talk to the Mayans about ‘recent climate stability’. There seems to be strong evidence that their advanced civilization was wiped out by changing climate without benefit of ‘spikes in CO2’. If I were CO2, I’d sue for defamation…
I had no idea that you were such a big fan of the IPCC Taylor! However you don’t seem to be a fan of basic physics? For example, do you go along with the theory that in the absence of “greenhouse gases” planet Earth would be suffering from an extremely “catastrophic Ice Age”?
As you may have noticed we concentrate on a variety of icy Arctic metrics here rather than obsessing over “surface temperature”. However here’s an overview of the current rate of change of surface temperature inside the Arctic Circle courtesy of Zack Labe:
Does that qualify as a “spike” in your book? Or is it a “wild temperature swing” or even “steady growth”? More like 1.4C a decade!
Sorry for the delay in responding. I am a fan of physics and certainly know that greenhouse gases keep the planet’s temperature significantly above the temperature without them. However, I also know, as do you, that water vapor is far and away the dominant greenhouse gas on the planet, and the comment from David (above) was about ‘crazy spikes in CO2’ and supposedly corresponding spikes in temperature. You and I know that there have been ‘crazy’ spikes in the past without benefit of CO2 increases, so correlation does not always imply causation. Sorry to get the post off track.
Correlation certainly does not always imply causation, but perhaps physics does?
Here’s Eunice Foote’s experimental results in her 1856 “Circumstances Affecting the Heat of the Sun’s Rays” presentation, read by A.N. Other male:
Plus the “Story in a nutshell” from the American Institute of Physics:
https://history.aip.org/climate/summary.htm
“We have had 40 years of steady CO2 growth during which the temperature has increased at a linear rate of .14C/decade (1.4C a century).”
Well, if that science denier talking point was old in 2011, it’s certainly ready to pop off now.
https://skepticalscience.com/monckton-myth-3-linear-warming.html
Climate variability is ongoing, just as it has been in the past. However, the sudden influx of human-generated CO2 is what is currently causing global warming to override climate variability. We’re likely heading for another below-average Solar Maximum in 2027, just as we’re likely to see warming continue to accelerate.
I’m not trying to be rude or pedantic, but this threat is just a bit too existential to lazily throw around opinions and assumptions like chunks of coal.
More Monckton myths:
https://GreatWhiteCon.info/2016/03/how-to-make-a-complete-rss-of-yourself/
Sorry , David, but .14C/decade has nothing to do with the good lord Monckton, but instead to the peer-reviewed (repeatedly) results from UAH satellite measurements, the gold standard in uniform planet-wide. temperature anomalies over the last 40 years. I know the folks at Skeptical Science like to beat up on Monckton, but it would better for them to pick on real skeptical scientists and refute them. And BTW, the word ‘accelerating’ is hardly applicable to most of the data, particularly Arctic Ice, where many trends are flat over the last 10 years or so, as PIOMAS recently mentioned.
However AWI CryoSat-2/SMOS volume is currently “lowest ever” in the admittedly short record. See above.
I don’t know which your favourite reanalysis product might be, but here’s a quick ERA5 monthly pan Arctic surface temperature timeseries. Of course it doesn’t include this month yet:
Eyeballing the recent peaks they look as though they’re anything but flatlining. How about you?
Taylor Pohlman, UAH is in no way, shape, or form the “gold standard” for temperature data. There is no scientific reason to believe it is, either. In point of fact, it shows a much slower rate of warming than any other major data set, including RSS (the other satellite data set). Using UAH while ignoring the others is cherry picking.
It should also be noted that the UAH TLT is for the Lower Troposphere, not the surface.
Jim, is there a Slater-50-day-forecast for 2021?
Not yet I’m afraid.
David, what do Solar Maximums have to do with anything?
Anything????
David’s point is that if you subscribe to the “solar” theory of “non anthropogenic” global warming then you surely should come to the conclusion that global temperatures must currently be reducing.
They’re not!
I wouldn’t count out the sun’s effects on planet temperature so quickly, Jim. It causes annual swings in the Arctic of over 30C, and in Siberia, about double that. What the long term effects are to cause slight upward or downward trends in that range are a subject of much scientific debate.
As you may well be able to imagine I am well aware of the effect of solar radiation in the land of the midnight sun. And the lack thereof in winter!
There seems to be much certainty about the sun’s effects on planetary temperature in certain “skeptical” circles?
I think you will also find that there is much scepticism in scientific circles regarding UAH being any sort of “gold standard” for surface temperature.
Prompted by a discussion on Twitter, here’s Wipneus’s PIOMAS thickness anomaly collage for March 2021:
Click the image for a 3.5 Mb closer look.
Well, PIOMAS is out and as expected, April volume is again above the long term trend, and shows an 11 year flat trend, similar to March. A longer pause will be needed to indicate a climate shift (how long will be a subject of dispute), but at least it’s a good start. Makes me wish we had PIOMAS equivalent from the 50s and 60s so we knew what the actual trend was vs starting at a high point in the late 70s.
Since the maximum has passed volume discussion has moved to the May thread.
However the alleged “11 year flat trend” you mention is conspicuous by its absence from the AWI’s “measured” maximum volume series.
There already is a “PIOMAS equivalent from the 50s and 60s”. It’s imaginatively entitled PIOMAS-20C:
“Arctic Sea Ice Volume Variability over 1901–2010: A Model-Based Reconstruction”