A couple of years ago I was asked to provide “a handful of things [you] will be keeping an eye on over the next few months to judge how ‘good’ or ‘bad’ the melt is going?”
My answer was, and remains:
5 fingers worth to start with? Not necessarily in order of time or importance!
1. How soon melt ponds and/or open water hang around in the Beaufort Sea this year. Things started very early [in 2016]:
https://GreatWhiteCon.info/2016/04/the-beaufort-gyre-goes-into-overdrive/
2. Ditto the Bering Strait and Chukchi Sea
3. Ditto the Laptev and East Siberian Seas
4. How many (and how deep, warm, wet) spring cyclones spin around the Arctic Ocean
5. How the snow melt progresses across Canada, Alaska and Siberia
Applying the same criteria this year, open water is already hanging around in the Beaufort Sea, as well as the Amundsen Gulf:
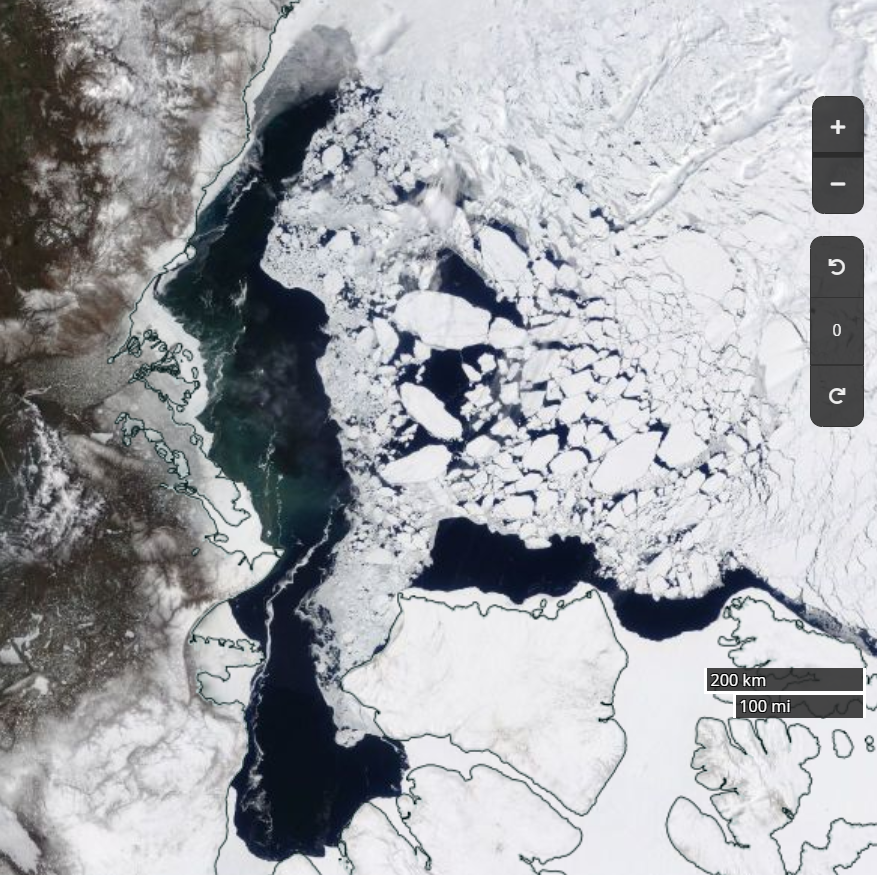
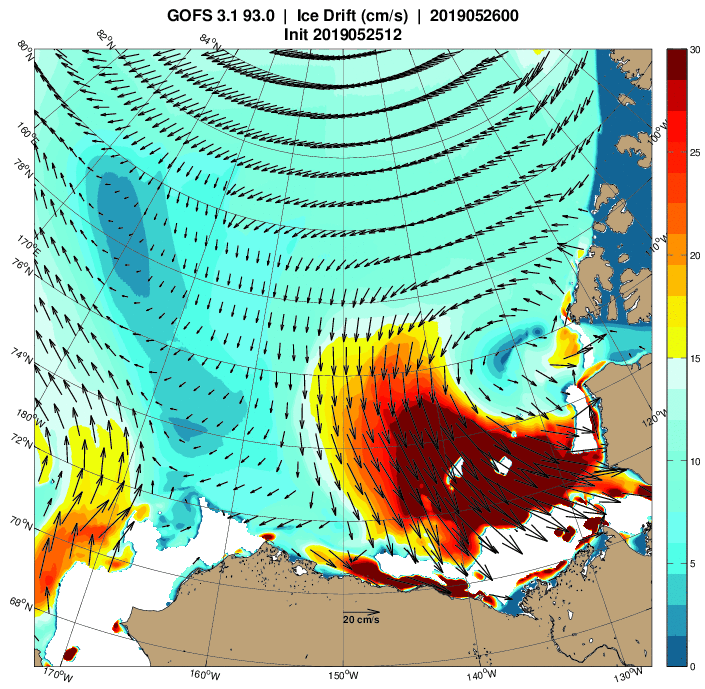
What’s more a cyclone is currently spinning in the area too:
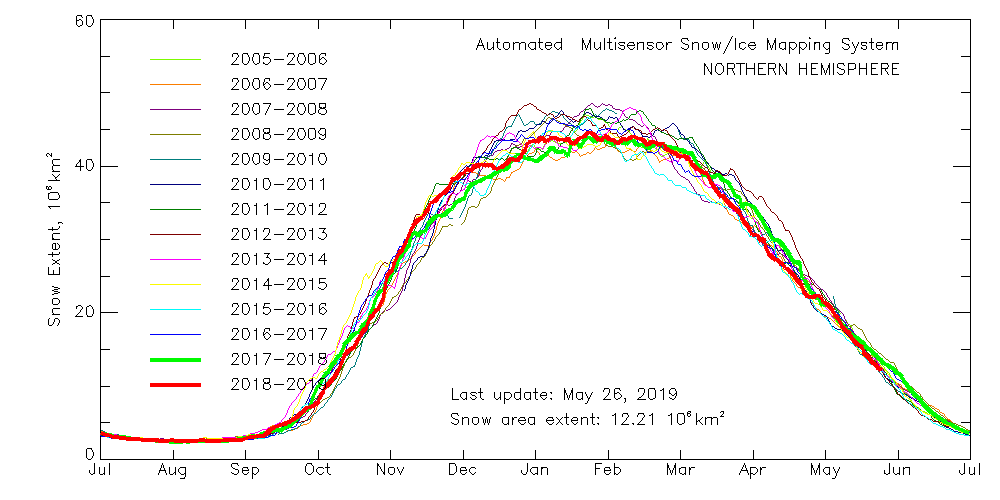
With those prerequisites in place, how about my other criteria? Here’s the current northern hemisphere snow cover graph:
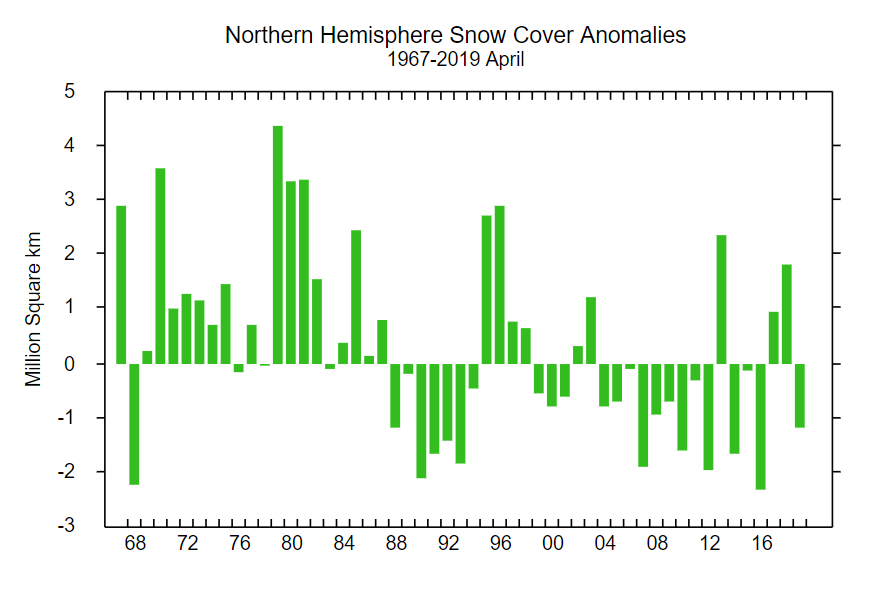
That suggests snow cover over land is close to recent lows, which is confirmed by the Rutgers University snow cover anomaly graph for April:
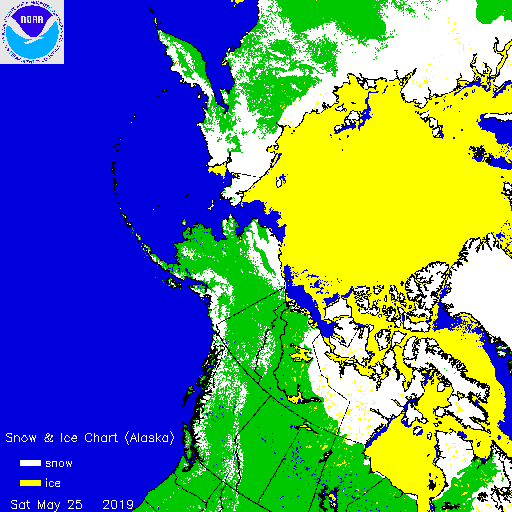
This year is anomalously low, but not by as much as 2012 and 2016. For completeness, here also is the current US National Ice Center snow cover map:
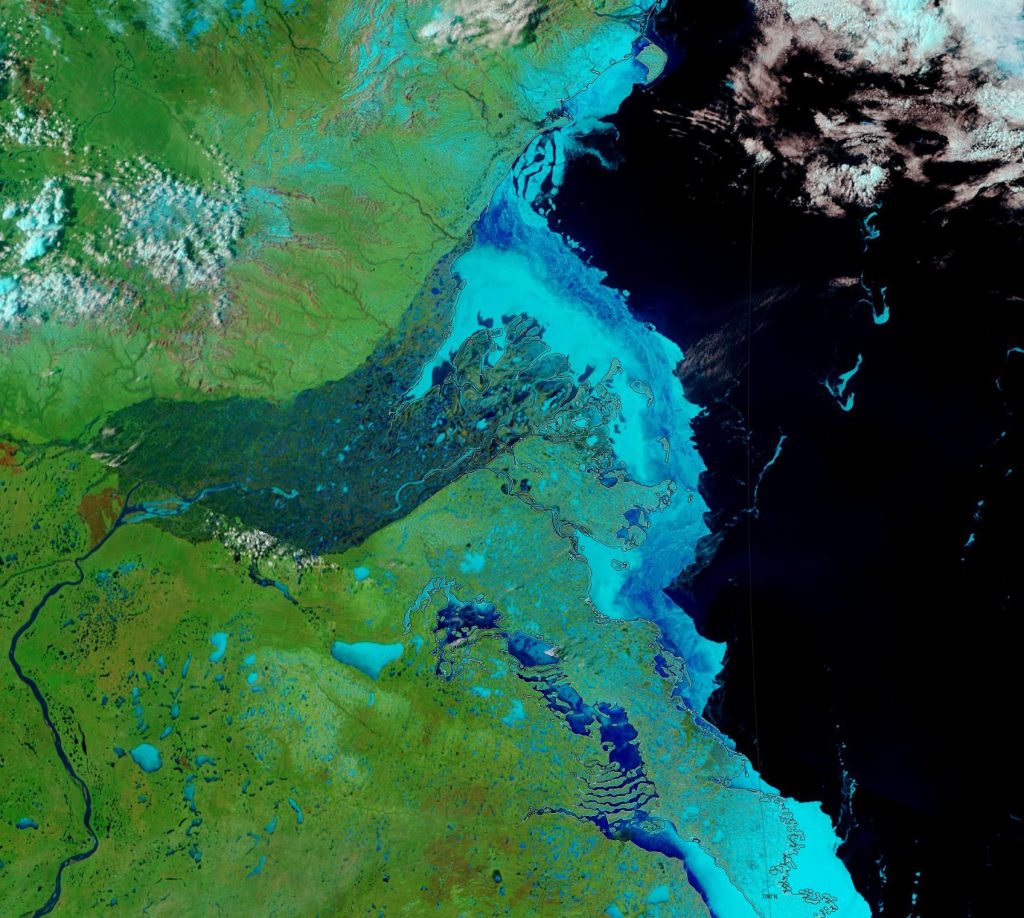
Moving on to melt ponds, there are plenty to be seen on the fast ice around the Mackenzie river delta:
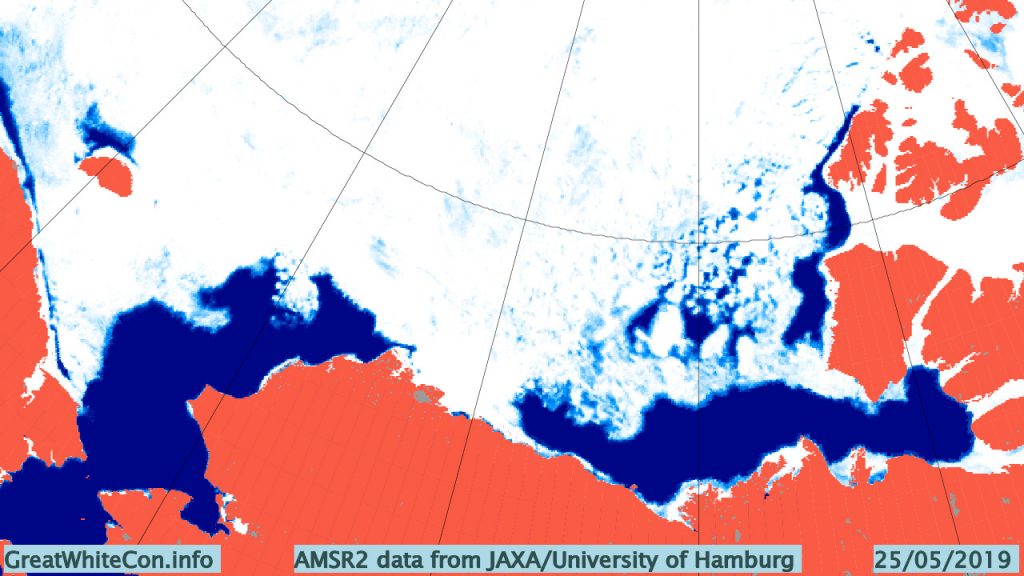
There also seem to be signs of some at a higher latitude off Ostrov Kotelny in the New Siberian Islands:
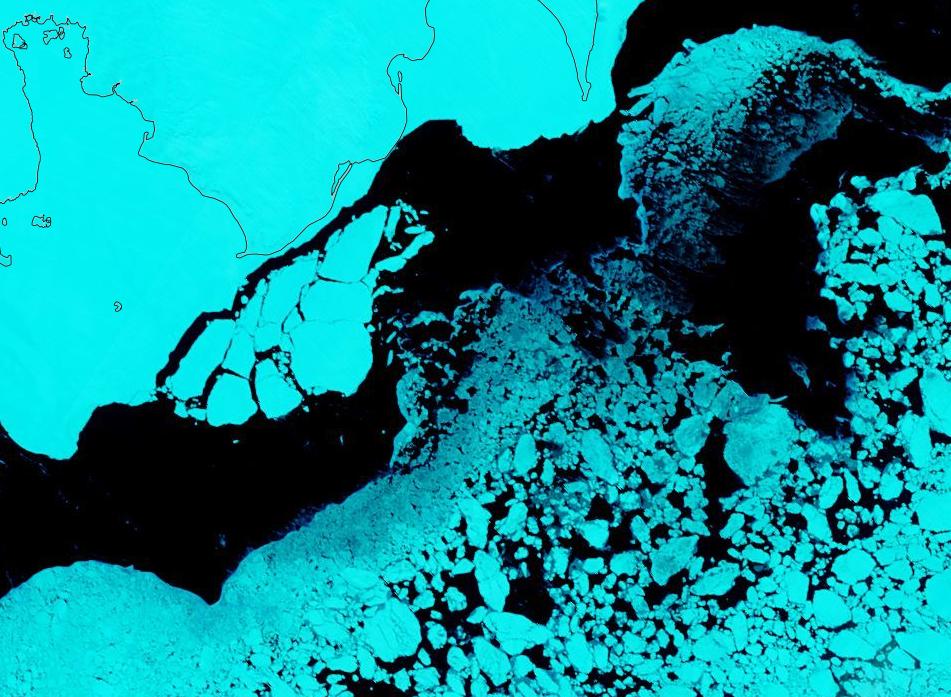
This year there is also a lot of open water in the Chukchi Sea, and almost no sea ice left in the Bering Sea:
Compared with 2016 at the same time of year I am compelled to say that with June 1st just around the corner the 2019 summer melting season is primed to progress more quickly.
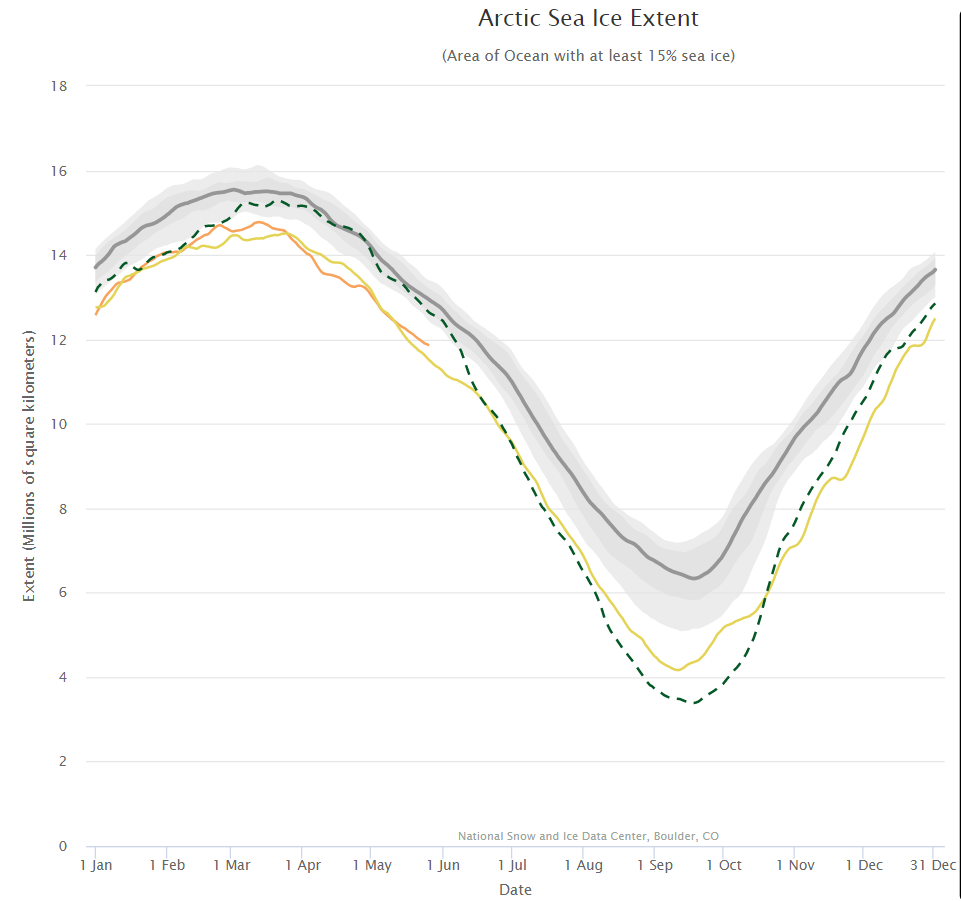
The next obvious comparison to make is with the (in)famous year of 2012, which resulted in the lowest ever minimum extent in the satellite record. Firstly let’s look at the National Snow and Ice Data Center’s graph of Arctic sea ice extent:
Currently extent is significantly below 2012, albeit somewhat above 2016 at the same time of year. And what of melt ponds? In 2012 there was evidence of less snow cover over land and more surface water on the ice on the Siberian side of the Arctic:
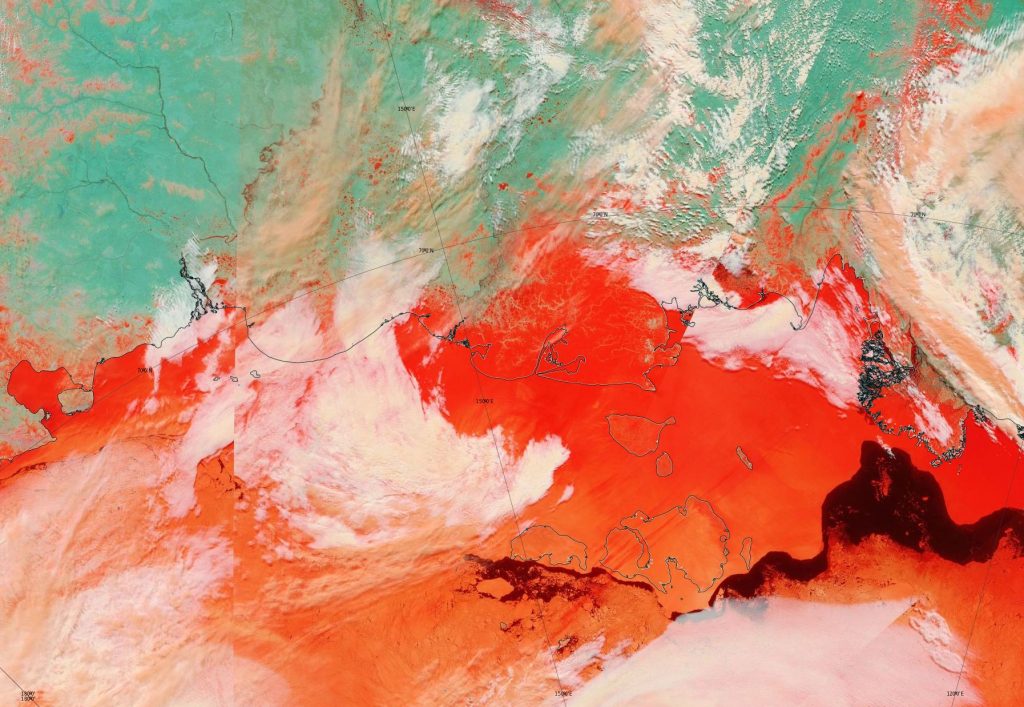
Other than that Arctic sea ice in 2019 looks to be in worse shape than in 2012.
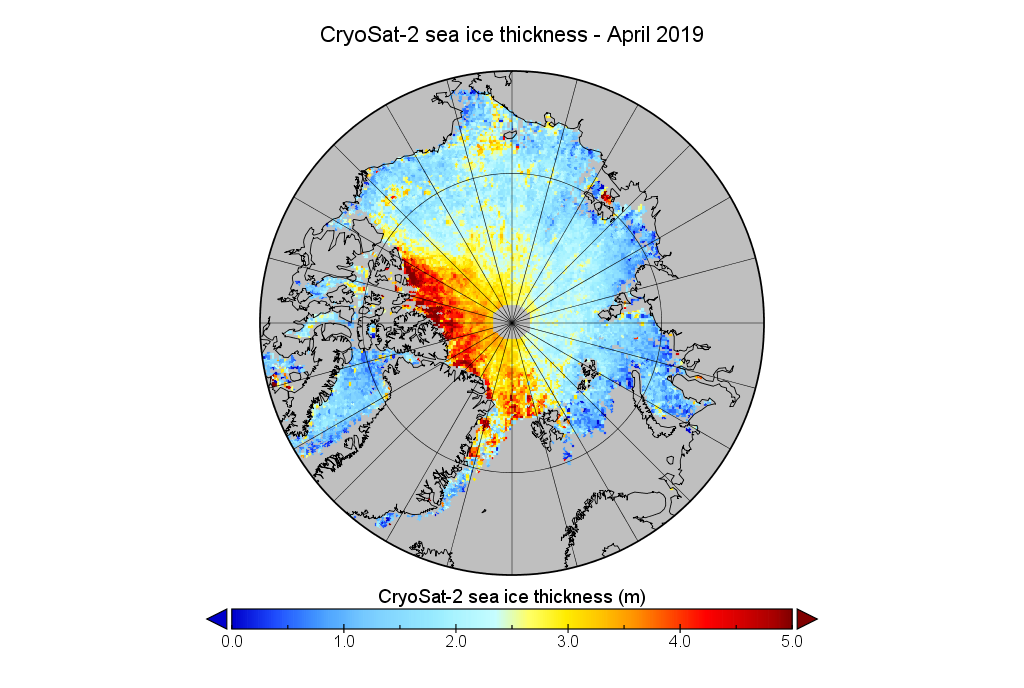
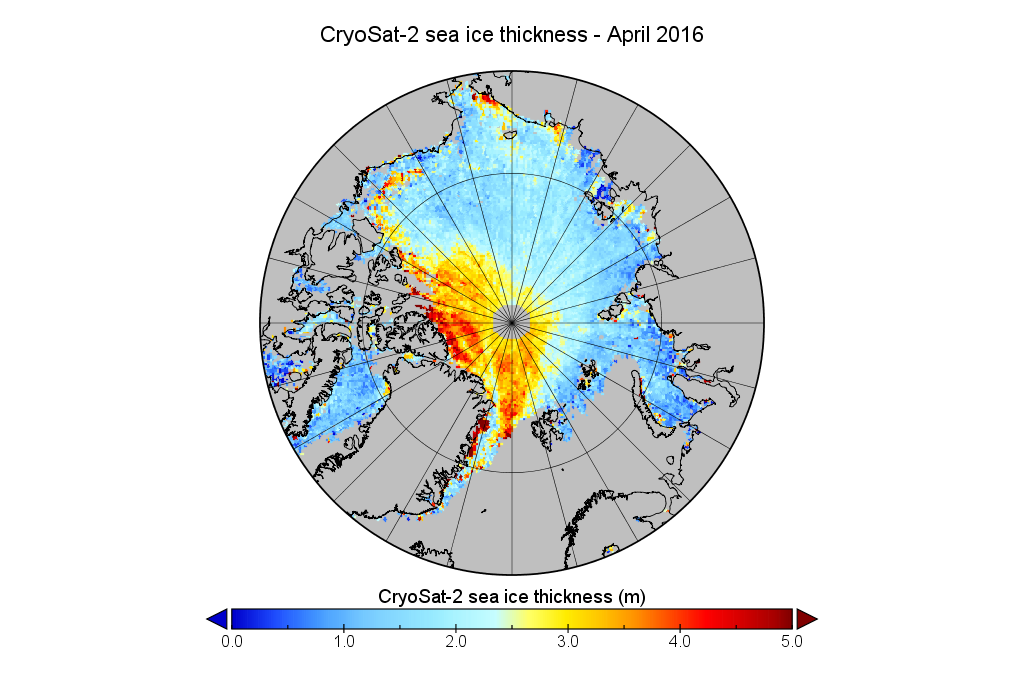
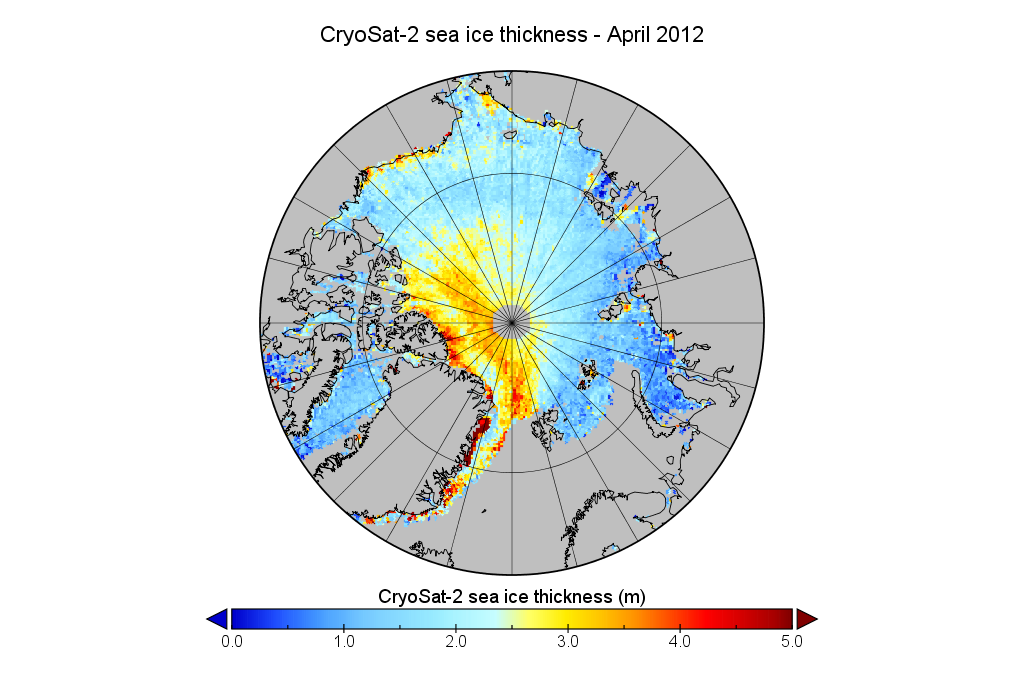
We’ve established that the extent of Arctic sea ice at the end of May 2019 is less than in 2012, but something else to consider is whether that ice is currently thicker than in 2012, or not. Satellites can have a reasonable stab at measuring the area of sea ice, but the third dimension is much trickier. The European Space Agency’s CryoSat-2 satellite has been attempting to measure sea ice thickness since 2010, so let’s take at the conclusions it has reached:
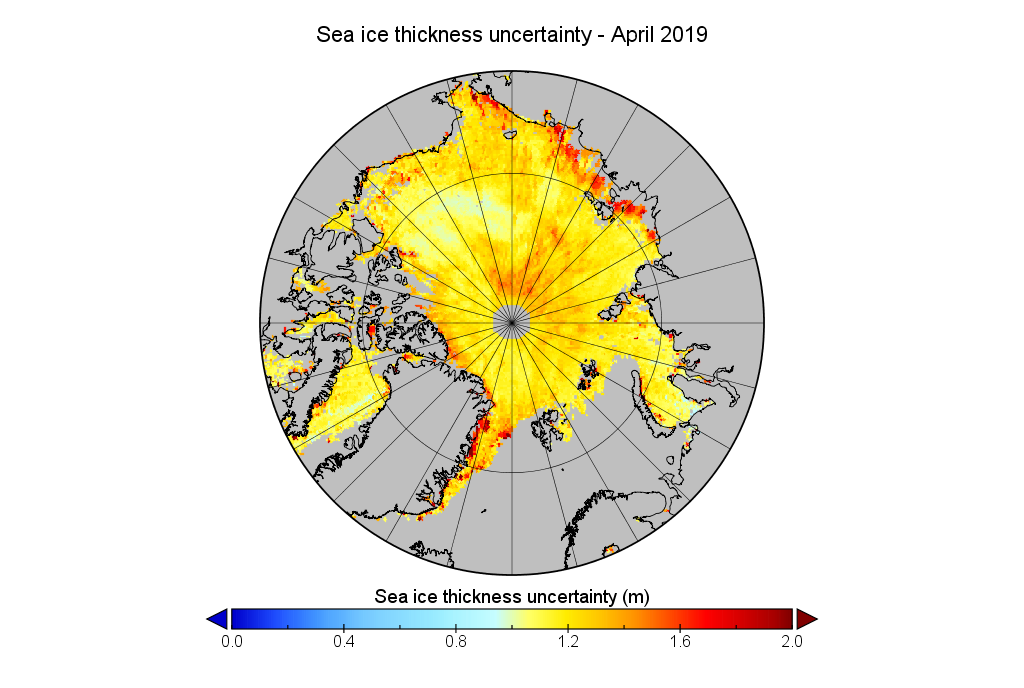
Don’t forget to take a good long look at the associated uncertainties too:
Watch this space!
