
An experienced team of polar explorers set off on April 4th intending to ski from a latitude of 88° North to 90° North, better known as the North Pole!
According to the expedition’s web site those 2 degrees of latitude are symbolic of the United Nations Framework Convention on Climate Change agreement in Paris to “hold the increase in the global average temperature to well below 2 °C above pre-industrial levels”, and are thus part of the expedition’s name.
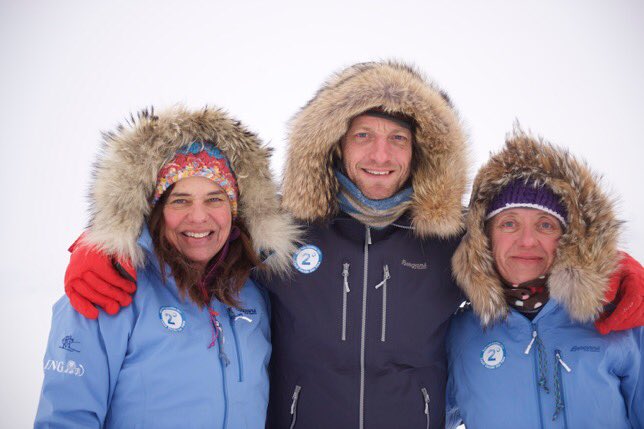
Here’s the team of Bernice Notenboom, Martin Hartley and Ann Daniels pictured shortly before departing on their arduous journey via the Russian Barneo ice camp near the North Pole:
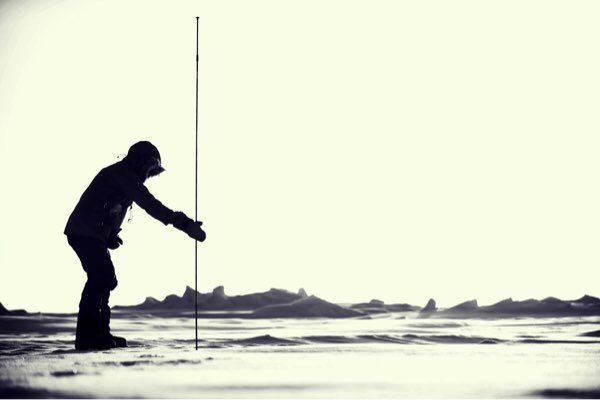
Apart from hauling their sleds across some very challenging terrain they will also be doing lots of “citizen science” en route, including stopping regularly to measure the depth of snow covering the sea ice:
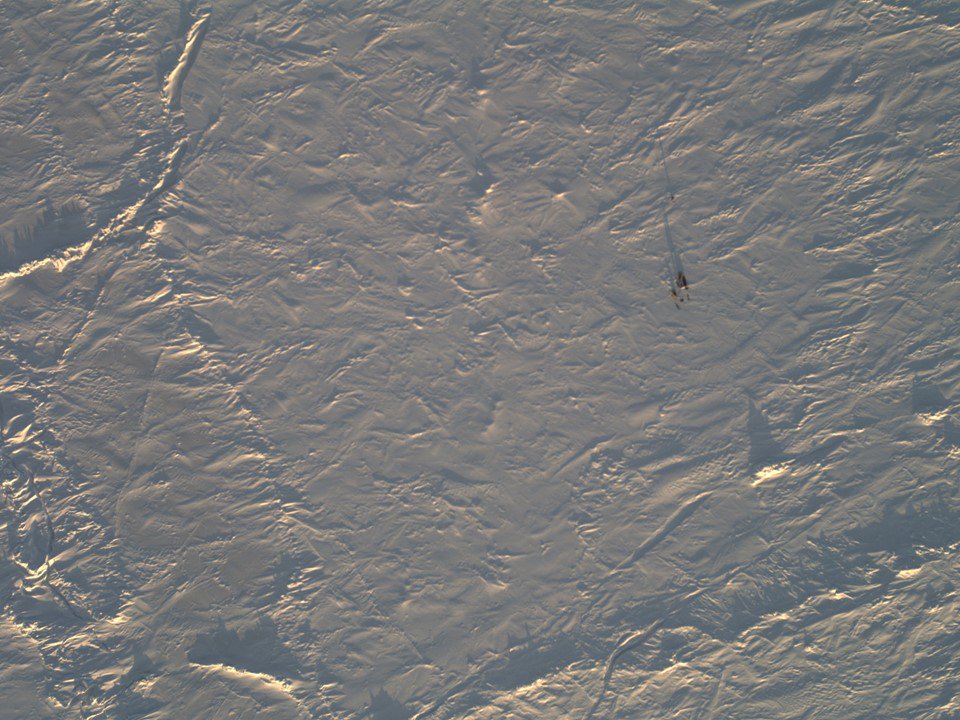
As part of that scientific mission the NASA Operation IceBridge Orion P3 aircraft overflew the team, and amongst other things took this picture:
Bernice announced on the 2 Degrees expedition’s blog this morning that:
A milestone today – skied 1/2 degree of latitude.
Victor Serov who I call into every night with our position is really happy with our progress: ” You are doing very well Bernice and you are doing science” is his encouraging response every time I call in.
I imagine he is sitting in a tent in Barneo with a giant map, North Pole in the middle, and plotting all routes towards the pole. Each team on the ice has to call in coordinates at night so if something happens, they are standby with 2 MI8 helicopters to assist. Like yesterday somebody had to get evacuated because of frostbite.
To get a compliment from a Russian scientist who has spend a year in Vostok in Antarctica [coldest place on earth] as well as being an accomplished polar explorer, we should be proud of ourselves to have skied 1/4 of the way on day 5. But it hasn’t come easy. The half degree has been really hard work temperatures dipped to -41C too cold to film, do science, all we can do is keep moving until we need to eat and drink.
The sleds weigh over 80 kilo’s and new pains and aches show unexpectedly in places you don’t want them, like my back. On the odd break, I would get the notebook out, jot down the GPS position while Ann pokes into the snow and yells the various snow depths to me. The rest of the day we are doing cold management: toes we don’t feel anymore and need nurturing or placing your thumb between the fingers to warm them up inside your mitt, and worse letting your arm hang so the blood can race back to the extremities.
If you are cold all blood flows to your heart and core to protect it, so to call it back is playing a trick with your mind. Despite this careful nursing, I still end up with frost nip on all fingers. I now need to be extra careful with exposure to cold.
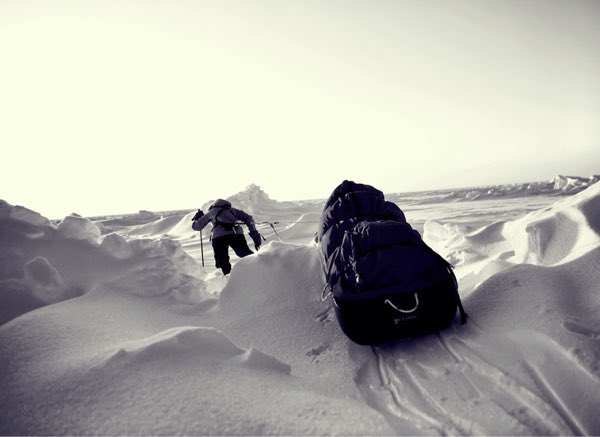
Meanwhile Ann Daniels published this image of the sort of terrain they’ve been crossing on her Twitter feed:
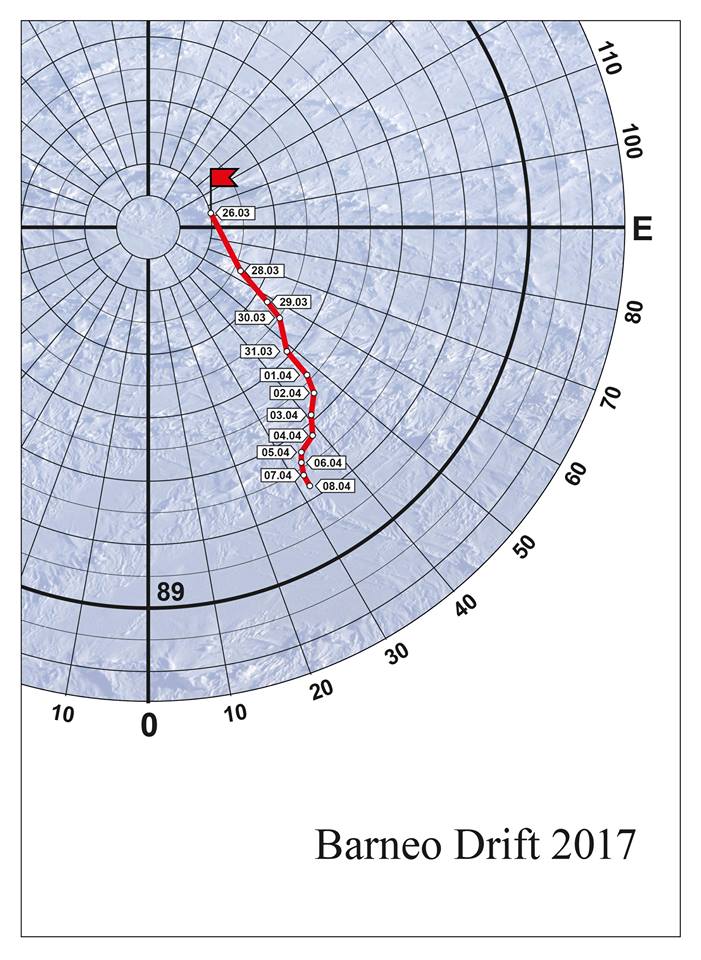
The expedition’s current position is reported as as 88.52 N, 147.75 E. Only another 1 1/2 degrees to go! As this map of the drift of the Barneo ice camp shows, the winds are currently somewhat in the team’s favour:
Every little helps!
“Show me the money !”, um, I mean, “Show me the data !”
Re “the money”, a bit like this you mean?
https://www.opensecrets.org/politicians/industries.php?cycle=Career&cid=N00001811&type=I
Re “the data”, I guess NASA will get the first look? I shall enquire!
Bernice Notenboom reports via Twitter that the team have crossed the 89th parallel:
Ann Daniels reports via Twitter that things are warming up near the North Pole:
http://polarportal.dk/en/havisen-i-arktis/nbsp/sea-ice-temperature/
April 14 ice temps seem, to my woefully inexperienced eye, look concerning. Visually it seems to have changed markedly since I checked a few days ago but given my inexperience I would have to defer to another as to if this was normal behaviour for this time of year or not?
https://forum.arctic-sea-ice.net/index.php?action=dlattach;topic=230.0;attach=44039;image
Considering Espens last post of the relevant graphic on ASIF I may have answered my own question: that being that all this ice temperature stuff as of April 14 is probably not too far from normal behaviour?
What would be your opinion on the matter??
“The data also showed how abrupt the change had been, with the Slims’ flow dropping precipitously from the 26 to 29 May 2016.” ( https://www.theguardian.com/science/2017/apr/17/receding-glacier-causes-immense-canadian-river-to-vanish-in-four-days-climate-change )
>> ‘Melt Pool May’ showing her wares, perhaps?
Now imagine such a “river piracy” occurrence happening in the Himalayan Plateau. The possible impact upon densely populated parts of Asia does not bear thinking about.
I imagine the topography is so much different it probably (like I know, lol) simply couldn’t happen.
???
Which beckons the question: why did this happen? Does journalism just ask questions these days?? Nature abhors a vacuum and what we need is some answers !
Prof Thompson at Ohio State has this to say on the matter…
“I think we could see similar divergence in streams in the Himalayas as well as throughout the Third Pole region, the Andes of Peru, other sites in northern Canada and Alaska”
I’ll have a look through the WG2 part of AR5 to see if anything is specifically mentioned there.
Here I deleted all the ice less than 1.5m thick, leaving only ice >1.5m thick, comparing April 22, 2016 to 2017.
It doesn’t look great.
Comparing other years doesn’t improve the prognosis.
https://forum.arctic-sea-ice.net/index.php/topic,1834.msg110856.html#msg110856
scroll down on that link.
So I wondered if you saw the Crockford article posted on Watts about ‘sea ice thickest ever off Newfoundland’
A real ‘crock’.
I expect my comment won’t appear. Dr Crockford doesn’t like me.
Anthony Watts doesn’t like me, so I won’t even bother trying to comment. However it looks like Dr. Crockford has replied to you Griff!
https://archive.is/dsfp6#selection-3125.0-3139.27
Followed by all the usual suspects spouting all the usual balderdash.
Dear Jim, I’m watching this https://forum.arctic-sea-ice.net/index.php?action=dlattach;topic=119.0;attach=44820;image graph!
What say you?
2012 sticks out… why did it change so violently? Wipneus then goes on to post(from the forum) about the volume difference between 2012 and this year… meaning, supposedly, that we should all batten down I guess!
Should I be scared about now??
Yes,… “..but why do I say that?”, I hear you ask
I am looking for anything really but stagnation catches my eye… The earlier years did show stagnation and yet the graphs did not swing wildly.
The graphs seem to swing more wildly as the time series goes on. I combine this with the fact 2017 is showing signs of stagnation and boom: I reach panic status!
Does that sound fair enough, or not ?
Also, how did people know that 2016 could have spelt the end for the multi year sea ice back in January/February of last year? (Apparently it was the water cooler conversation to end all water cooler conversations and that was in little ol’ Australia!!!)
I think you’re commenting on the wrong thread SML? How about trying here?
https://greatWhiteCon.info/2017/05/facts-about-the-arctic-in-may-2017/#May-4
What do you mean by “stagnation”?