Monthly Archives: April 2017

The 2 Degrees North Pole Expedition

2Dgrees
An experienced team of polar explorers set off on April 4th intending to ski from a latitude of 88° North to 90° North, better known as the North Pole!

According to the expedition’s web site those 2 degrees of latitude are symbolic of the United Nations Framework Convention on Climate Change agreement in Paris to “hold the increase in the global average temperature to well below 2 °C above pre-industrial levels”, and are thus part of the expedition’s name.

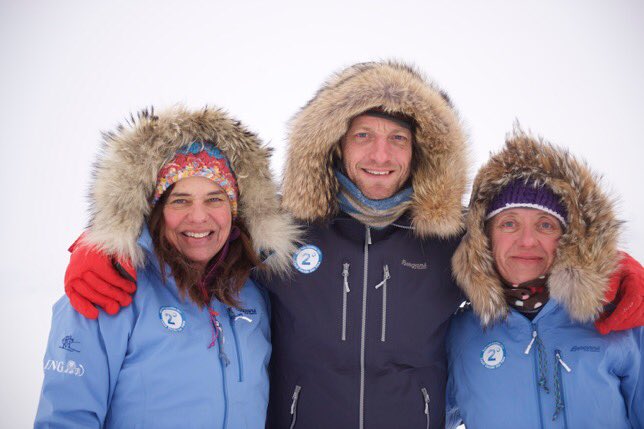
Here’s the team of Bernice Notenboom, Martin Hartley and Ann Daniels pictured shortly before departing on their arduous journey via the Russian Barneo ice camp near the North Pole:

2DgreesTeam

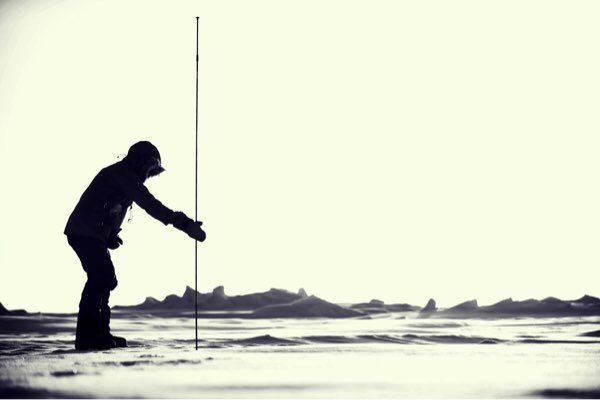
Apart from hauling their sleds across some very challenging terrain they will also be doing lots of “citizen science” en route, including stopping regularly to measure the depth of snow covering the sea ice:

2 Degrees Snow Depth. Photo: Martin Hartley
Photo: Martin Hartley

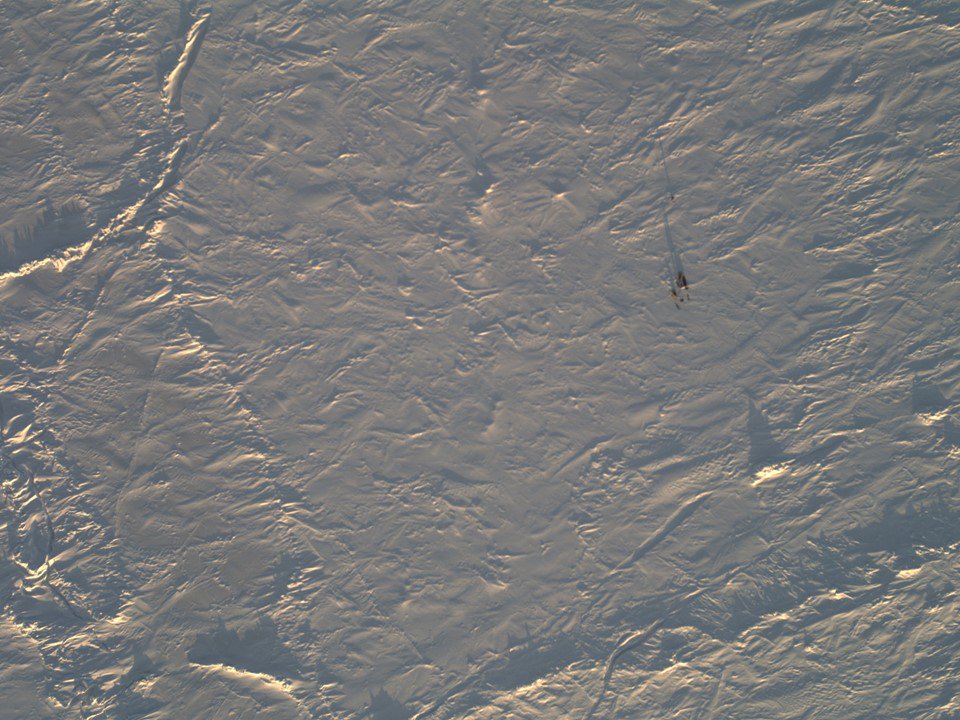
As part of that scientific mission the NASA Operation IceBridge Orion P3 aircraft overflew the team, and amongst other things took this picture:

Photo: NASA
Photo: NASA

Bernice announced on the 2 Degrees expedition’s blog this morning that:

A milestone today – skied 1/2 degree of latitude.

Victor Serov who I call into every night with our position is really happy with our progress: ” You are doing very well Bernice and you are doing science” is his encouraging response every time I call in.

I imagine he is sitting in a tent in Barneo with a giant map, North Pole in the middle, and plotting all routes towards the pole. Each team on the ice has to call in coordinates at night so if something happens, they are standby with 2 MI8 helicopters to assist. Like yesterday somebody had to get evacuated because of frostbite.

To get a compliment from a Russian scientist who has spend a year in Vostok in Antarctica [coldest place on earth] as well as being an accomplished polar explorer, we should be proud of ourselves to have skied 1/4 of the way on day 5. But it hasn’t come easy. The half degree has been really hard work temperatures dipped to -41C too cold to film, do science, all we can do is keep moving until we need to eat and drink.

The sleds weigh over 80 kilo’s and new pains and aches show unexpectedly in places you don’t want them, like my back. On the odd break, I would get the notebook out, jot down the GPS position while Ann pokes into the snow and yells the various snow depths to me. The rest of the day we are doing cold management: toes we don’t feel anymore and need nurturing or placing your thumb between the fingers to warm them up inside your mitt, and worse letting your arm hang so the blood can race back to the extremities.

If you are cold all blood flows to your heart and core to protect it, so to call it back is playing a trick with your mind. Despite this careful nursing, I still end up with frost nip on all fingers. I now need to be extra careful with exposure to cold.

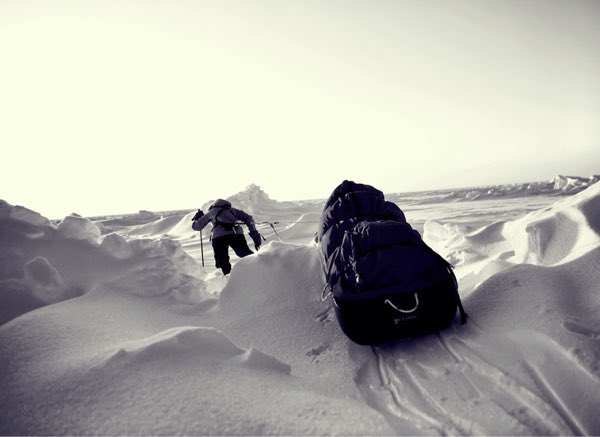
Meanwhile Ann Daniels published this image of the sort of terrain they’ve been crossing on her Twitter feed:

Ann Daniels 20170409 Photo: Martin Hartley
Photo: Martin Hartley

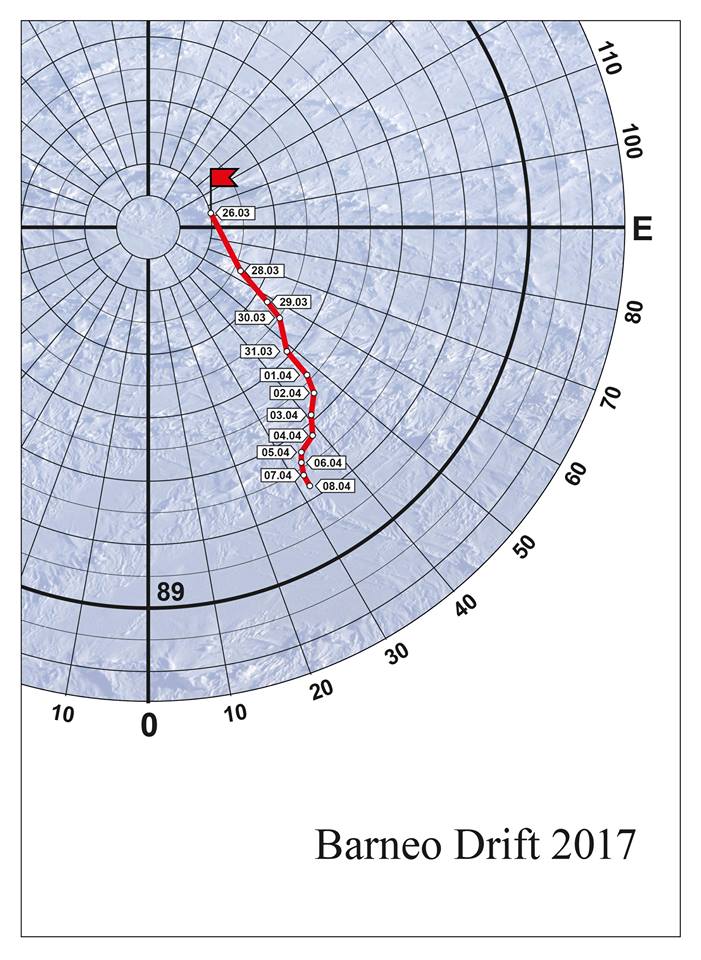
The expedition’s current position is reported as as 88.52 N, 147.75 E. Only another 1 1/2 degrees to go! As this map of the drift of the Barneo ice camp shows, the winds are currently somewhat in the team’s favour:

Barneo-Drift-20170408

Every little helps!

Facts About the Arctic in April 2017

Particularly in view of all the balderdash concerning “climate science” being spouted in Washington DC on Wednesday lets first of all run through some Arctic sea ice facts from April 1st 2017 or thereabouts:

Northern Hemisphere Snow Extent:

multisensor_4km_nh_snow_extent_20170401

Arctic Sea Ice Area:

UH-Arctic-Area-2017-04-01

Arctic Sea Ice Extent:

UH-Arctic-Extent-2017-04-01

Arctic Sea Ice Concentration:

Bremen_AMSR2_20170401

Thin ice map from the University of Bremen SMOS:

SMOS-20170401

Thick ice map from CPOM CryoSat-2

Cryosat_28_20170330

Beaufort Sea ice thickness growth graph:

2017A-2017-03-27

DMI sea ice temperature map:

DMI-icetemp-20170330

DMI atmospheric temperature graph:

DMI-meanT_20170401

DMI Arctic Freezing Degree Days:

DMI-FDD-20170401

PIOMAS volume for March will follow in a few days, but it’s extremely unlikely to be anything other than “lowest for the date”.

What preliminary conclusions can we draw from this plethora of pretty pictures? First of all the Arctic hasn’t suddenly gone into “deep freeze” mode. Temperatures above 80 degrees north are rising again and are well above the climatology. Freezing degree days are still the lowest on record by a wide margin. Northern hemisphere snow cover is falling fast and is currently just above last year.

In contrast to last year, and thanks to lots of cyclones and very little in the way of anticyclones, there’s plenty of sub half meter sea ice in the Laptev and East Siberian Seas and hardly any in the Beaufort Sea. There’s also plenty of thin ice to be seen on both the Atlantic and Pacific peripheries.

The usual southerly arch hasn’t formed in the Nares Strait between Greenland and Ellesmere Island, and as SMOS shows the sea ice in the strait is consequently very thin. That leads one to wonder when the northern arch in the Lincoln Sea might give way.

It’s not immediately apparent from the still images above, but there’s been relatively large amounts of “old ice” exported from the Central Arctic on the Atlantic side, hence the recent increase in overall extent which is now second lowest for the date (since satellite records began). Area has been creeping up as well over recent days, but is still lowest for the date, as it has been for most of the last year. Sea ice “compactness” has decreased somewhat and given all the thin ice around the edges extent will soon start dropping once again.

All in all, the Arctic sea ice prognosis is not good. Are you watching Lamar Smith? (Pun intended!)


[Edit – April 4th]

The March PIOMAS update is out! As suspected, Arctic sea ice volume is still by far the lowest on record:

PIOMAS-Volume-20170331

Volume on March 31st 2017 was 20.398 thousand cubic kilometers. The previous lowest volume for the date was 22.129 thousand km³ in 2011.

Here too is the PIOMAS modelled Arctic sea ice thickness map:

PIOMAS daily gridded thickness for March 31st 2017


[Edit – April 12th]

The latest edition of the NSIDC’s Arctic Sea Ice News confirms that their monthly extent metric for March 2017 was the lowest in the satellite record for the month:

monthly_ice_03_NH_v2.1

As well as highlighting the anomalously warm temperatures across much of the Arctic:

Mar_925t_anom

the NSIDC article includes this telling pressure anomaly map:

Mar_925_slp_anom

There’s also mention of a new paper:

New work by an international team led by Igor Polyakov of the University of Alaska Fairbanks provides strong evidence that Atlantic layer heat is now playing a prominent role in reducing winter ice formation in the Eurasian Basin, which is manifested as more summer ice loss. According to their analysis, the ice loss due to the influence of Atlantic layer heat is comparable in magnitude to the top down forcing by the atmosphere.