“Post-truth” is the the Oxford Dictionaries word of the year for 2016. The definition reads as follows:
post-truth – an adjective defined as ‘relating to or denoting circumstances in which objective facts are less influential in shaping public opinion than appeals to emotion and personal belief’.
and according to Oxford Dictionaries:
The concept of post-truth has been in existence for the past decade, but Oxford Dictionaries has seen a spike in frequency this year in the context of the EU referendum in the United Kingdom and the presidential election in the United States. It has also become associated with a particular noun, in the phrase post-truth politics.
Post-truth has gone from being a peripheral term to being a mainstay in political commentary, now often being used by major publications without the need for clarification or definition in their headlines.
Our old friend David Rose has been remarkably quiet on the topic of Arctic sea ice recently. Presumably the objective facts from the Arctic are impossible to spin to his satisfaction even for a man of David’s talents? However that didn’t stop him from penning an article for The Mail on Sunday at the end of November on the topic of the recent “record highs in global temperatures“:
Global average temperatures over land have plummeted by more than 1C since the middle of this year – their biggest and steepest fall on record.
The news comes amid mounting evidence that the recent run of world record high temperatures is about to end. The fall, revealed by Nasa satellite measurements of the lower atmosphere, has been caused by the end of El Niño – the warming of surface waters in a vast area of the Pacific west of Central America.
The Mail article helpfully included this one year old video from the World Meteorological Organization, explaining the basics of the El Niño phenomenon:
According to the commentary:
This phenomenon affects weather conditions across the equatorial Pacific, with potential knock on effects in other parts of the world.
We’ll get on to the “potential knock on effects” in the Arctic eventually, but let’s start with a snippet of Mr. Rose’s “post-truth politics”:
Some scientists, including Dr Gavin Schmidt, head of Nasa’s climate division, have claimed that the recent highs were mainly the result of long-term global warming.
Last year, Dr Schmidt said 2015 would have been a record hot year even without El Nino. ‘The reason why this is such a warm record year is because of the long-term underlying trend, the cumulative effect of the long-term warming trend of our Earth,’ he said. This was ‘mainly caused’ by the emission of greenhouse gases by humans.
Other experts have also disputed Dr Schmidt’s claims. Professor Judith Curry, of the Georgia Institute of Technology, and president of the Climate Forecast Applications Network, said yesterday: ‘I disagree with Gavin. The record warm years of 2015 and 2016 were primarily caused by the super El Nino.’ The slowdown in warming was, she added, real, and all the evidence suggested that since 1998, the rate of global warming has been much slower than predicted by computer models – about 1C per century.
David Whitehouse, a scientist who works with Lord Lawson’s sceptic Global Warming Policy Foundation, said the massive fall in temperatures following the end of El Nino meant the warming hiatus or slowdown may be coming back. ‘According to the satellites, the late 2016 temperatures are returning to the levels they were at after the 1998 El Nino. The data clearly shows El Nino for what it was – a short-term weather event,’ he said.
In case you’re wondering where the politics is in all of this, you need look no further than here:
.@BreitbartNews: Global Temperatures Plunge. Icy Silence from Climate Alarmists https://t.co/uLUPW4o93V
— Sci,Space,&Tech Cmte (@HouseScience) December 1, 2016
The Twitter account of the United States’ House of Representatives Committee on Science, Space, and Technology quotes a Breitbart article by another old friend of ours, James Delingpole, which quotes David Rose’s article in the Mail on Sunday:
The last three years may eventually come to be seen as the final death rattle of the global warming scare. Thanks [sic] what’s now recognised as an unusually strong El Nino, global temperatures were driven to sufficiently high levels to revive the alarmist narrative – after an unhelpful pause period of nearly 20 years – that the world had got hotter than ever before.
In case you’re also wondering about the objective facts of the matter David Rose quotes with approval “the authoritative Met Office ‘Hadcrut4’ surface record” in his latest article in the Mail on Sunday this very morning:
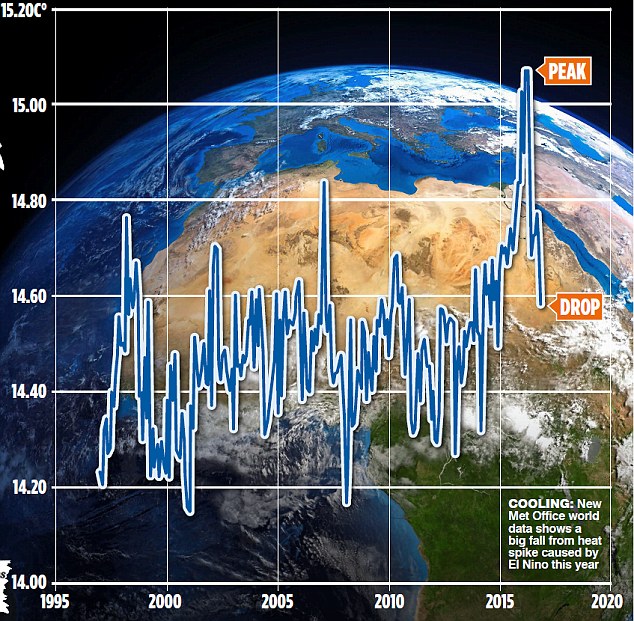
New official data issued by the Met Office confirms that world average temperatures have plummeted since the middle of the year at a faster and steeper rate than at any time in the recent past.
The huge fall follows a report by this newspaper that temperatures had cooled after a record spike. Our story showed that these record high temperatures were triggered by naturally occurring but freak conditions caused by El Nino – and not, as had been previously suggested, by the cumulative effects of man-made global warming.
The Mail on Sunday’s report was picked up around the world and widely attacked by green propagandists as being ‘cherry-picked’ and based on ‘misinformation’. The report was, in fact, based on Nasa satellite measurements of temperatures in the lower atmosphere over land – which tend to show worldwide changes first, because the sea retains heat for longer.
There were claims – now exploded by the Met Office data shown here – that our report was ‘misleading’ and ‘cherry-picked’.
Yet bizarrely, the fiercest criticism was reserved for claims we never made – that there isn’t a long-term warming trend, mainly caused by human emissions.
This just wasn’t in our report – which presumably, critics hadn’t even read.
We’ve explained all this to David before, yet bizzarely we obviously need to do so again. Here’s the Mail’s version of the latest HADCRUT 4 data from the Met Office:
and here’s ours:
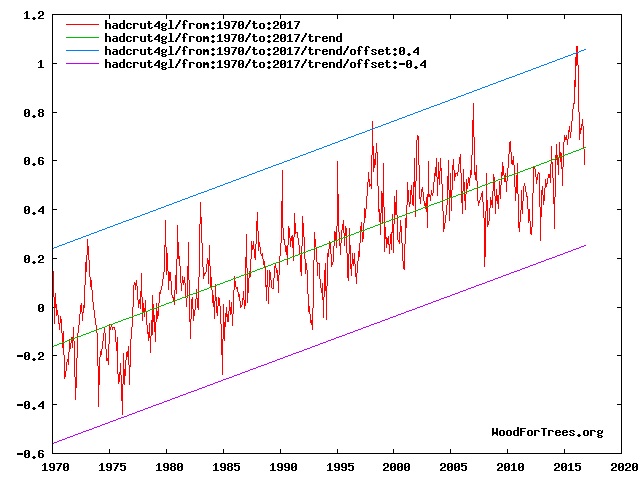
Can you spot any “cumulative effects of man-made global warming”?
Messrs Smith, Rose, Delingpole, Whitehouse et al. may well be unaware of the fact that the satellite temperature data they’re so fond of cherry picking doesn’t include data from the lower troposphere between 80 degrees North and the North Pole. Just in case they fancy spinning the latest objective facts from the Arctic in the near future, here’s the long term autumnal temperature trend:
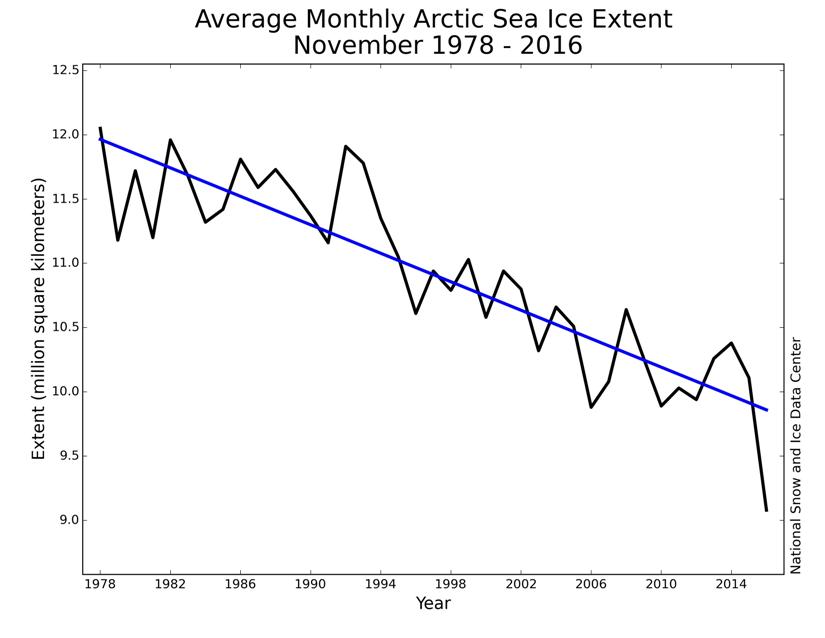
and here’s the long term November Arctic sea ice extent trend:
Who’d have thunk it? Yet another old friend of ours, Anthony Watts, has (slightly belatedly) reproduced part of David Rose’s most recent article. He’s left out the most interesting bit though!
Meanwhile on Twitter David Rose maintains:
With a hat tip to “There’s Physics” here’s a recording of a recent conversation between the aforementioned Messrs Rose and Whitehouse:
It seems David hasn’t taken on board the expert commentary on his original article yet.
The very second it becomes unequivocal that AGW is costing lives, David Rose needs to be hauled to court.
Whilst I sympathise with the sentiment Neven, I do wonder which bit of the Great British justice system might apply in this case.
Environmental crime?
Evidently David Rose is playing the victim card once again, but this time around he’s putting his “lukewarmer” credentials on the table as well. Here’s a transcript of the words that left his lips at 3:45 in the the GWPF video above:
Actually you are “denying” one or two things David. By way of example, you asserted in your first article that:
whereas in your second you stated:
However according to the Australian Government’s Bureau of Meteorology:
The Berkeley Earth land surface temperature numbers for November have just been released:
The 2016 Arctic Report Card has just been released:
Prof. Judy gently admonishes David Rose for not wearing his “lukewarm” heart on his sleeve:
The “Cowtan & Way” Arctic temperature series has now been updated too:
Here’s the “NASA” version of the global average surface temperature “bullish trend”, kindly animated by Izen:
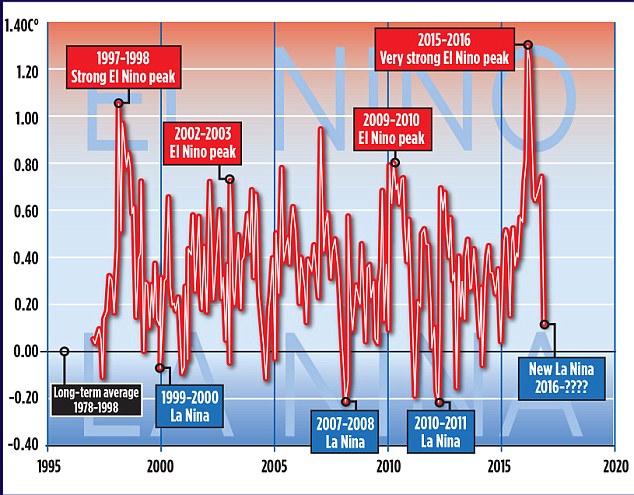
As we all know Jim, ENSO events can, and do, affect global temperatures. No one with half a brain should be particularly surprised these days to find that a large El Nino is accompanied by a record high in global temperatures.
Funny how certain people didn’t seem too keen on mentioning that little matter during the period when 1998 was the hottest year on record. Ah, the rancid stench of hypocrisy.
It would also be interesting to know what metric was used in order to categorise the recent event as “very strong”, whilst rating the 1997/98 event as merely “strong”. I strongly suspect it depends more on narrative imperative, rather than anything so tiresome as objectivity.
Regarding Mr Rose’s comments about the recent El Nino, he makes an assertion about the water being “… up to 3C warmer than usual … “. NOAA work on a rolling 3-month period, and the largest anomaly recorded during the recent event was +2.3C across the Nov 2015 – Jan 2016 window. (The highest individual monthly value was +2.33C recorded in January this year. The highest monthly value during the 1997/98 event was +2.32 in Nov 1997.)
His accompanying statement that this occurs in a “vast area of the Pacific” is certainly true – for a given value of vast. The Nino 3.4 Region occupies an area of fractionally over 6 million sq kms. The Pacific Ocean covers about 165 million sq kms, whilst the surface area of the planet is some 510 millions sq kms.
So, let’s take the El Nino variant out of the equation by looking at “colder” years. The annual anomaly for the “coldest” years in the HadCRUT4 dataset during each of the last 4 and a (large) bit decades read as follows…
1970-79 -0.24C (1976)
1980-89 -0.03C (1985)
1990-99 +0.10C (1992)
2000-09 +0.29C (2000)
2010-16 +0.42C (2011)
There seems to be a pattern there. What could it be caused by? Whatever it is, I don’t think we can lay the blame at the door of El Nino.
But hey, why provide additional data that would help people to make their own minds up? After all, that’s not what he’s there for.
Hello, good evening and welcome once again Bill.
This would appear to have been the professional opinion of Prof. Judith Curry. Quoting Mr. Rose’s first article:
Possibly 97/98 was “super” too I suppose but even so the graph is mislabelled, certainly according to your criteria. The Curry/Rose criteria are a trifle opaque at this juncture!
In case you fancy joining in the fun, I lodged an “official complaint” a couple of days ago:
Only an auto-response to show for my trouble thus far.
Since I posted the above, I’ve just refreshed the NASA Gistemp page and their Global Land Ocean Temperature Index (LOTI) number for November has just appeared.
Here are the 13 hottest November values in the LOTI dataset…
2015 +1.02C
2016 +0.95C
2013 +0.81C
2010 +0.79C
2009 +0.77C
2012 +0.75C
2005 +0.75C
2004 +0.72C
2006 +0.72C
2001 +0.70C
2014 +0.68C
2008 +0.66C
1997 +0.66C
Yep, 2016 is just dropping like a stone.
The graphics from the November GISTEMP announcement:
The Arctic looks rather warm for some reason.
1997 +0.66C
2016 +0.95C
That looks close to 0.14degC/decade on a post ‘Super-El Nino Nov to Nov measure.
I’ve asked Prof. Judy to disclose how she defines “super”.
“No answer!” is the stern reply thus far 🙁
A new day has dawned (UTC).
Over at “Climate Etc.” Ristvan assures me that:
In passing (s)he suggests:
No word from Prof. Judy as yet however.
Prof. Judy is awake!
And has now checked her Twitter notifications:
When comparing the 1997/98 and the 2015/16 events, one could defer to Bob Tisdale’s undoubted objectivity, or one could perhaps listen to what NOAA researchers have to say about the matter.
Now which source would I consider more informed and more reliable? Hmmm, a difficult one, that!
Quoting from NOAA…
“This El Niño was often compared to the 1997/98 event, because the ocean temperatures in the key Niño3.4 region in the Pacific followed a similar progression, and the peak departure from normal in the 3-month-average was the same: 2.3°C (4.1°F) above normal. However, this event differed from that one in a lot of ways, including the impact on United States precipitation during the winter.
For one thing, there was more ocean surface warming in the western Pacific and less warming in the eastern Pacific during 2015/16 than 1997/98. Also, the amount of warm water under the surface was less during 2015/16 than 1997/98. (If you want to compare all kinds of information about the ocean during the two events, you can check out the Ocean Reanalysis Comparison site.) The atmospheric response during 2015/16 was also generally weaker than during 1997/98.
In short, as you’ve heard many times on this blog, no two El Niños are alike.
Why am I reviewing all this? Because we don’t expect the rest of 2016 to look exactly like 1998 did, either, even though ocean temperatures in the Niño3.4 region have followed a very similar decline. Just looking at one number (the Niño3.4 index) can give an incomplete picture of the evolution of ENSO events. Even though our forecasts are projections for Niño3.4 ocean temperatures, forecasters take a number of current conditions into consideration. In other words, if La Niña develops this fall, don’t expect it to develop just like the one following the 1997/98 event.”
The complete article can be seen at…
https://www.climate.gov/news-features/blogs/enso/june-enso-discussion-new-neutral
I think this recent spate of denial from the Daily Fail is probably due to the outcome of the US presidential election, and the subsequent comments by Bob Walker about NASA:
https://www.theguardian.com/environment/2016/nov/22/nasa-earth-donald-trump-eliminate-climate-change-research
I think Whitehouse and Rose are attempting, not terribly successfully it has to be said, to fling mud at Schmidt from across the Atlantic, in the hope that some, at least in the eyes of the incoming US administration, will
stick. The fact that the British readership of the Fail gets badly misled is somewhat irrelevant to the game they’re playing.
I have this strange sense of Déjà vu Phil!
As I may have mentioned elsewhere previously, in an earnest conversation with David Rose’s managing editor earlier today I was at least mildly surprised to discover that:
Hence said editor has only just become au fait with the learned commentary available at:
I have foolishly promised:
Suggestions on a postcard please to yours truly by Boxing Day. For additional background on how the IPSO game is played see for example:
https://greatWhiteCon.info/2015/02/a-letter-to-the-editor-of-the-sunday-telegraph/#Feb20