According to “Steve Goddard” it is! Hot off the presses over at “Real Science” we are told that:
DMI hasn’t updated their 30% concentration map for 10 days, but their 15% concentration map is just about at the 1979-2000 mean.
Ocean and Ice Services | Danmarks Meteorologiske Institut
The melt season has essentially stopped, with very cold air across the Beaufort Sea
[Image redacted – It shows Canada and one corner of the Beaufort Sea]
The usual criminals in the press (Guardian, New York Times, etc.) and government agencies will of course not mention this, because reality and science wrecks their agenda.
I have to admit Steve’s confusing language confused me briefly. The Arctic sea ice concentration and ice type maps from the OSISAF on which the Danish Meteorological Institute base their extent graphs have been updating normally, but I eventually discovered what “Steve”/Tony was on about. On close inspection although the date at the bottom has been updating the 2015 curve on DMI’s 30% threshold Arctic sea ice extent graph currently seems to be stuck on August 2nd:
I’ve informed DMI of the problem, but when it might be fixed remains to be seen, since as the DMI web site puts it:
The old plot can still be viewed here for a while.
and as I was just informed they don’t have any resources allocated to keep the “deprecated” 30% service running.
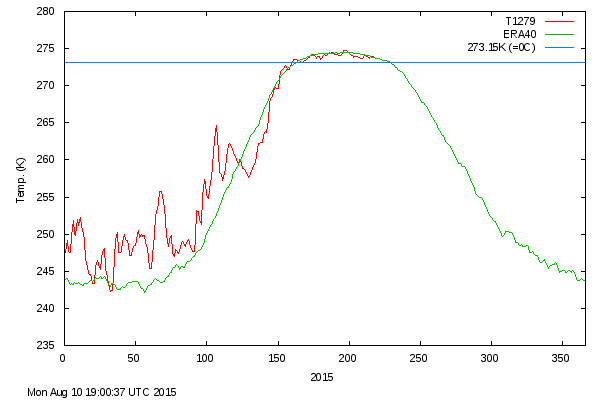
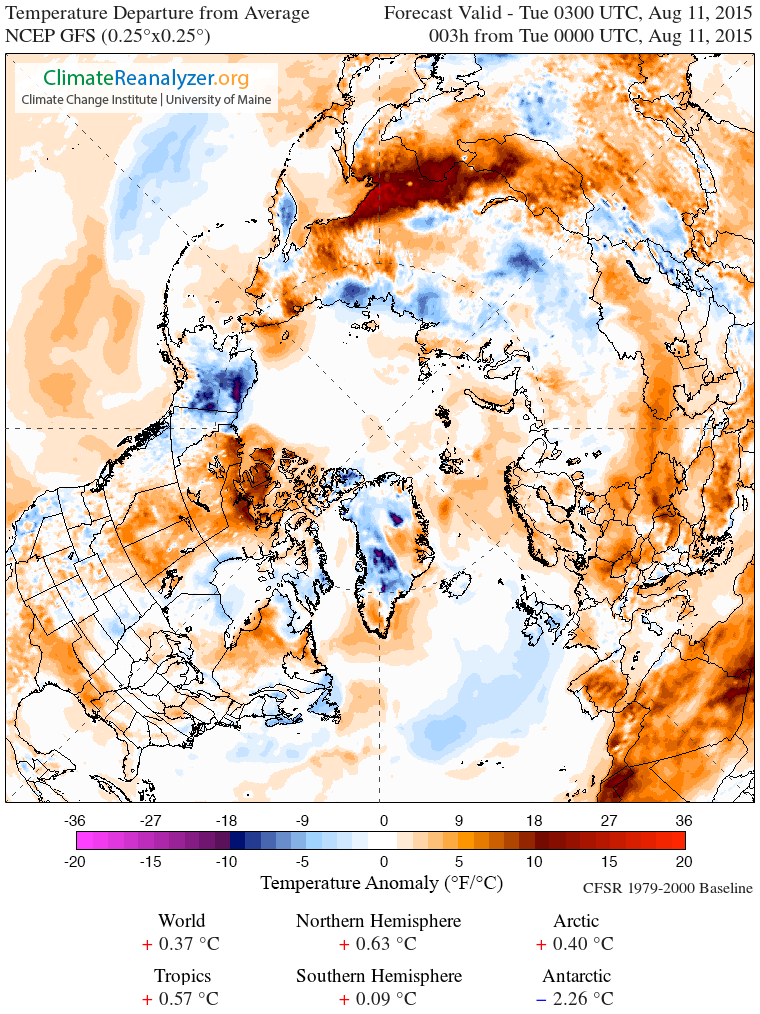
Meanwhile back in real world in the Arctic, DMI temperatures north of 80 degrees are above “normal”:
GFS temperature anomalies look like this:
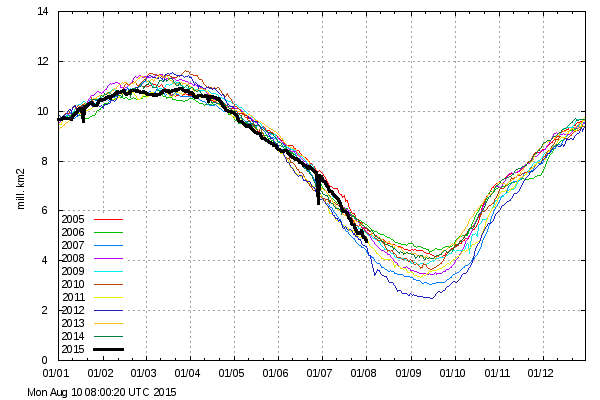
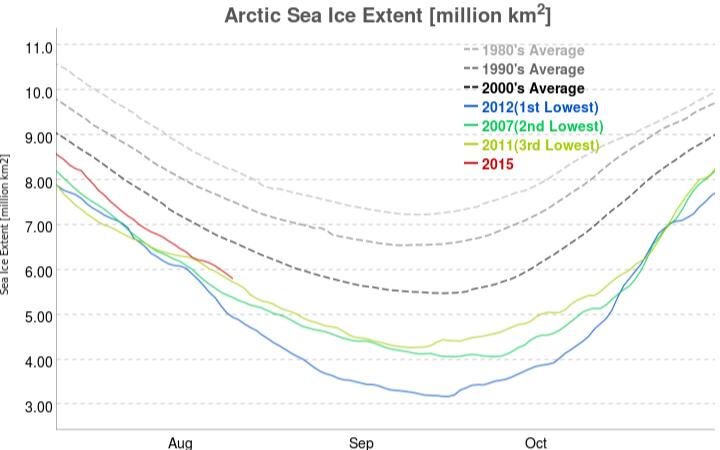
and JAXA 15% threshold Arctic sea ice extent has been dropping at nearly 100,000 km² per day for the last few days:
DMI have now fixed the problem with their 30% threshold metric. Here’s the result:
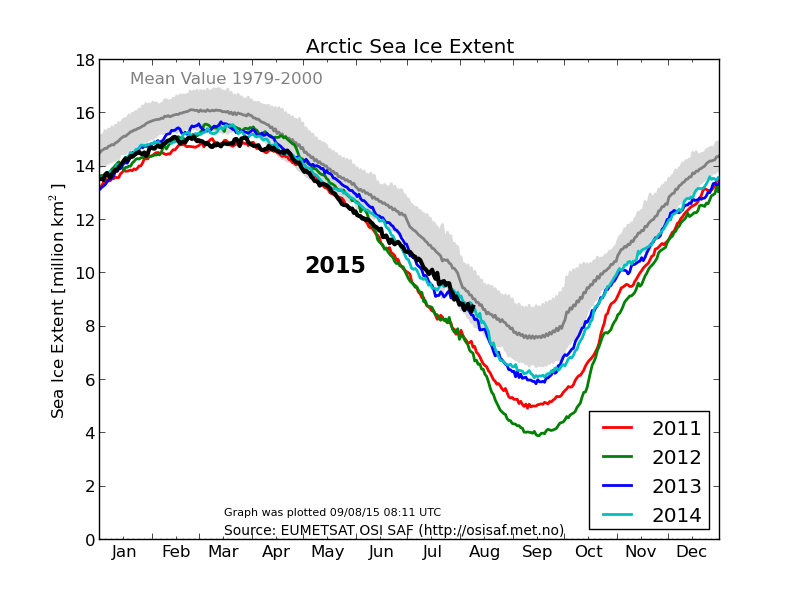
It still looks to me as though it’s tracking 2011 rather than 2006 at the moment!
if you look at the actual plot as opposed to the one you have generated it looks like it is tracking 2008 jim http://ocean.dmi.dk/arctic/old_icecover.uk.php
True, but if you follow my link you’ll note that at the end of May I was suggesting that 2011 was a more appropriate comparison than Steve/Tony’s 2006, and that Big Joe Bastardi’s forecast of zero anomaly by August was “loony”. The recent evidence bears that out, but I haven’t noticed Messrs Heller and/or Bastardi bringing that fact to the attention of their loyal readers!
there seem to be an unusual amount of problems with the various sea ice monitoring groups this year jim, anyone know why ? maybe problems with one or two satellites used by them all ?
i am waiting to hear back from dmi in relation to the delay on the 15% chart,and before t centred it appeared to have a lag of around just over 1 week,suggesting there was more work than usual involved in getting the numbers right.
nice to see peter ellis,chris reynolds and neven add some level headed comments to calm down the more enthusiastic posters on the asif.
by the way, i think your animated melt graphics and colours are spot on. any slower or less contrast and t would be harder to watch. i think if you had a poll on that most would agree.
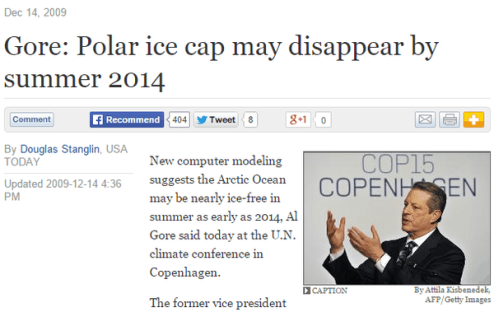
i notice jai mitchell on the asif believes we will have an ice free arctic within the next 4 years jim. let him know i am willing to have a bet with him on that 😉
sea ice sailor answered a question in relation to why there is such a big difference in extent charts between the nsidc and dmi . let him know dmi is a superior product in terms of being able to detect sea ice in all conditions.
the nsidc still has the glaringly obvious (to anyone that is not blind) problem of showing no ice in regions of the hudson that have well over 100k km2 . if they keep going with this, any credibility they had outside of government circles is going to go right down the pan.
You’re starting to sound a lot like “Steve Goddard” Chilly! Perhaps you can answer a question that he refuses to? What do you make of the DMI’s volume graph, which currently shows 2015 “tracking 2011”?
The NSIDC also produce the MASIE product which currently shows ice in Hudson Bay, together with ice along the southern route through the Northwest Passage which a variety of small vessels currently seem to be happily sailing through:
https://greatWhiteCon.info/2015/08/is-the-northwest-passage-open-yet/
Any thoughts on that?
yep, it is a relatively new product so will need a training period to even get close to any visible trend jim. i am not sold on any of the volume metrics displayed by the various groups, the transition from 2012 to 2013 convinced me of that .
i recently heard that over the period on increasing summer melt that various organisations including nsidc have made alterations to the various algorithms they use for calculating area . i do not know if dmi have done also.
do you know if there is any literature documenting this jim ?
Well, there’s this general overview of sea ice concentration algorithms, with lots of links to follow:
https://climatedataguide.ucar.edu/climate-data/sea-ice-concentration-data-overview-comparison-table-and-graphs
Is that the sort of thing you’re after? Regarding the NSIDC sea ice index specifically, a theoretical advantage is that they’ve been using the same algorithm on data from similar instruments for an extended period of time. There’s vast amounts of documentation, including changes, available at:
http://nsidc.org/data/docs/noaa/g02135_seaice_index/
thanks for that jim, i will have a proper read of it tomorrow. i sent a query to the nsidc tonight to ask what the difference is in the way the calculate extent compared to the dmi , but looking at it i take it the nsidc mask out the coastal zones to avoid the issues with snow covered land masses ?
looking again i may have got that wrong,as winter extent is similar in both dmi and nsidc 15 % charts. maybe the nsidc only use the masking technique in summer ? off to read the link you kindly provided,maybe that will shed light n the matter.
bc
As a rule, I do not bet money with people that I do not know and trust.
In any regard, you seem to be a bit of a denier troll? While I would love to take your money I have serious reservations with regard to ANY interactions with those types.
can you definitively state your position on the existence of and cause of global climate change?
Finally, while I state that I “expect” a < 1,000,000 KM^2 NSIDC extent to occur around 2019 this is the near term estimate, for me to bet a significant sum of money, I would need further assurance to my expectation. The extreme variability of sea ice loss and its dependence on multiple cascading climate impacts, such as the extreme negative Pacific North American index in 2013-2014 shows considerable potential for increased variability as the climate warms.
That being said, I am certain that the reduction of sulfate aerosol emissions from southeast asia will bring considerable effect over the next 4 years. So,
pending your status of NOT being a climate denier troll, what type of non monetary bet would you be willing to make?
Jai,
Chilly has recently stated that:
https://greatWhiteCon.info/2015/07/arctic-sea-ice-volume-for-dummies/#comment-211011
Please could you avoid the gratuitous labels and stick to the science from now on? Personally I’m with you on “the extreme variability of sea ice loss and its dependence on multiple cascading climate impacts”.
Hence I reckon ShelterBox’s £1000 by 2022 is safe. However Chilly disagrees, and so does Chris Reynolds.
how nice, someone i do not even know calling me a denier troll ,deary me. the one thing that peter wadhams does get my ultimate respect for is having the courage to stick to his principles . whether he is right or wrong, he comes across as sincere and honest.
i have the same respect for jim hunt,and while we do have some friendly banter i have yet to see jim insult anyone. even when he posts on tony hellers blog he never stoops to the insults and name calling others (including myself) have .
another blogger, caleb on sunrise,s swansong also maintains a level headed calm attitude in discussions and this shows in the posts on his blog. i have decided to take a lesson from both jim and caleb and try and stay away from insults and insinuations myself.
the terms of the bet i have with jim are for sub 1 million km2 for ct area. the lowest metric there is . i think that is fair . that is the bet. if you do not like those terms ,do not take the bet.
some nteresting observations from the o bouys by caleb jim. https://sunriseswansong.wordpress.com/2015/08/15/amazing-stupid-sea-ice-picture/#comments
that sure does not look like the heat filled beaufort described on the asif at the moment jim. i am a bit shocked by this in that area in august. especially given conditions actually look good for promoting melt (apart from the high albedo fresh snow)
[Moved from the Northwest Passage post – Jim]
I’m afraid I’m not as convinced as you appear to be about Caleb’s impartiality Chilly.
In fact he’s in my little black book of those that shall be archived, since as far as I am aware he has yet to permit a single one of my always polite and helpful comments out of his moderation queue.
As you are no doubt aware I keep an archive of O-Buoy 12 images. Here’s one I recorded on August 13th:
and here’s one from earlier today:
Would you care to play “spot the difference” with me?
See what I mean about Caleb’s partiality? Compare:
https://archive.is/5s2Kz#selection-615.0-625.5
with:
Meanwhile, here’s the latest snapshot from O-Buoy 12 in the Central Arctic:
i dont know about spot the difference jim, it sure looks cold up there though 🙂
There’s no need to speculate on the basis of appearances Chilly. O-Buoy 12 reports air temperature:
and the until recently co-located ice mass balance buoy 2014G is still reporting water temperature:
Meanwhile my helpful comment is still invisible over at Caleb’s. Perhaps you could do me a favour and ask him to release it from purgatory?
i will ask him today jim .
My by now ancient comment still tells me it “is awaiting moderation.”
I note you report over there that “I just received a reply from the NSIDC” and “The sensor on the satellite NSIDC use cannot even see ice at night, or through clouds”. Can you elaborate? What exactly did the NSIDC tell you?
I ask in part because DMI say that they derive their data from “SSMIS (DMSP F17)”
http://osisaf.met.no/p/ice/
and so do the NSIDC:
https://nsidc.org/data/docs/noaa/g02135_seaice_index/
See also the NSIDC sea ice FAQ:
http://nsidc.org/arcticseaicenews/faq/#data_sea_ice_index
You have yet to answer my question:
can you definitively state your position on the existence of and cause of global climate change?
With regard to labels i.e. “denier” I think it comical that the anti-science community, heavily funded and operated by anonymous donor groups funded by the fossil fuel industry, want desperately to cling to a propagandist model and protect the utter, desperate, pathetic, callous and even (in some cases where the individual actually knows the science but would rather make more money) sociopathic agenda.
we have already locked in +2.3C of warming by 2100 (from pre-industrial) at 400ppmv.
This will lock in the early mortality of 2 billion human beings. Calling people out for their anti-science and anti-human positions for the sake of congeniality is like shaking the hand of someone trying to burn down your house.
wow ! i think i will leave it at that jai. this is a nice blog ,i would like to see it stay that way,as i am sure jim would.
interesting to see some posters on the asif quoting the (new) dmi volume chart ,yet nary a mention of the dmi extent chart .would you hazard a guess at the reason for that jim ?
[Moved from 2015 NW Passage thread – Jim]
From a technical perspective the DMI extent numbers have thus far proved impossible to replicate
lets clear one ting up jim, none, and i mean none of the volume metrics have any degree of accuracy. in some areas they will over estimate others under estimate volume.
even the extent charts are not so great as can be seen by the asif going into a frenzy today claiming there has been two days running of over 100 k ice melt. there has not . what has happened is there has been two days of scattered ice being compacted by wind ,coupled with similar melt rates to the past week.
that is why neven thinks his capie chart is going crazy when all it is doing is showing the compaction.
i agree, it is a new product (relatively) and as none of the other mature products display any degree of accuracy ,i do not expect the dmi product to be any better over time.
as with all modeling exercises ,good or bad, they still provide learning opportunities for the scientists carrying them out.
i forgot to add jim, i know you are a wave guy (me too, but for a different activity ) so it would be worth reading up on the problems all the satellites have detecting ice in waves.
it will be interesting to see if there are any corrections to charts made when the sea calms down ,particularly to espens ijis charts ,which depict something unphysical to my untrained eyes.
[Moved from 2015 NW Passage thread – Jim]
Time will tell, as it always does. For the moment though “Espen’s IJIS chart” of extent is currently still vying with 2007 for 2nd place:
As mentioned above, the IJIS/ADS Arctic sea ice extent is now tracking 2007.
Meanwhile “Steve Goddard”/Tony Heller’s favourite DMI 30% threshold metric is currently below 2011 and rapidly heading towards 2007 levels:
For some strange reason his most recent Arctic forecast makes no mention of this shock news!
Pull the other one Tony. It’s got bells on.
you have to give tony some credit jim, he was only one year out for the year the ice loss would track earlier in the season !