In my humble opinion summer in the Arctic summer starts on June 1st, so let’s check the current sea ice situation in the once frozen North. For details of the preconditioning of the ice during the Arctic spring see “Melt Pond May“, where I concluded that:
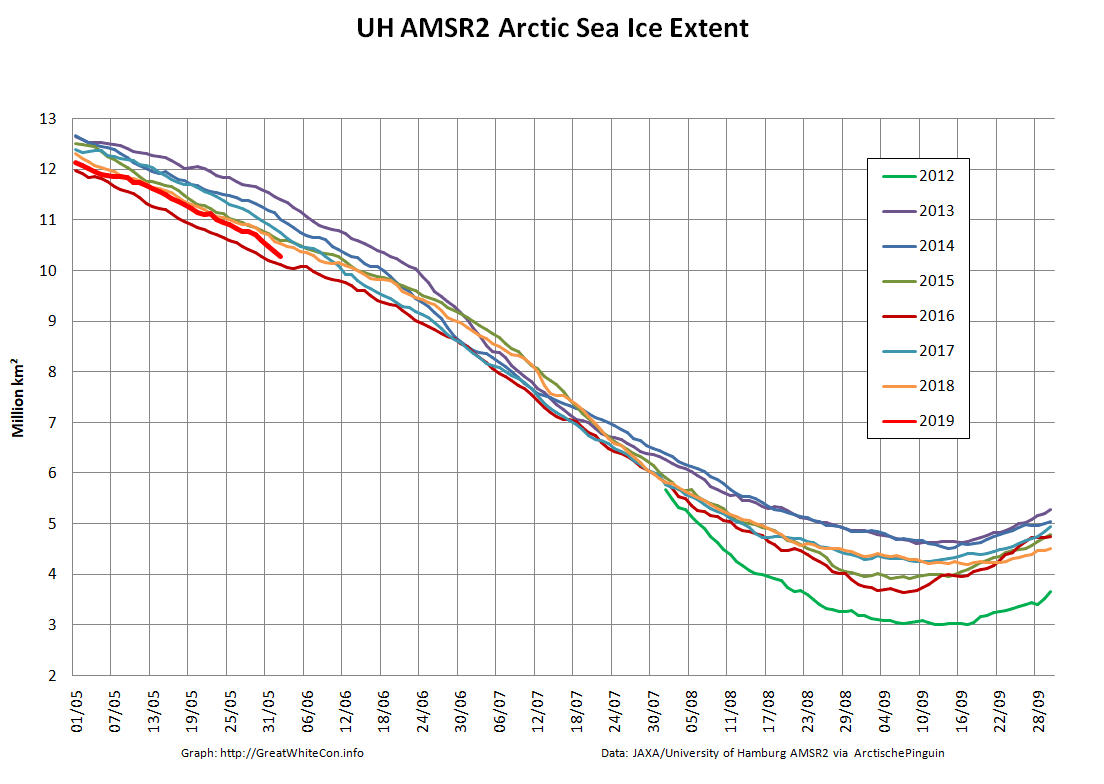
Compared with 2016 at the same time of year I am compelled to say that with June 1st just around the corner the 2019 summer melting season is primed to progress more quickly.
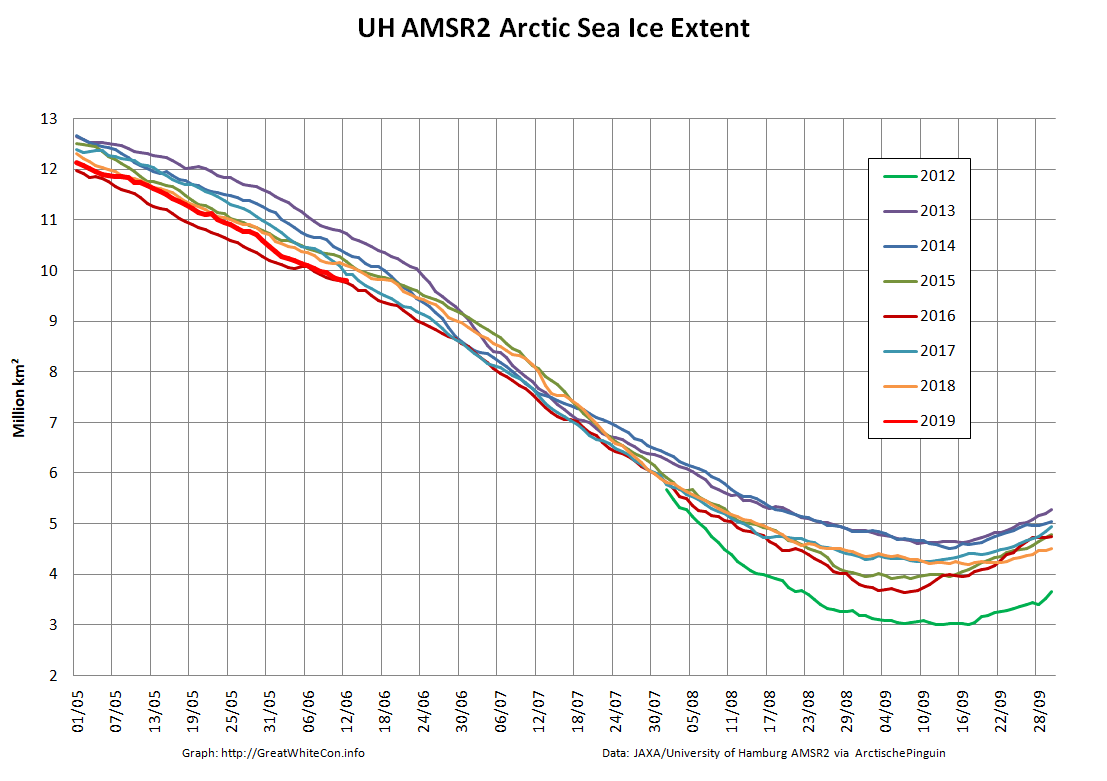
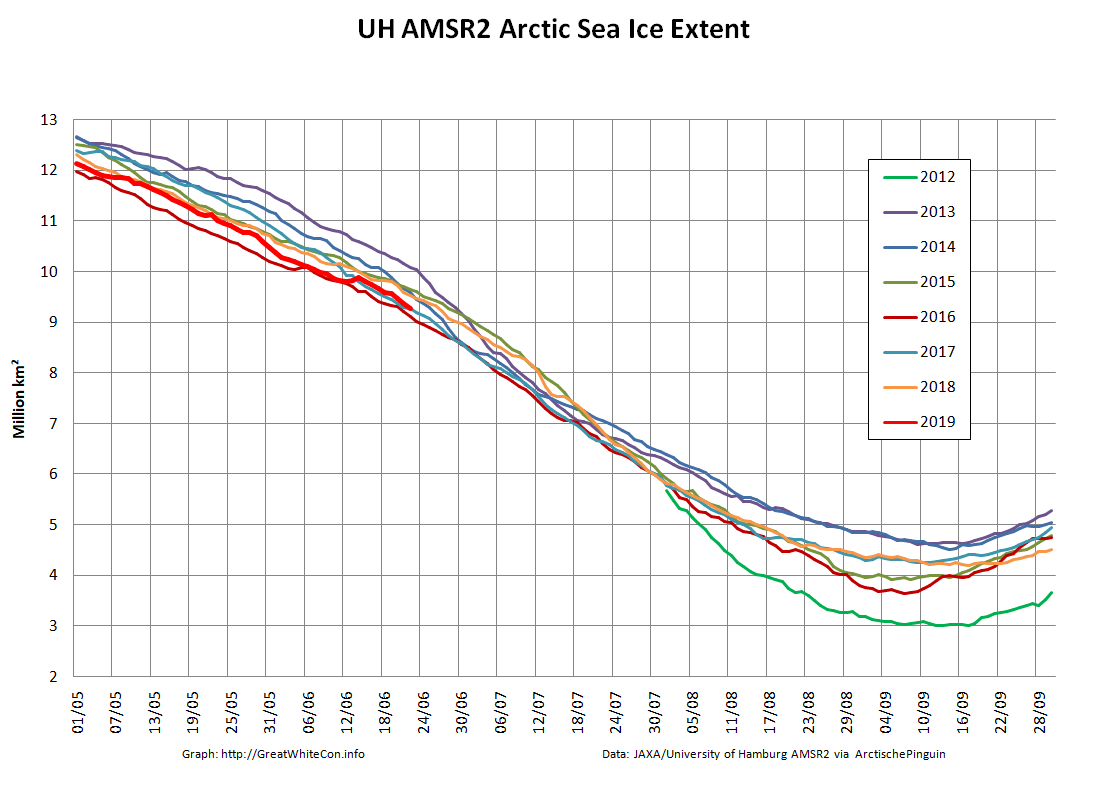
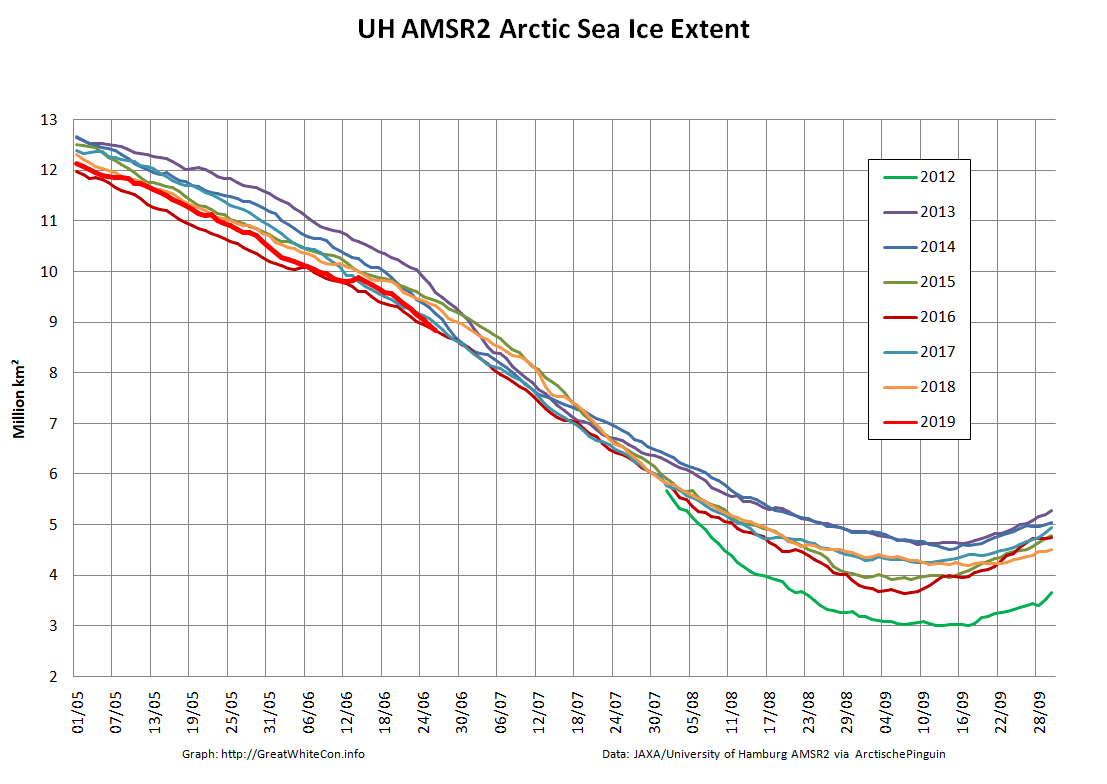
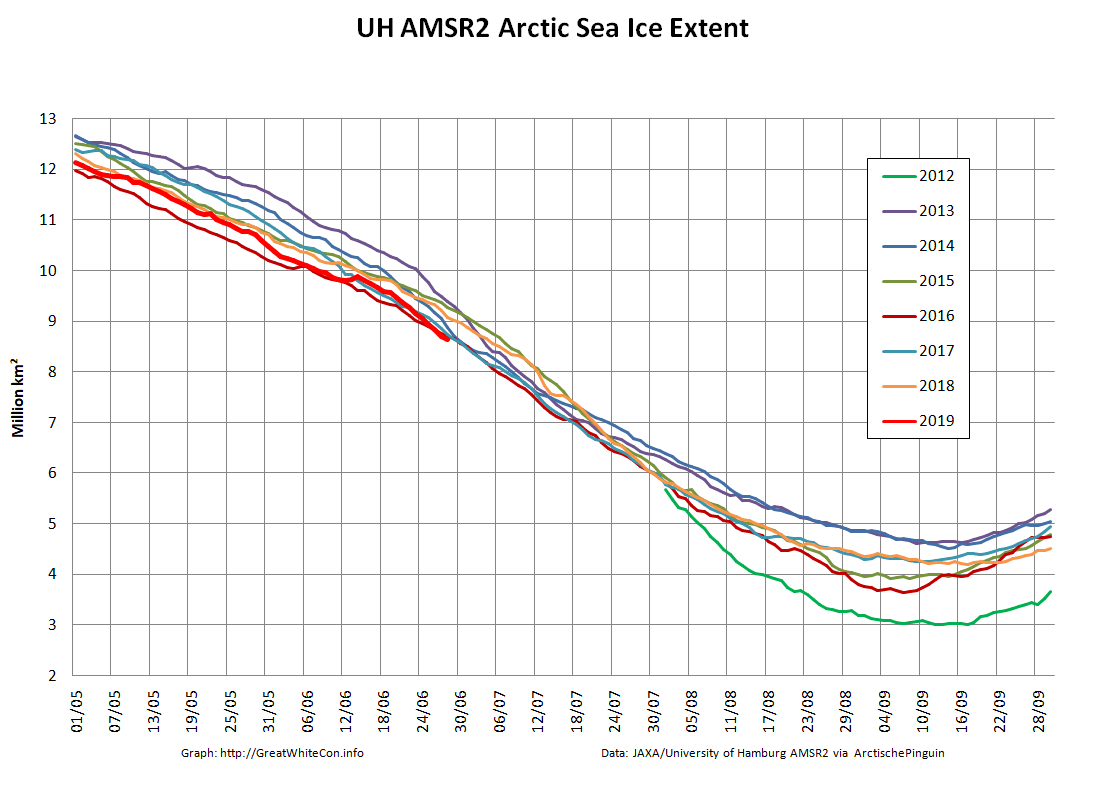
Currently extent is significantly below 2012, albeit somewhat above 2016 at the same time of year. And what of melt ponds? In 2012 there was evidence of less snow cover over land and more surface water on the ice on the Siberian side of the Arctic. Other than that Arctic sea ice in 2019 looks to be in worse shape than in 2012.
And how have things progressed over the last few days? Take a look at this:

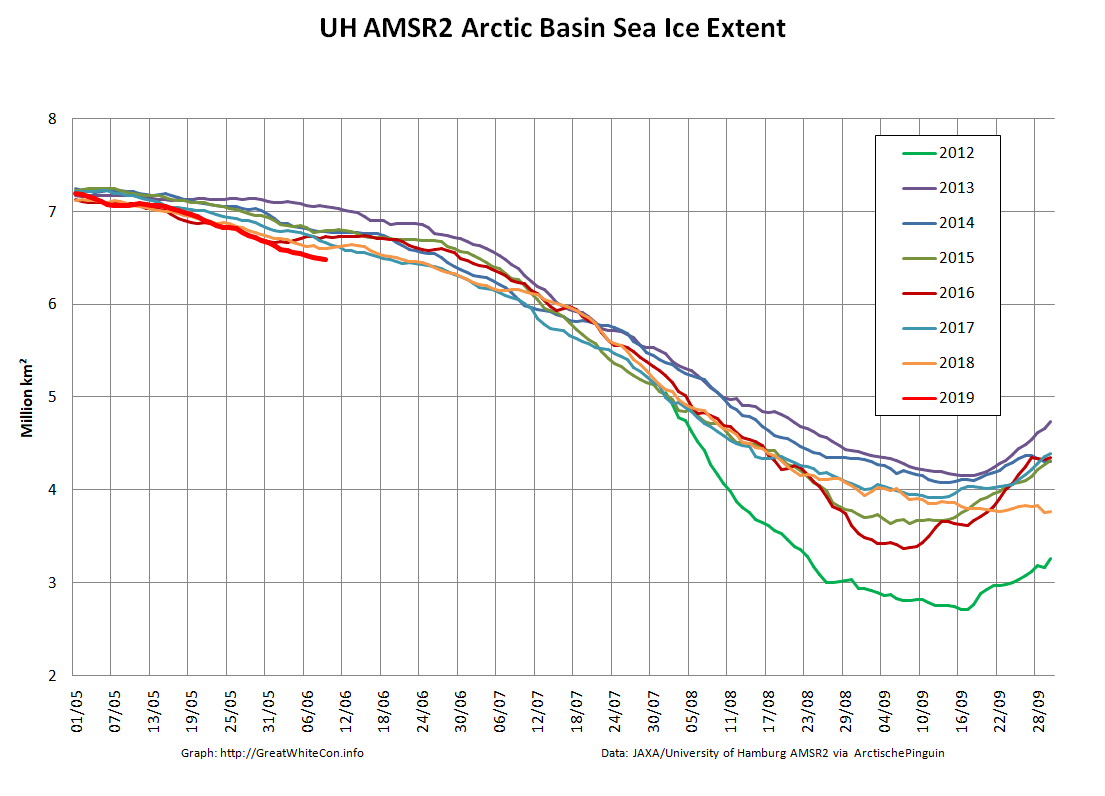
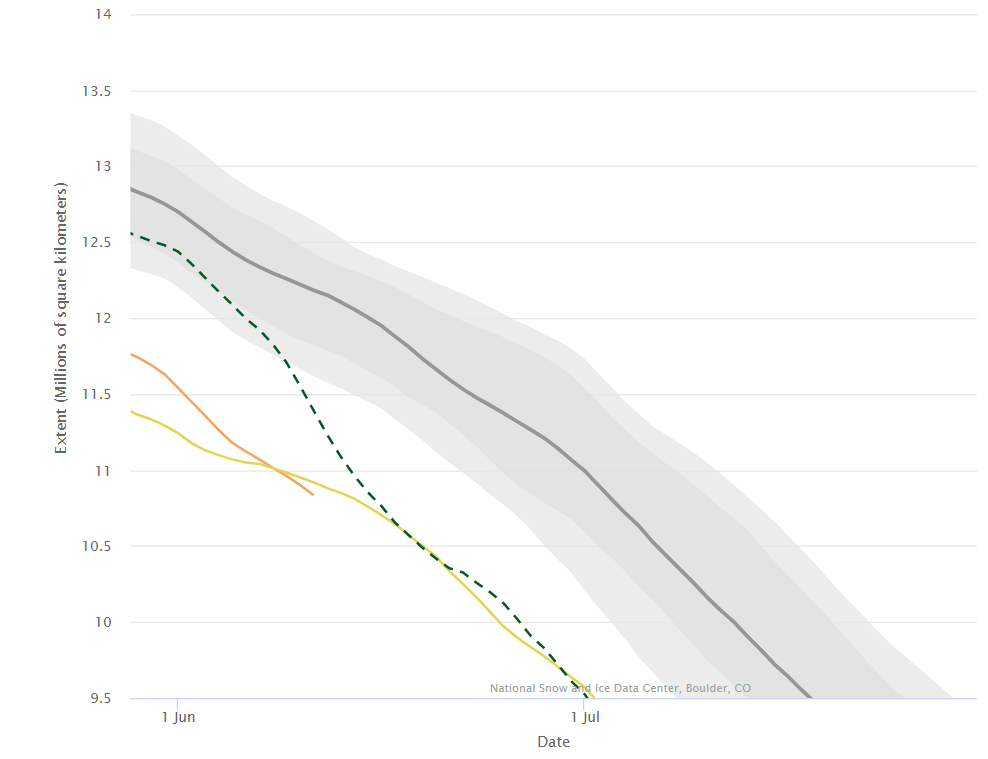
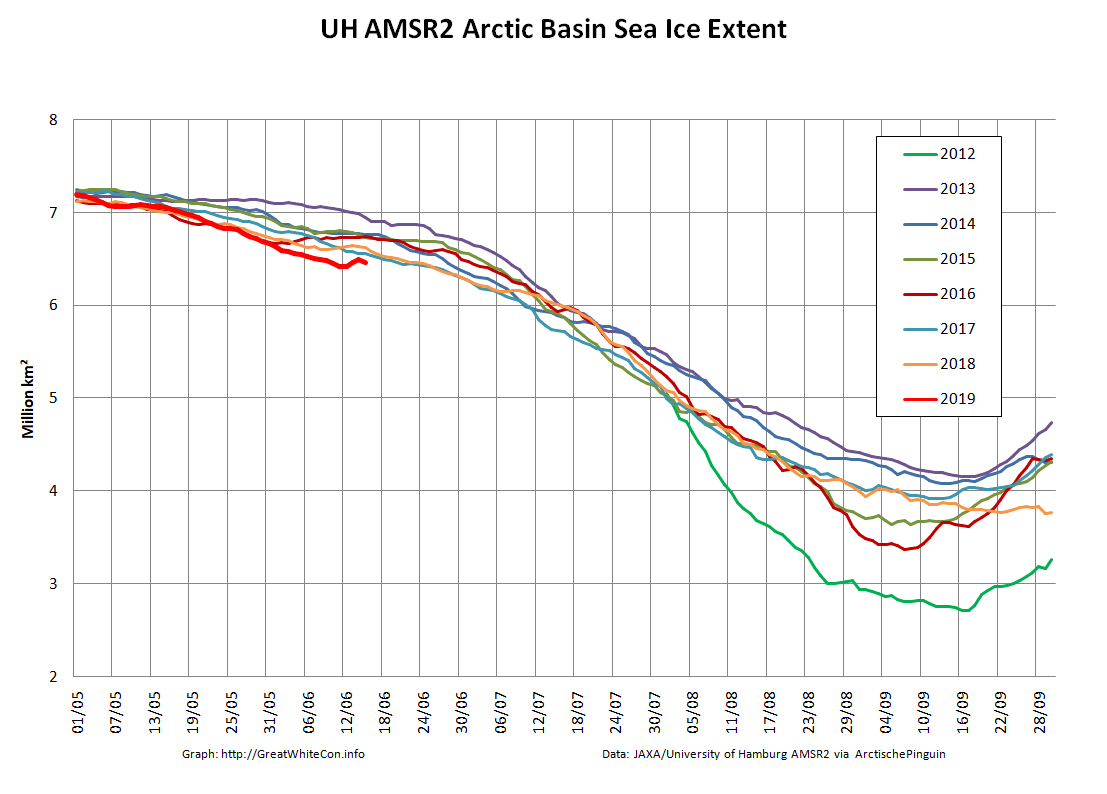
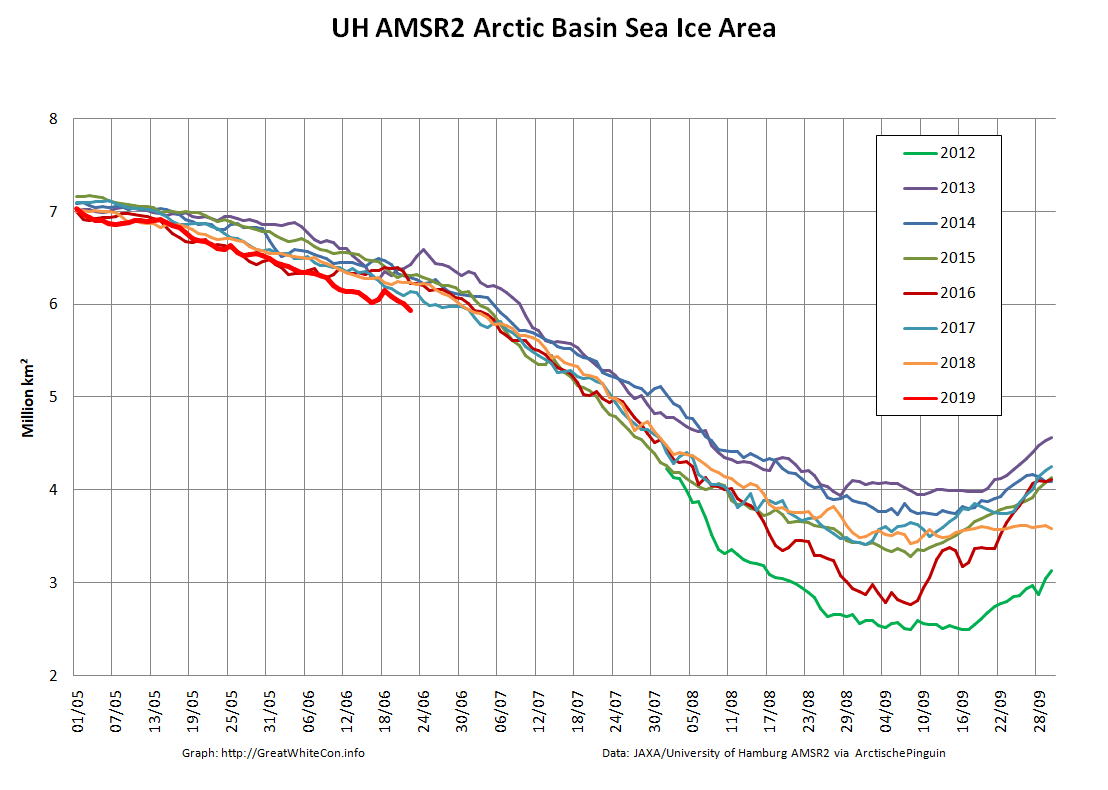
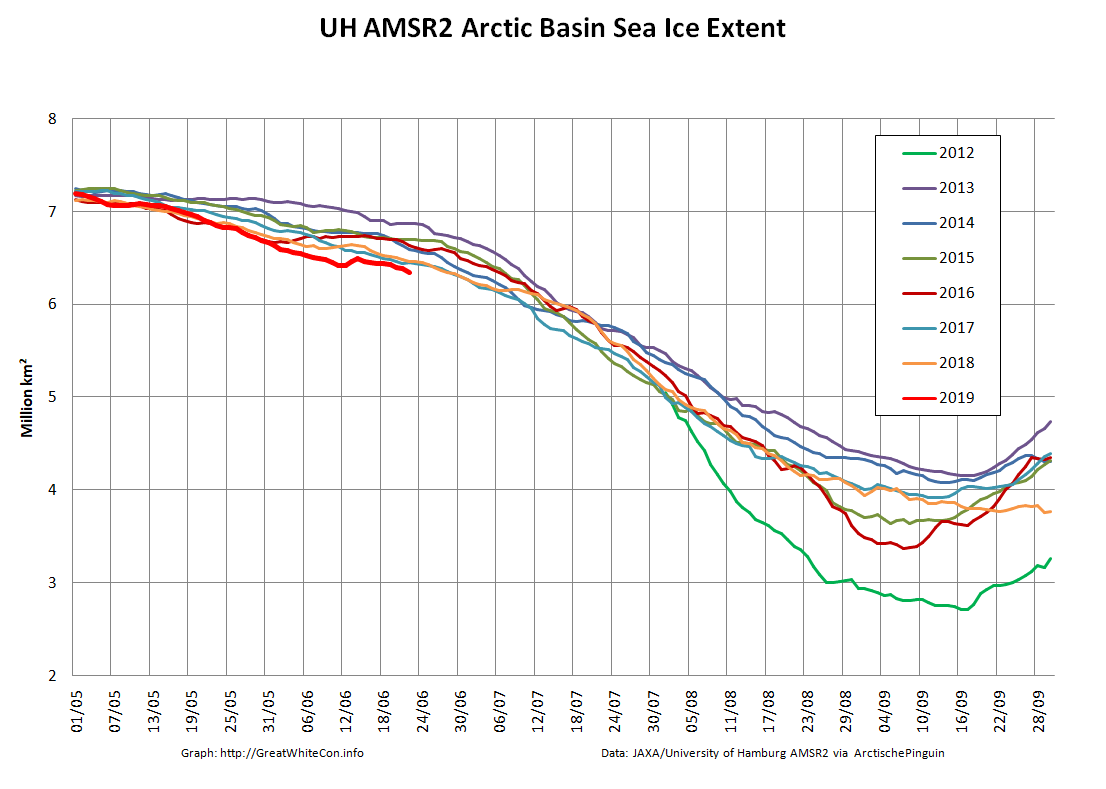
Our “Arctic Basin” metric encompasses the Central Arctic plus the Beaufort, Chukchi, East Siberian and Laptev Seas. It is currently headed into uncharted waters. The effect on overall Arctic sea ice extent is also readily visible:
This year both the CPOM version of CryoSat-2 thickness and the University of Bremen’s SMOS thickness maps are continuing to be published during the melting season:
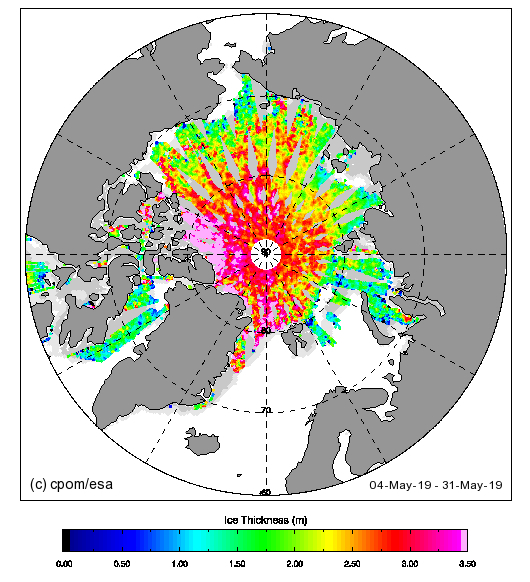
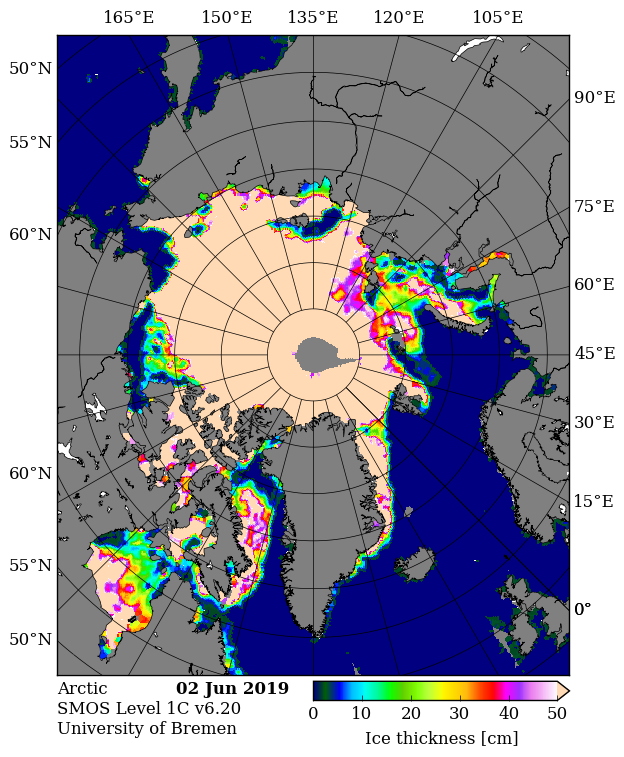
Take them with a large pinch of salt at this time of year!
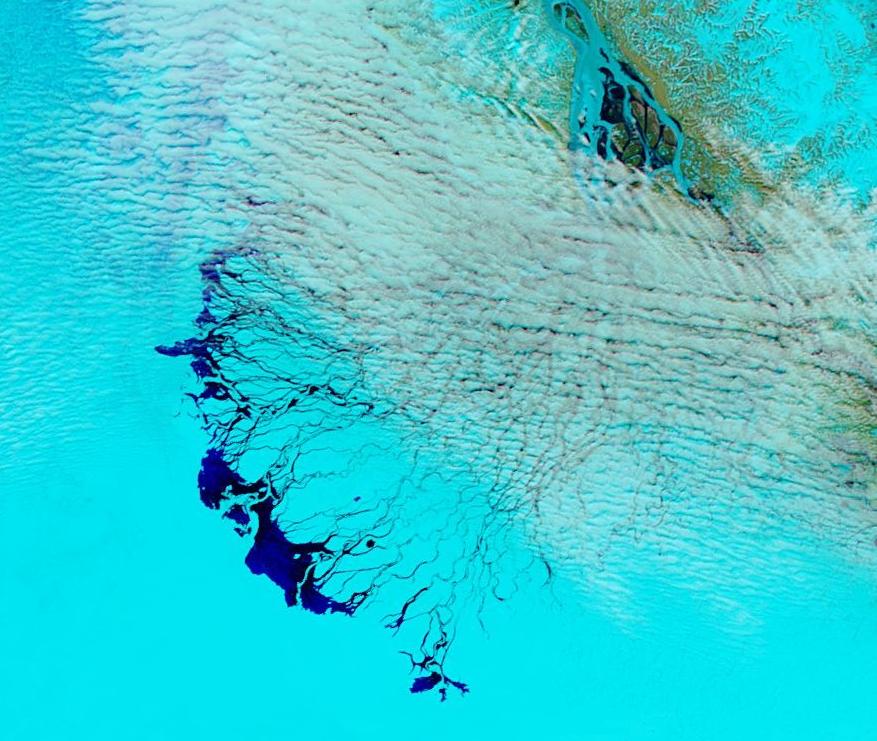
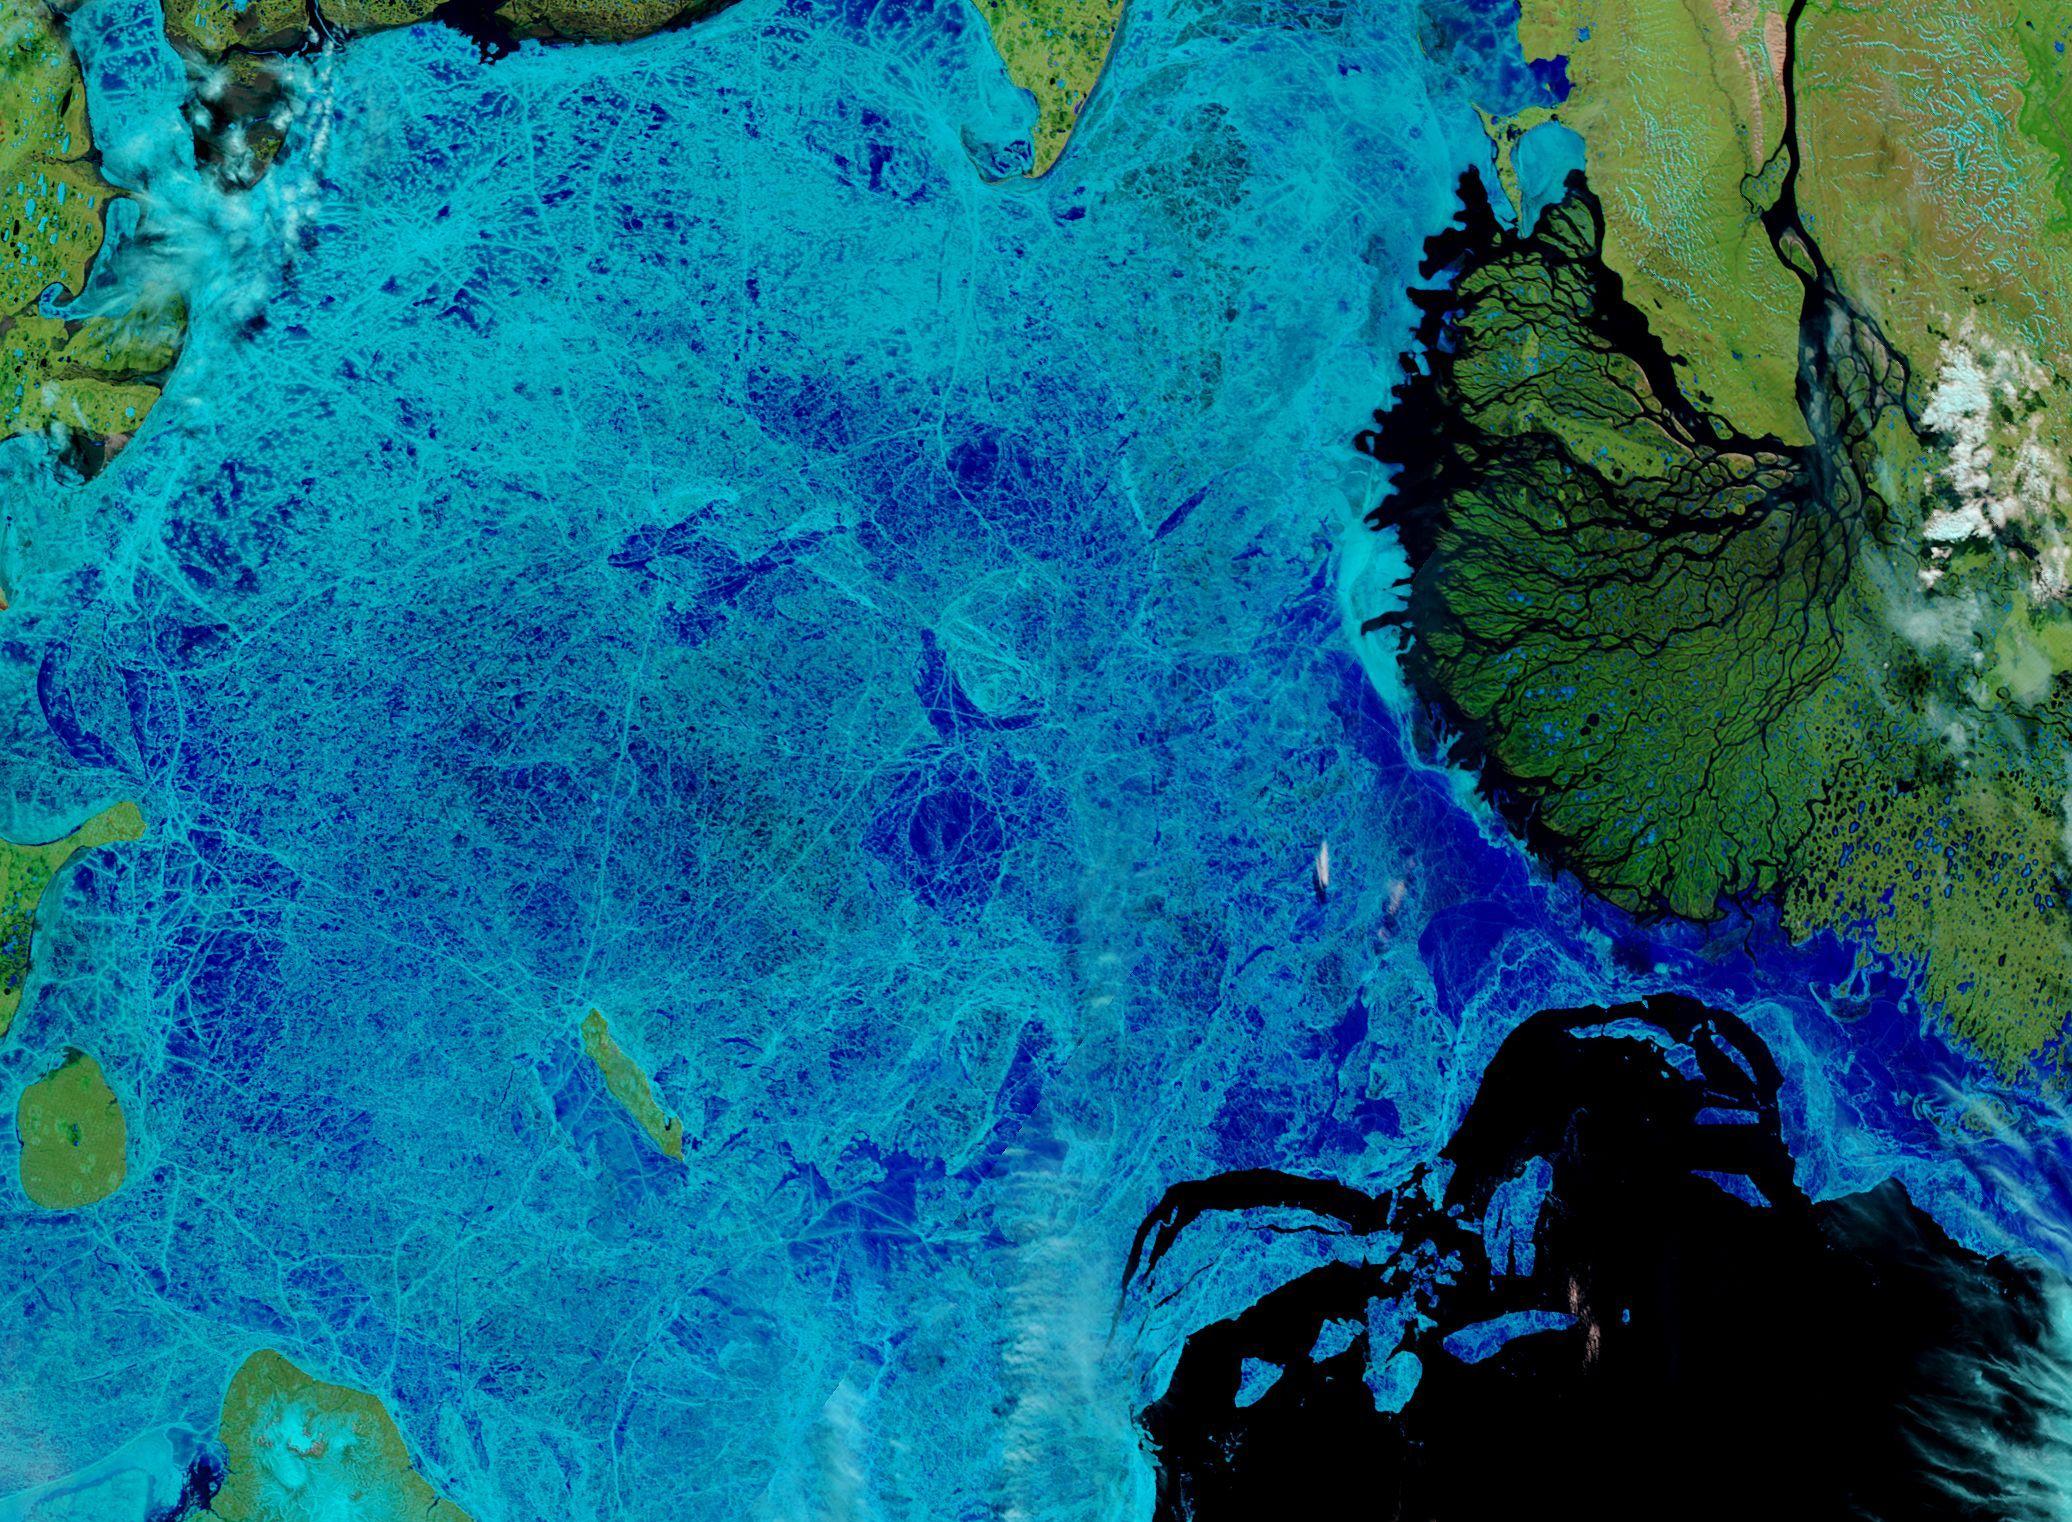
Finally, for the moment at least, liquid water is starting to seep out of the Lena Delta:
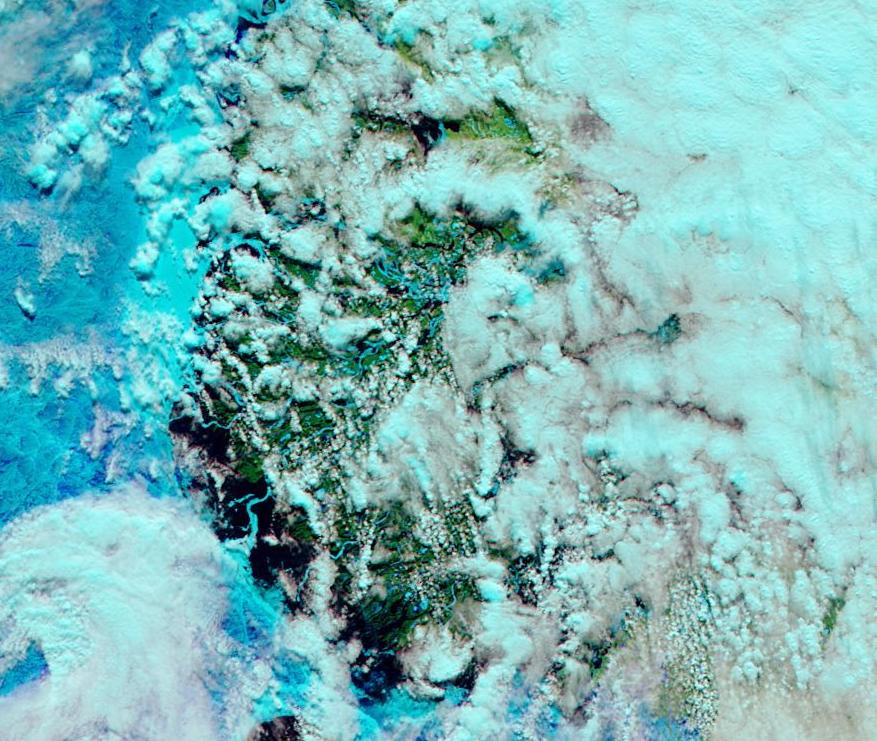
For comparison purposes please also take a look at the same date in 2016:
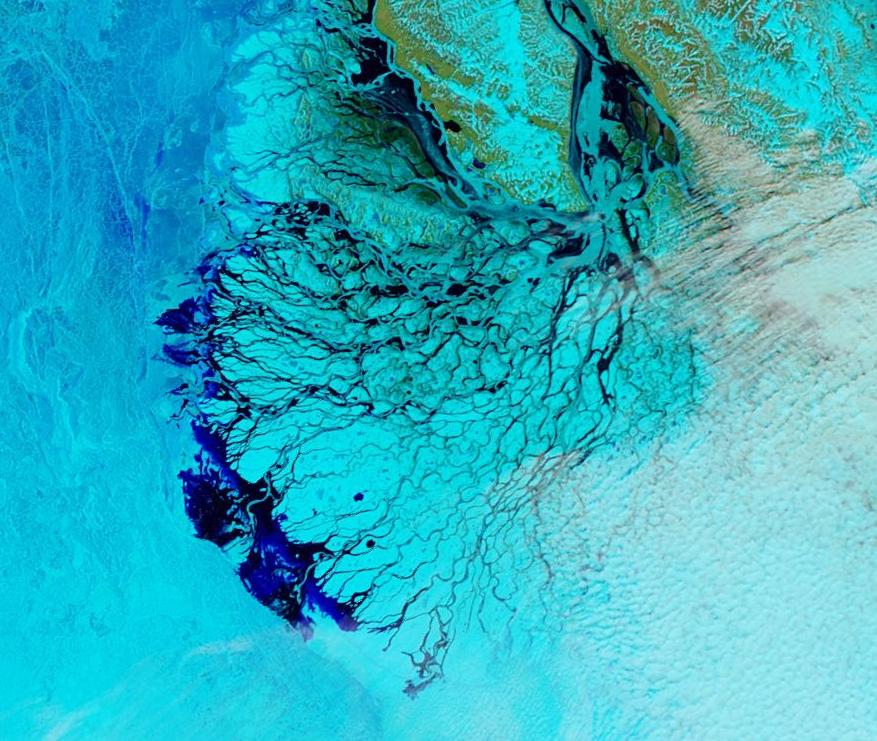
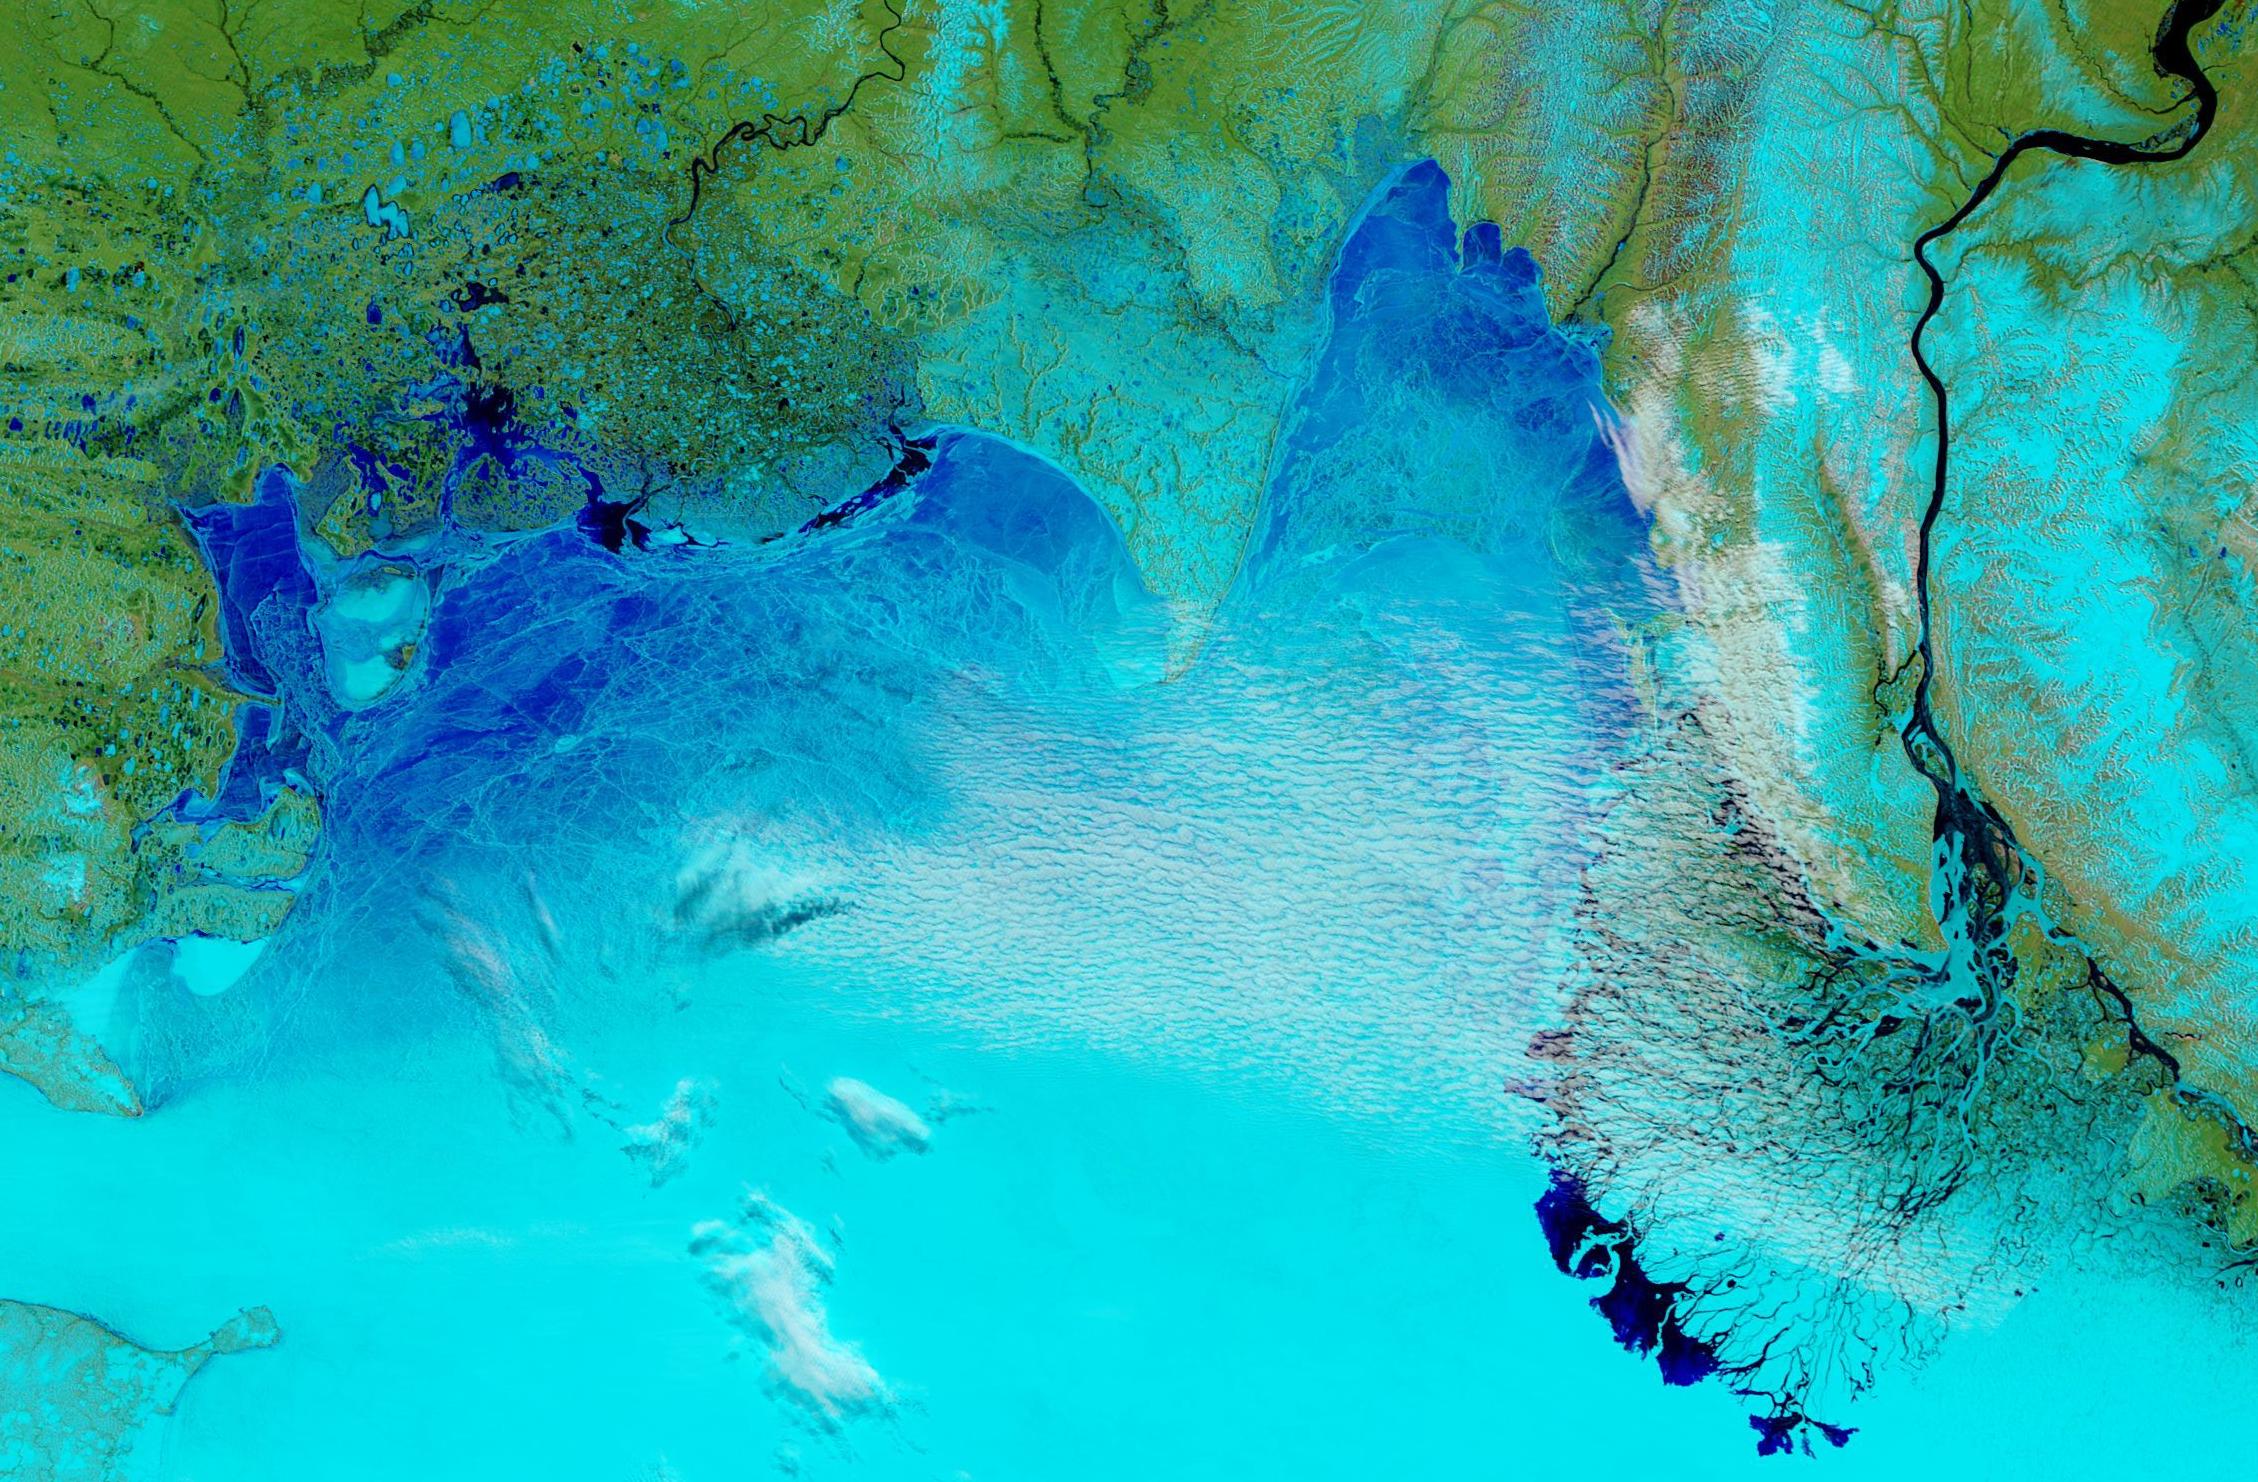
and the previous date in 2012:
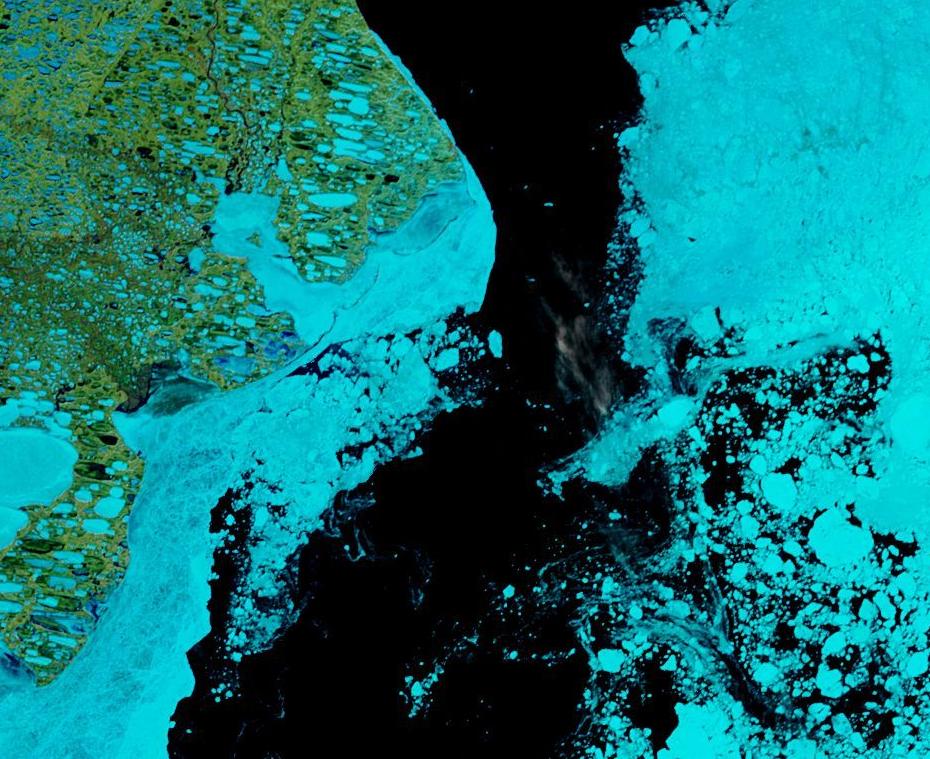
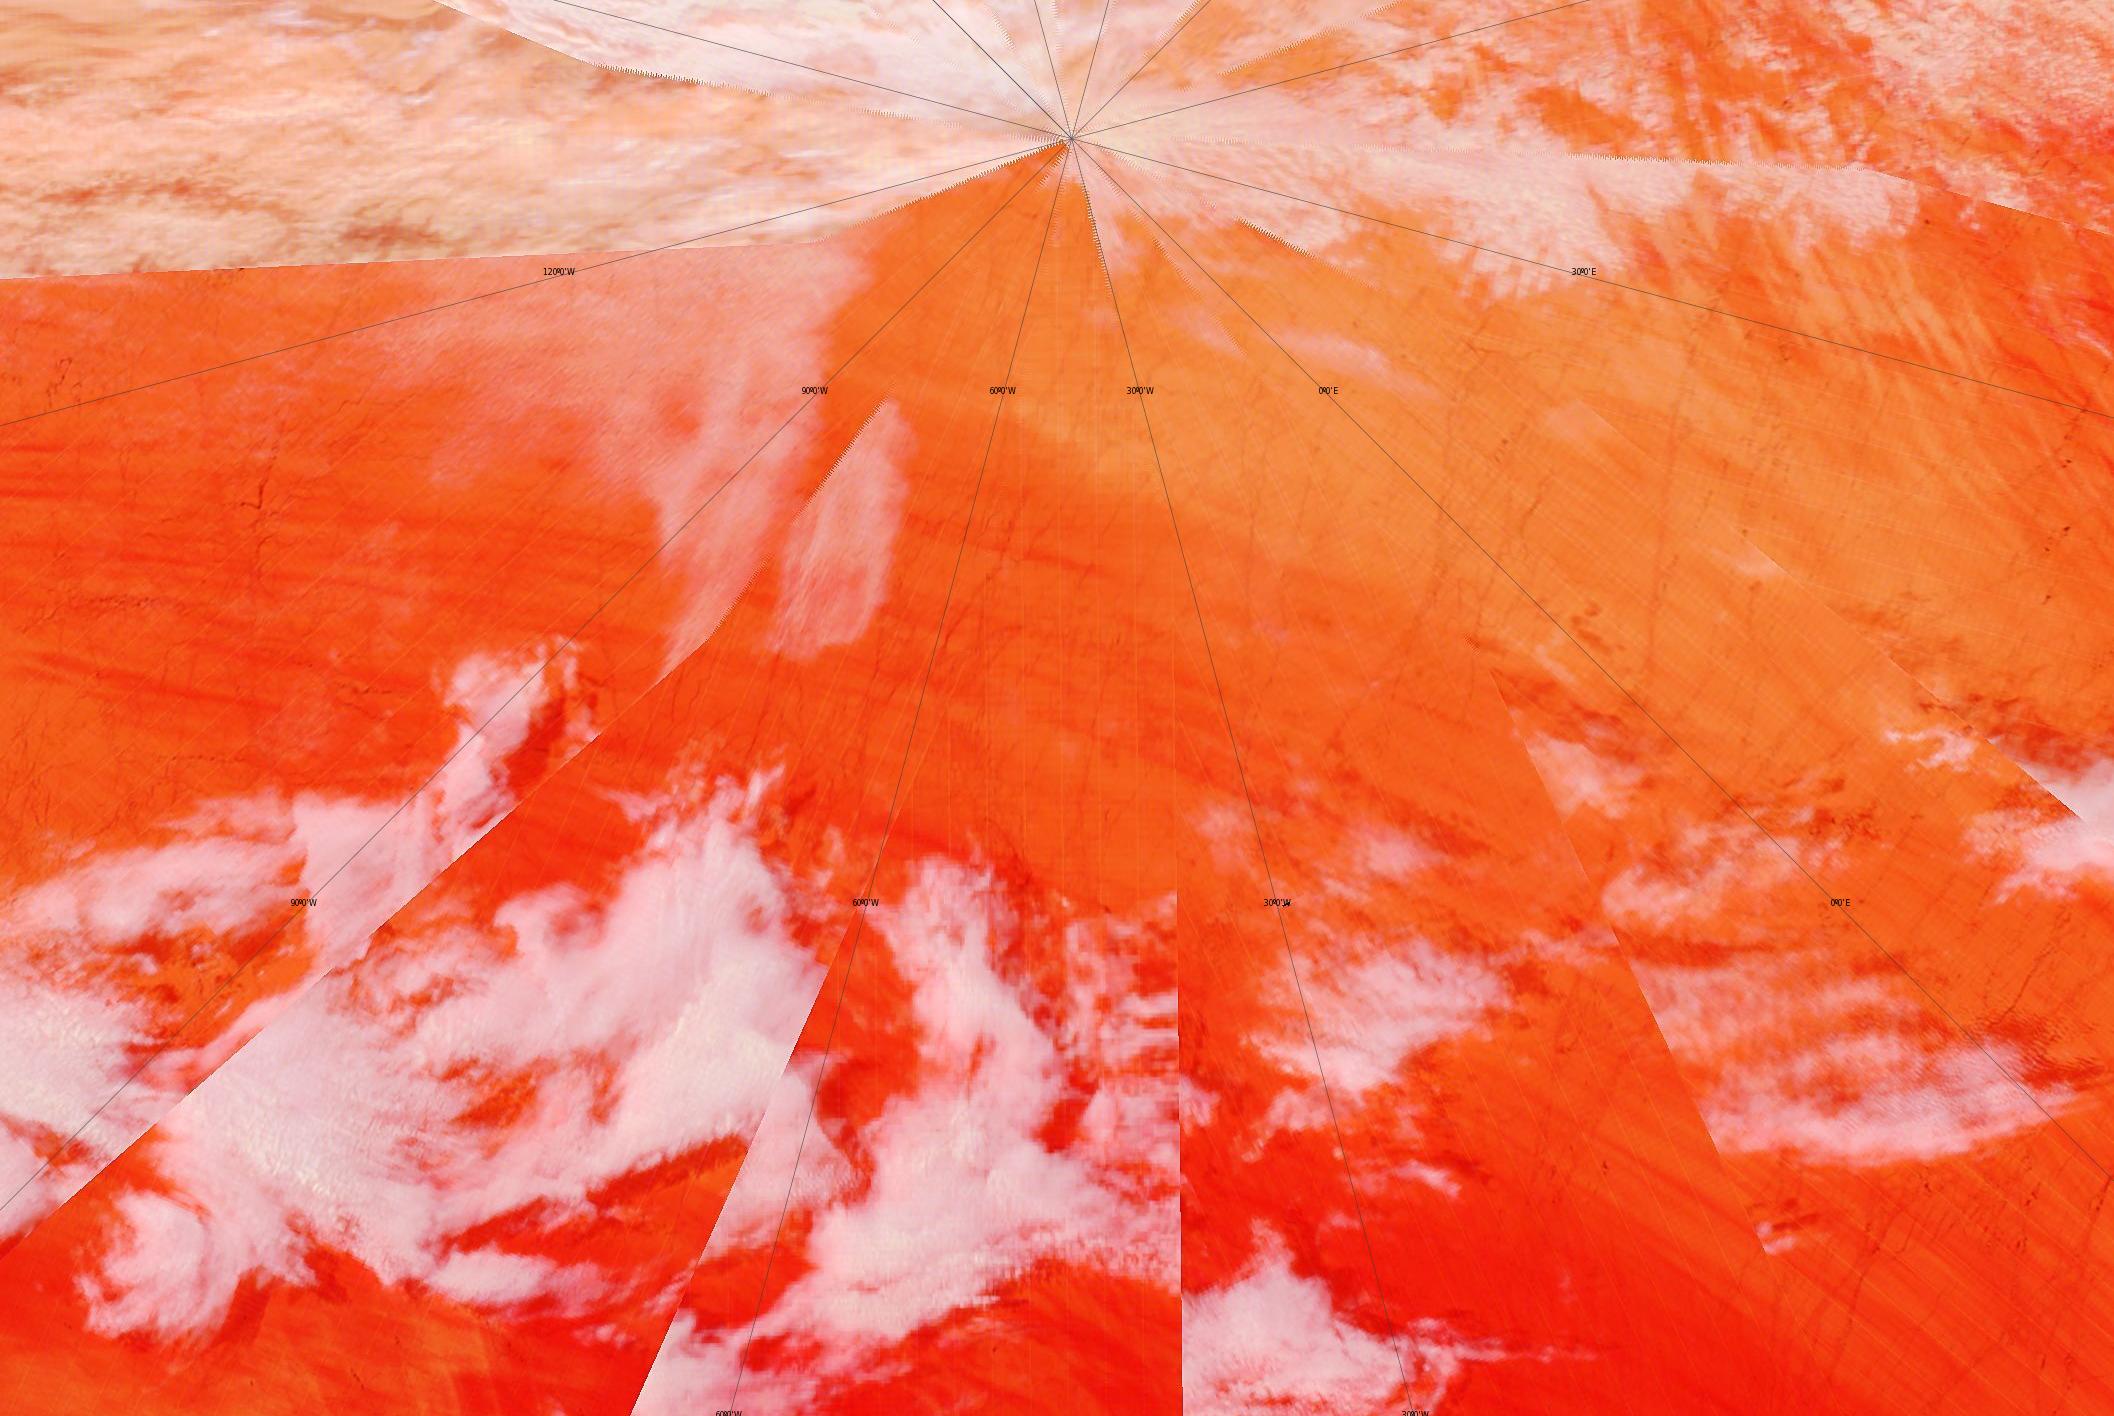
A significant area of the Laptev Sea ice is now turning a much darker shade of blue using the band 7-2-1 false colour combination:
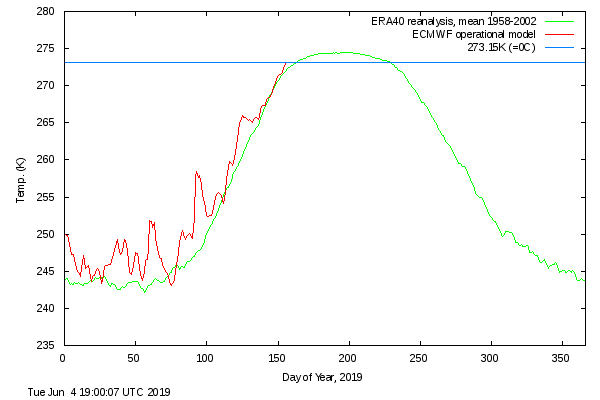
In addition the DMI >80N temperature metric has reached the zero Celsius line well ahead of schedule:
The May PIOMAS numbers have been released! Here is the Wipneus generated state of play on May 31st:
and here is the all too familar multi-year graph:

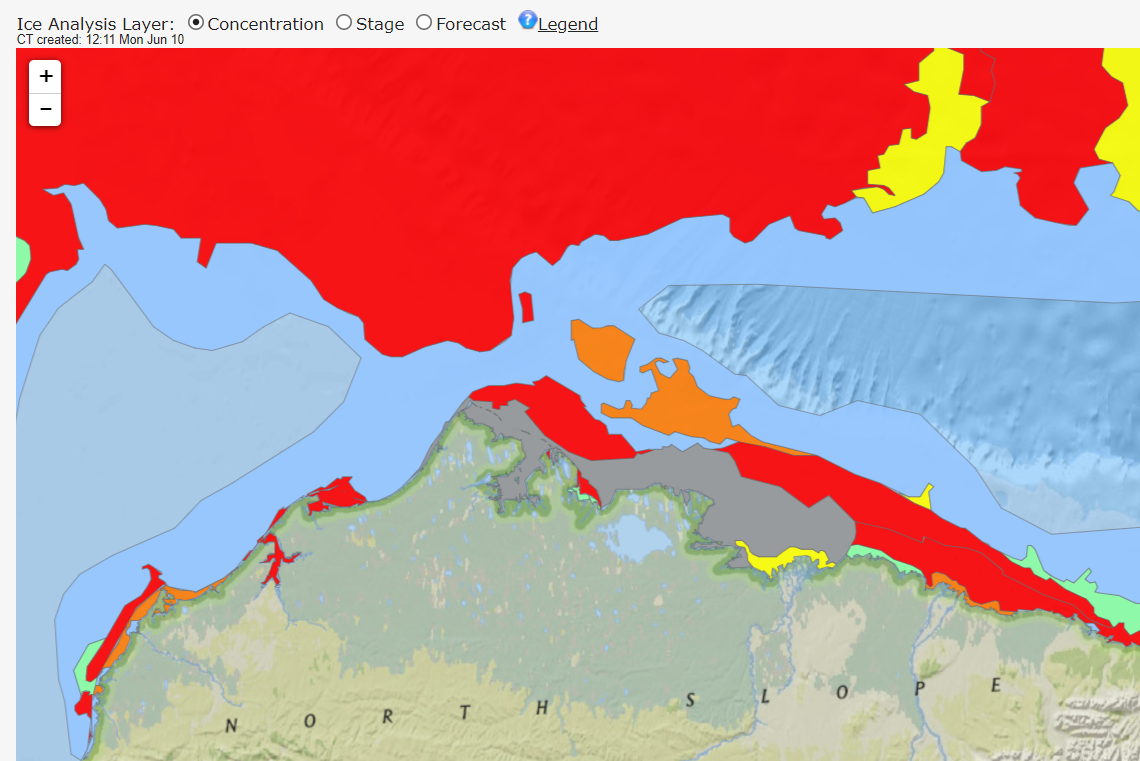
As reported in this year’s Northwest Passage article:
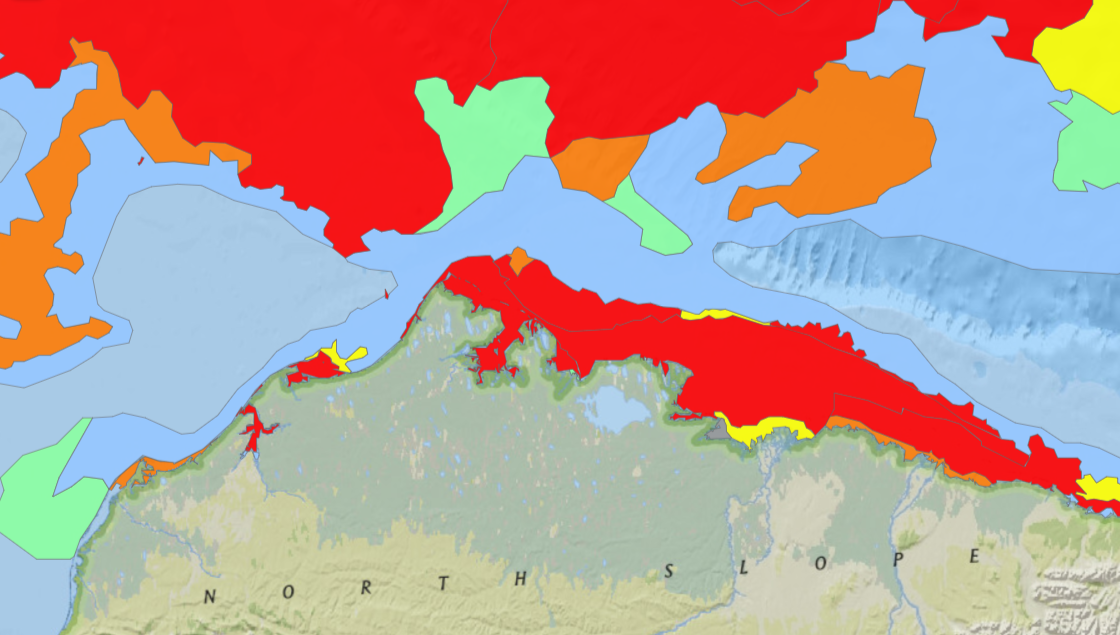
Any early bird traversing the Northwest Passage from west to east could now sail through open water around Point Barrow, along the Alaskan and Canadian coast and into the Amundsen Gulf:
Arctic Basin sea ice extent is still descending through uncharted territory:
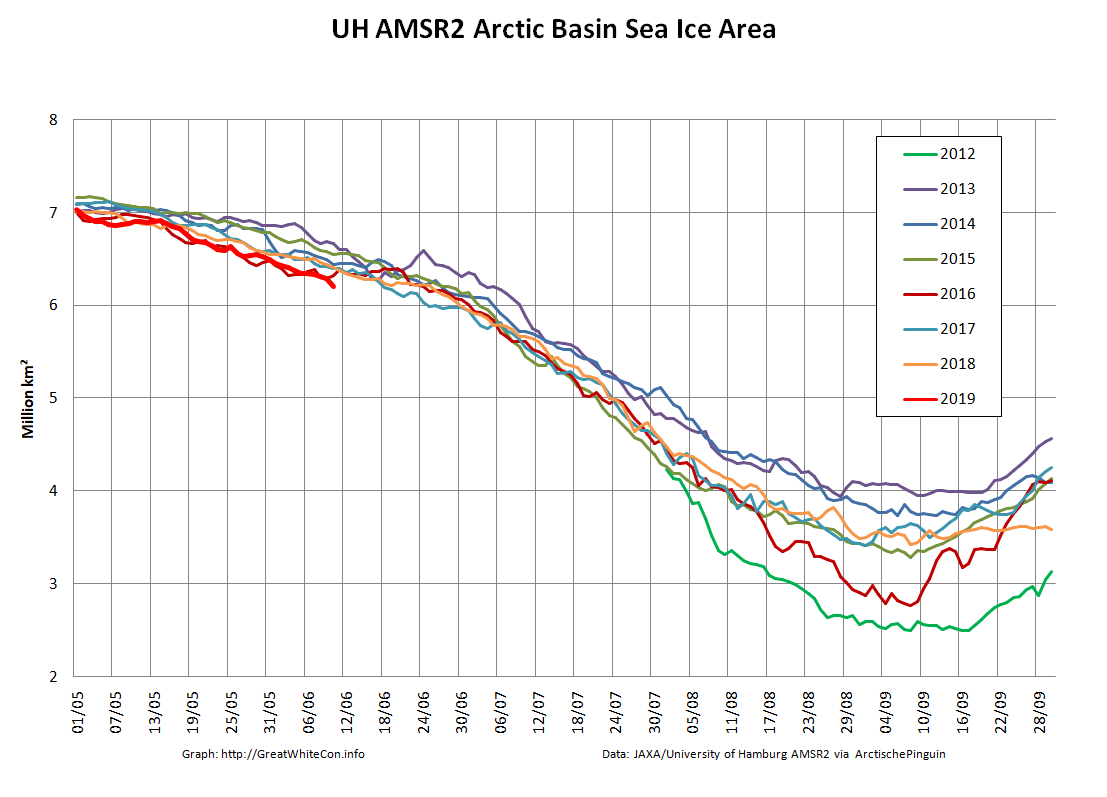
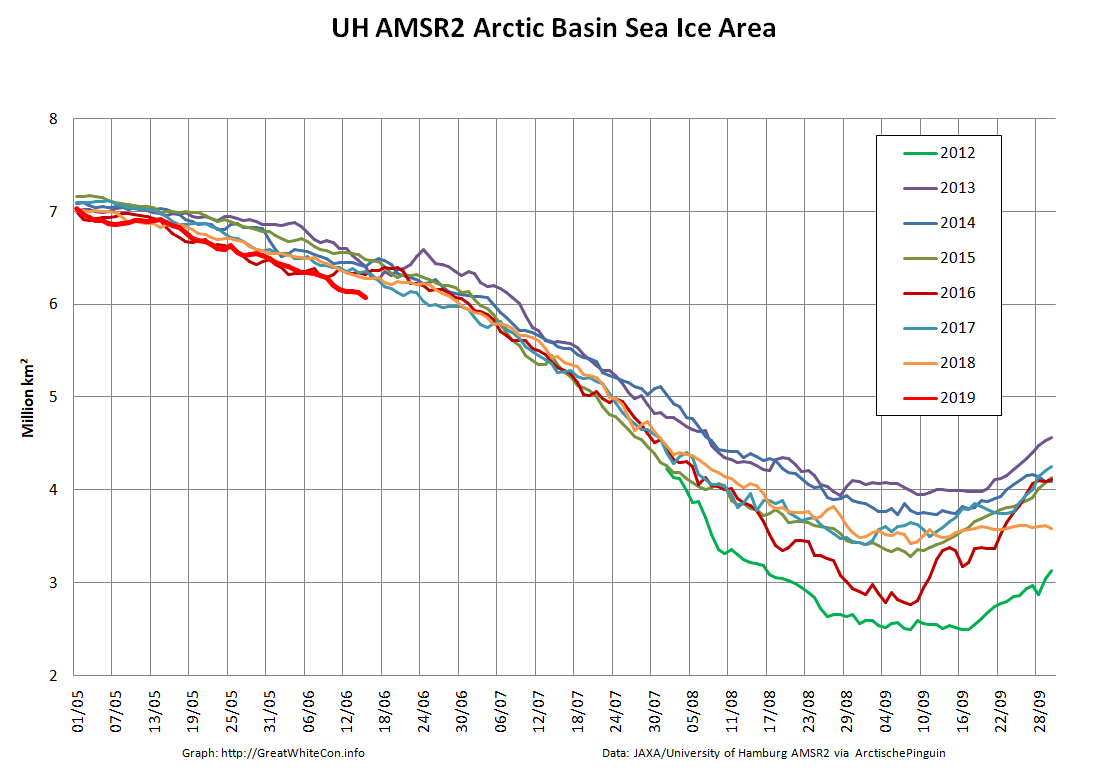
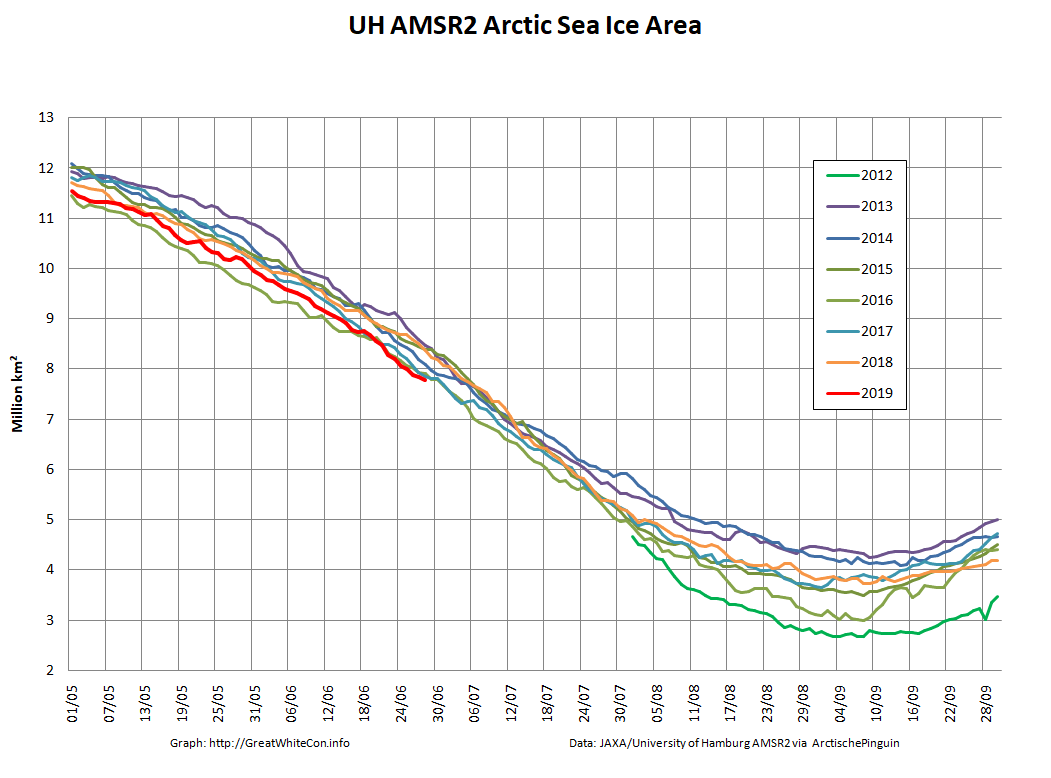
and Basin area currently looks poised to follow suit:

There’s a beautifully clear view of the Siberian coast today, with vast areas of melt ponds visible on VIIRS false colour:

The Arctic Basin area has indeed taken a nosedive into uncharted territory:
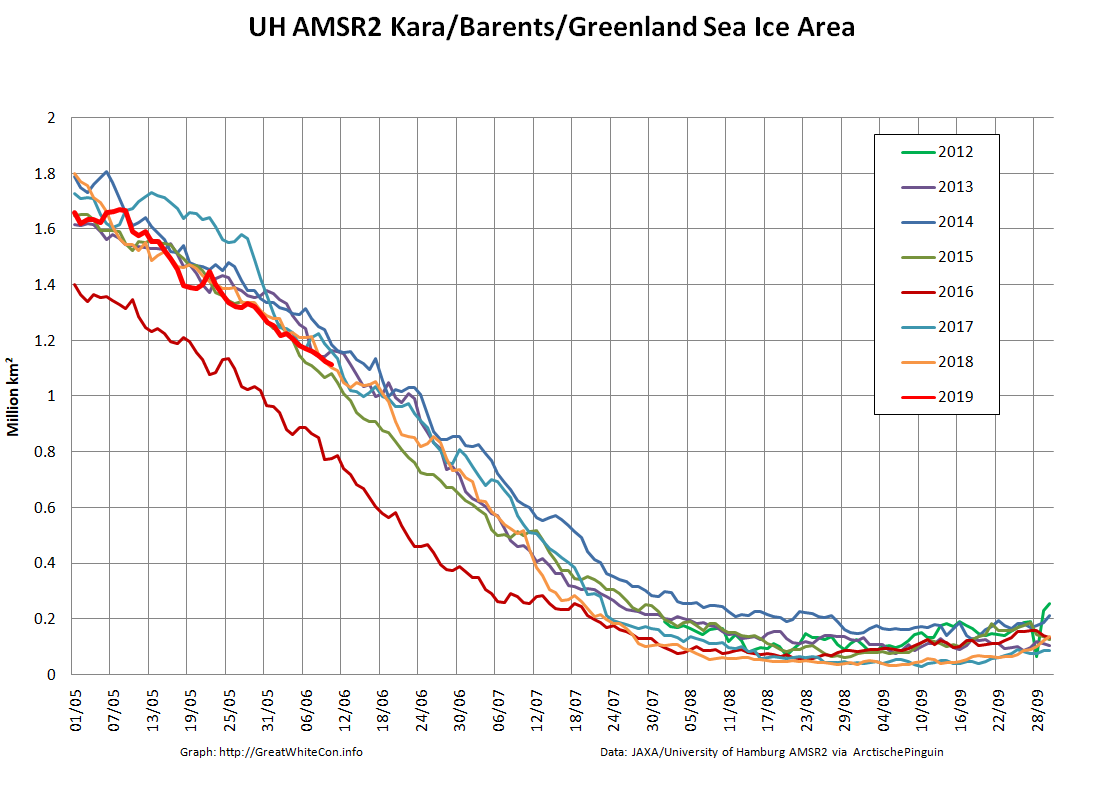
By way of comparison sea ice area on the Atlantic periphery is in amongst the recent pack, thanks to the almost continual drift in that direction over last winter:
High resolution AMSR2 extent has been in a “statistical tie” with 2016 for a few days:
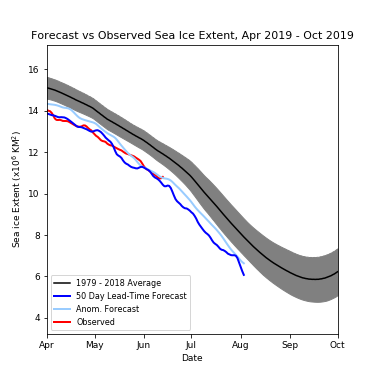
However the NSIDC’s 5 day average extent has reached a clear new low for the date, in the satellite record at least:
Especially for AJBT, here’s the Slater Probabilistic Ice Extent prediction for August 3rd:
and here’s the current DMI >80N temperature graph:

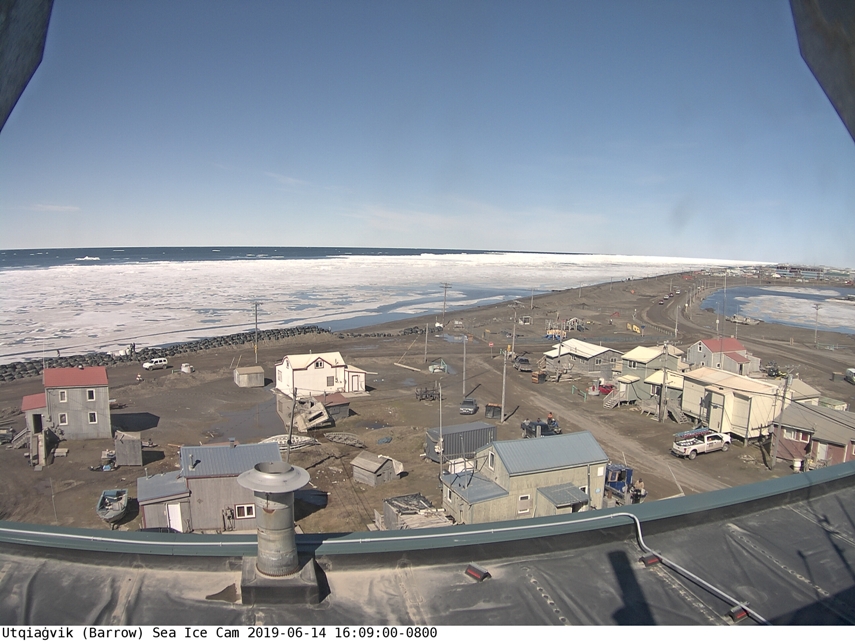
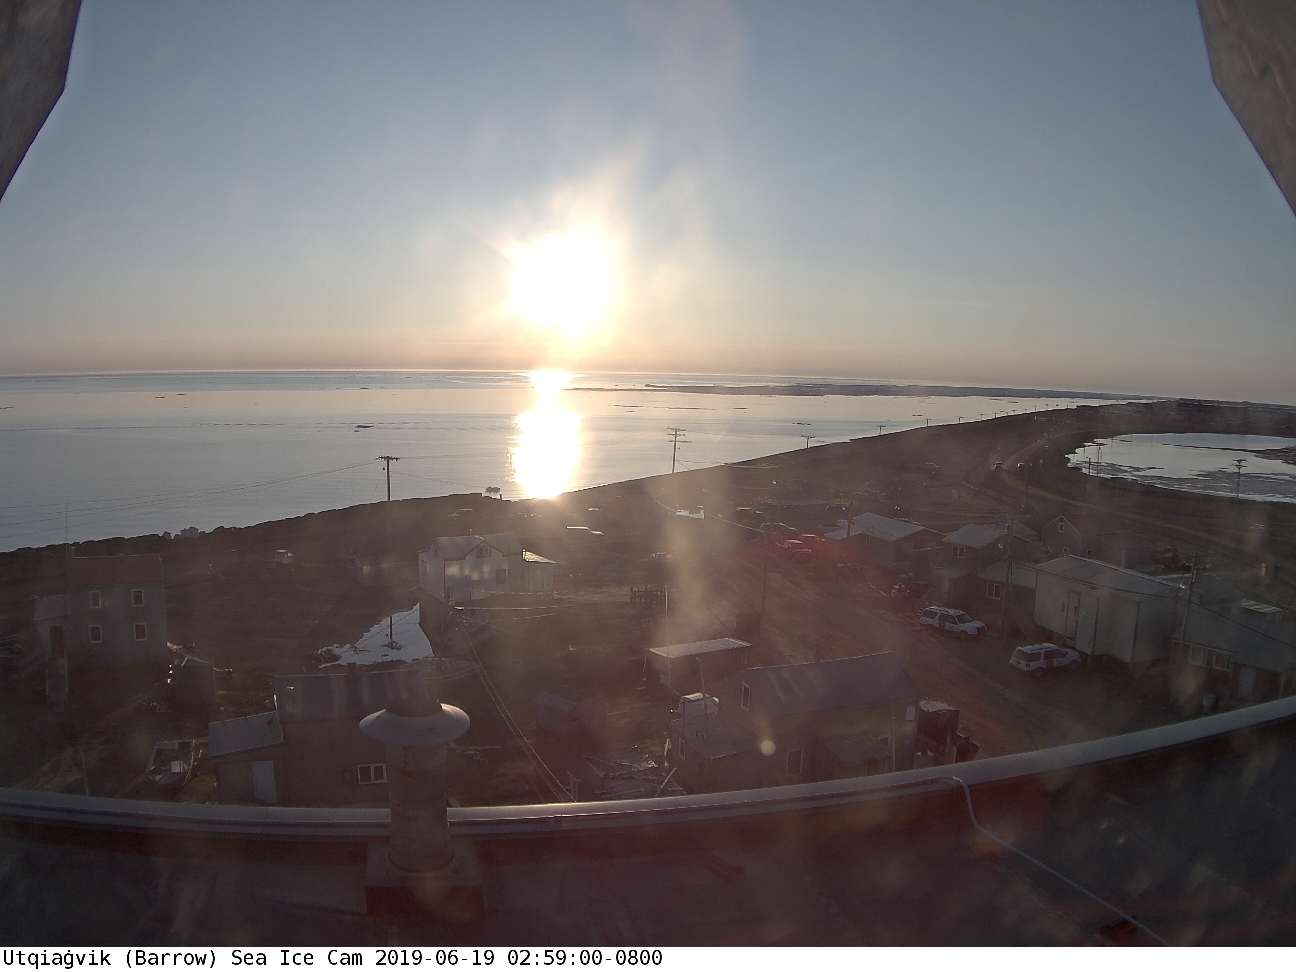
Finally, for the moment at least, there is not very much fast ice left at Utqiaġvik:
The sea ice in the Laptev Sea is starting to break up:
As is the fast ice in the Beaufort Sea:
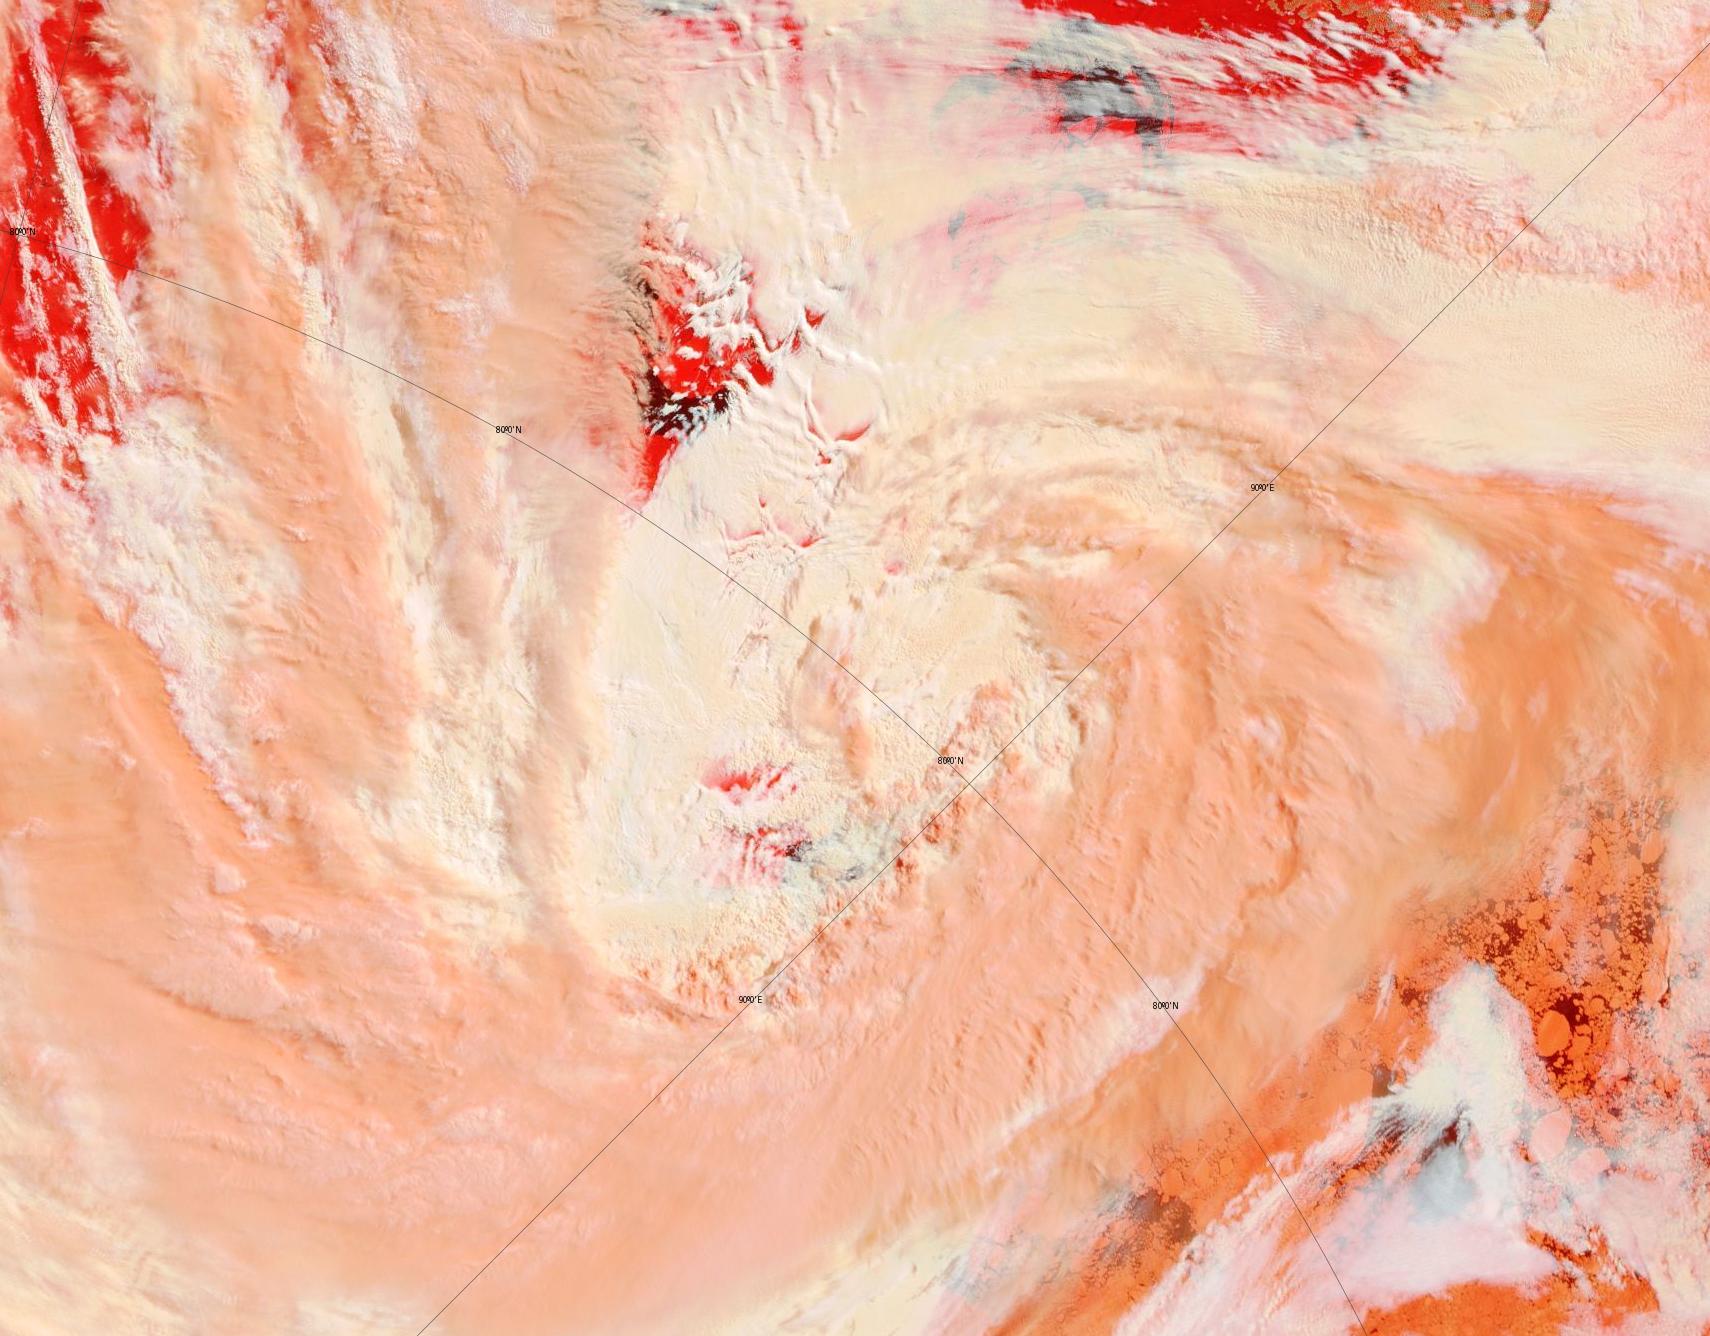
Meanwhile the MSLP of the cyclone currently spinning over Severnaya Zemlya was down to 976 hPa at 06:00 UTC this morning:

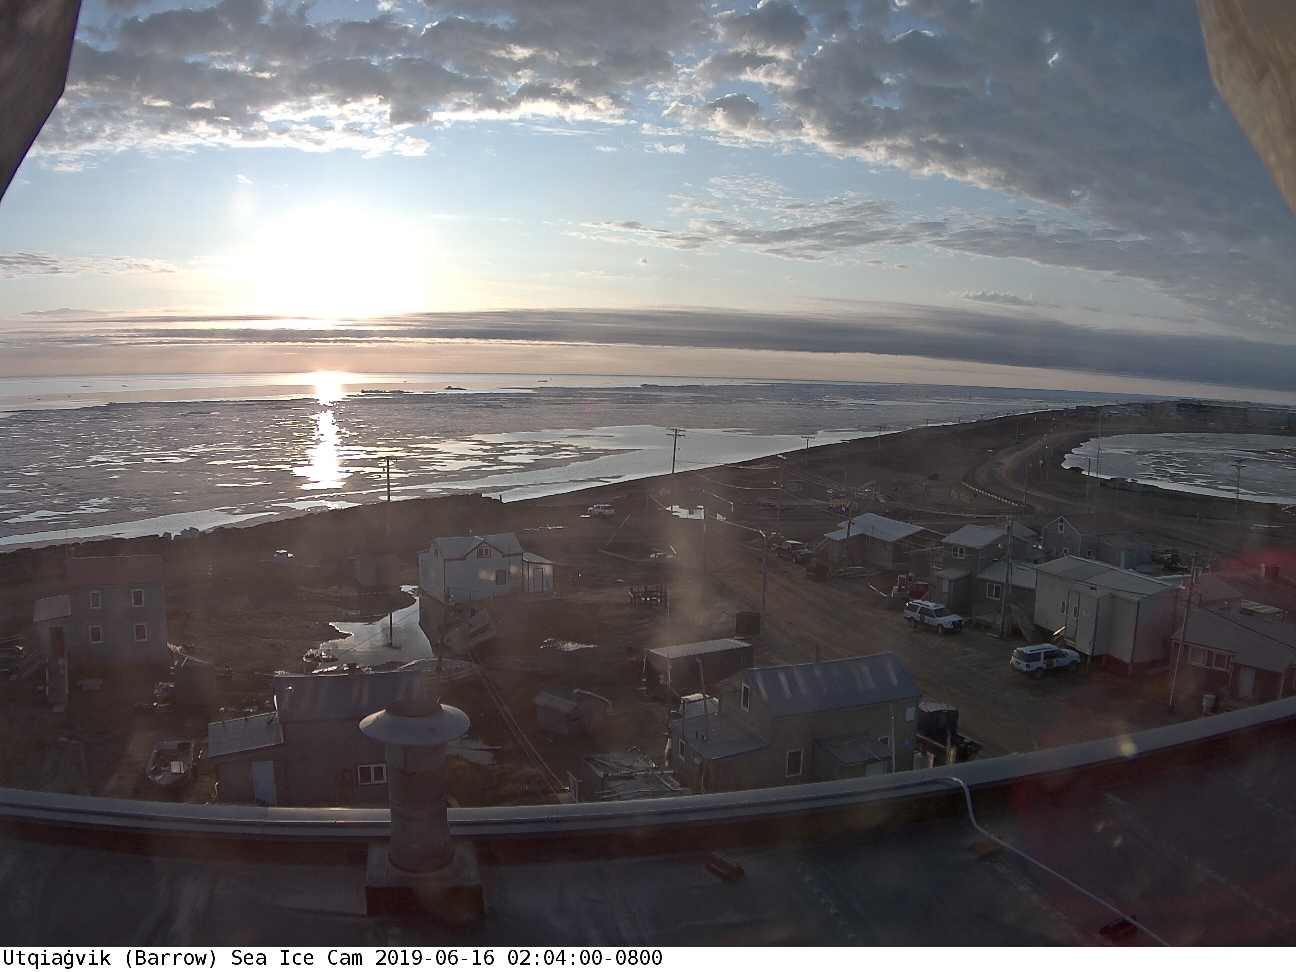
An early morning image from the Utqiaġvik webcam:
Especially for Mateo (see below) here’s the current high resolution Arctic Basin sea ice area:
and extent:
Note that the recent cyclones have caused a temporary jump in sea ice extent, but not in area.
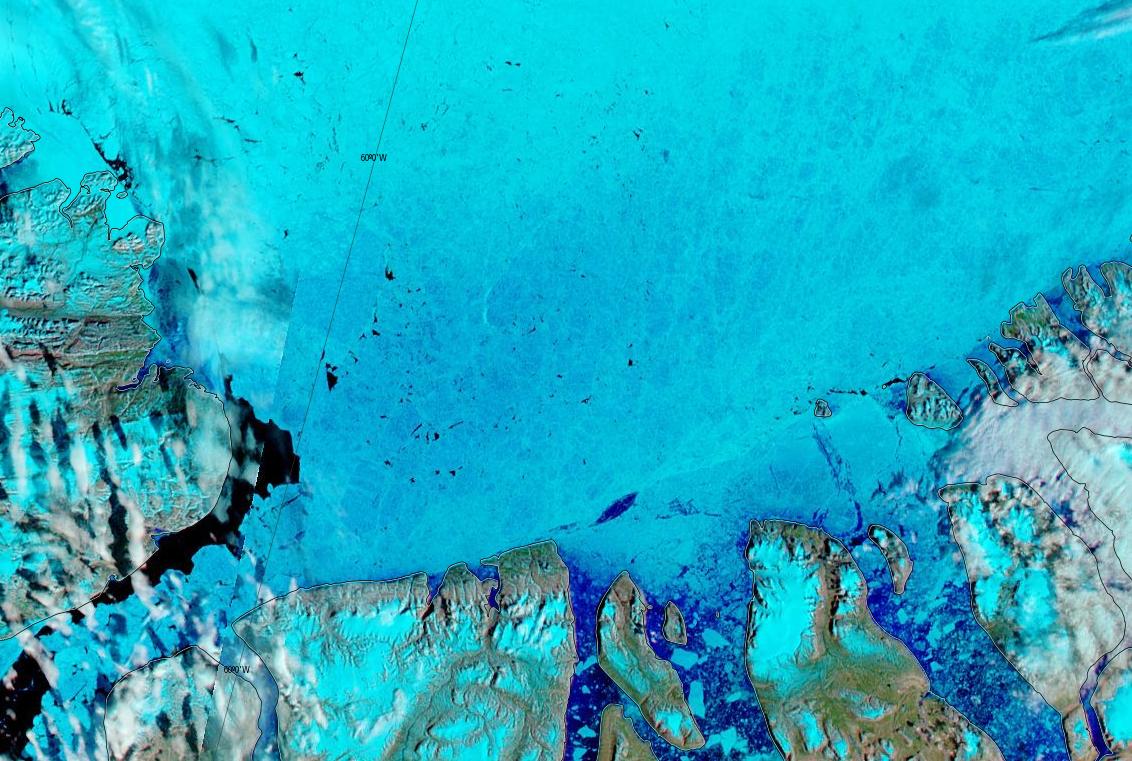
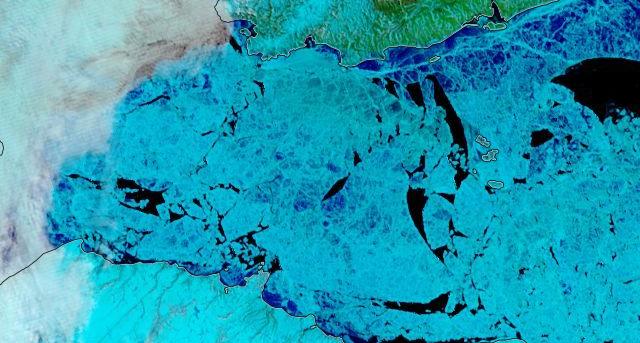
The Lincoln Sea has turned noticeably bluer on MODIS bands 7-2-1 false colour:
The sea ice off the Lena Delta has started to collapse:

Meanwhile the clear water off Point Barrow is opening up further:
Finally, for the moment at least, here is the current view from the Utqiaġvik (Barrow as was) sea ice webcam:
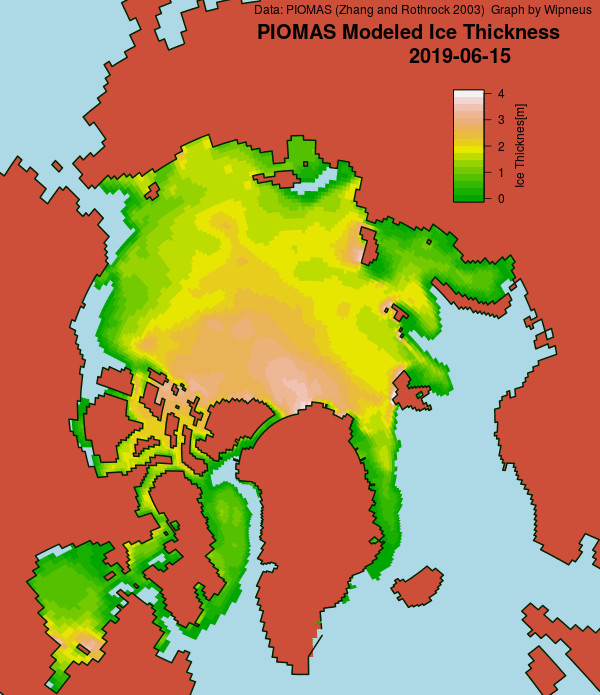
P.S. The mid month PIOMAS numbers have been released, and Wipneus has worked his usual magic:
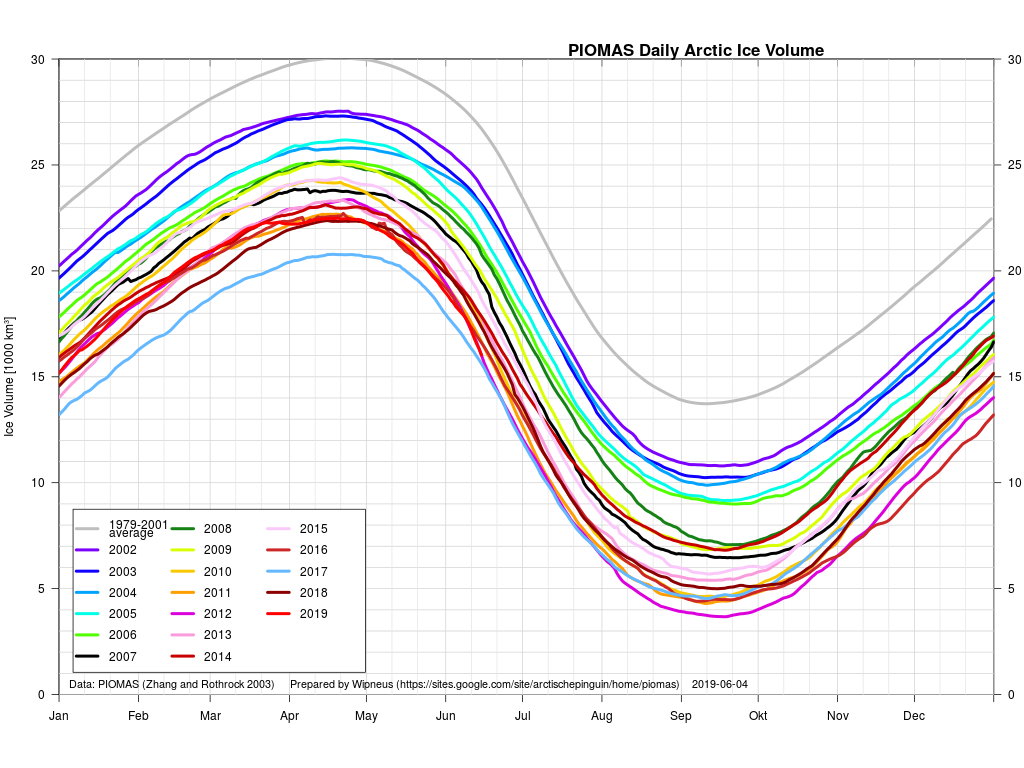
2019 sea ice volume is currently in a “statistical tie” with 2012, in 2nd place behind 2017:
The fast ice in the Vilkitsky Strait has started to break up:
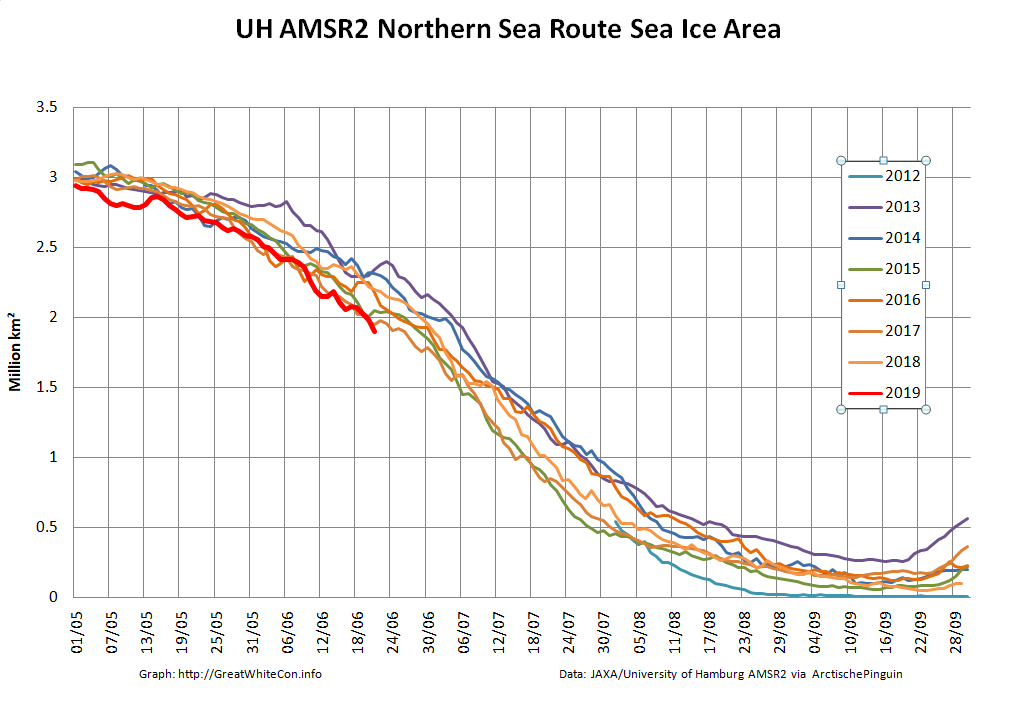
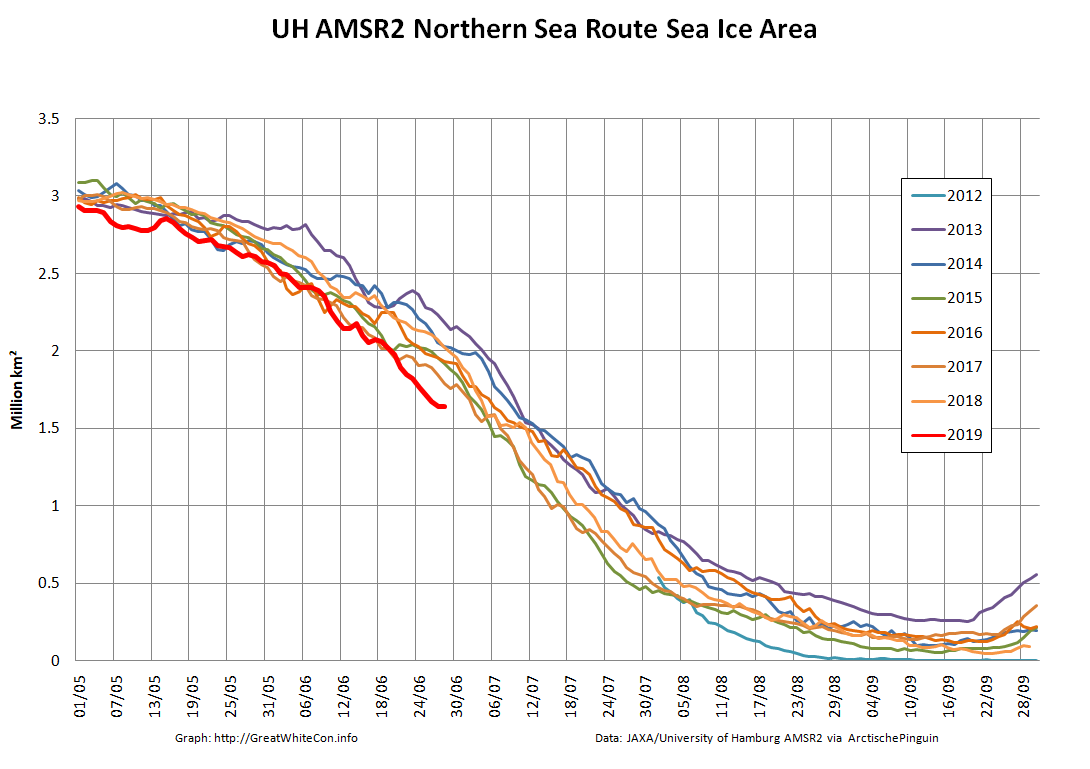
Sea Ice area along the Northern Sea Route is currently the lowest for the date in the AMSR2 ere:
In addition the June 2019 Sea Ice Prediction Network report has been released. Here’s the summary:
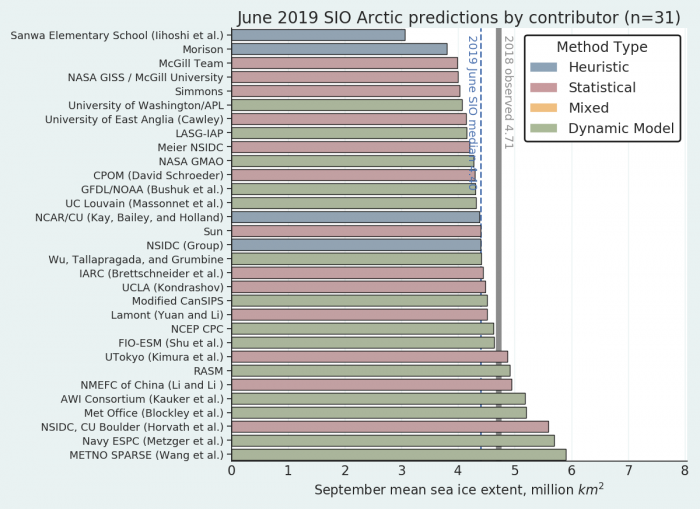
Again, as in previous years, the spread in the dynamical models are larger compared with statistical models. Overall, the heuristic method has the lowest projected September sea-ice extent value with a median at 4.09 million square kilometers, and the dynamical models have the highest number with the median at 4.56 million square kilometers.
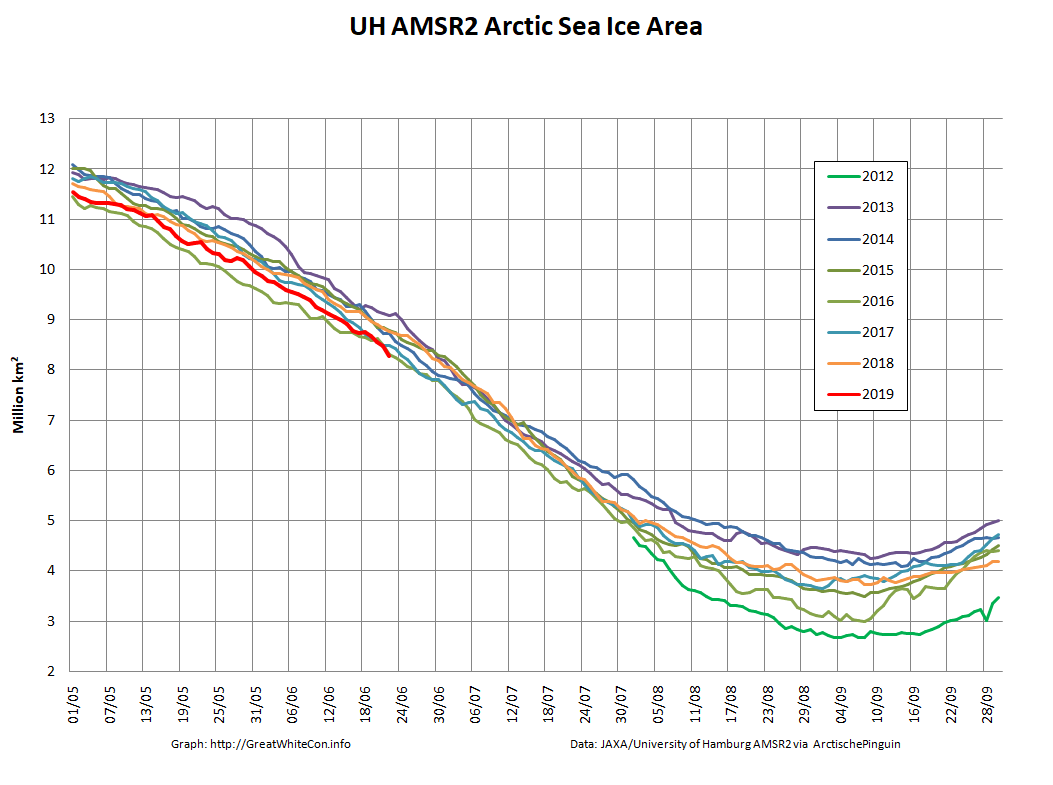
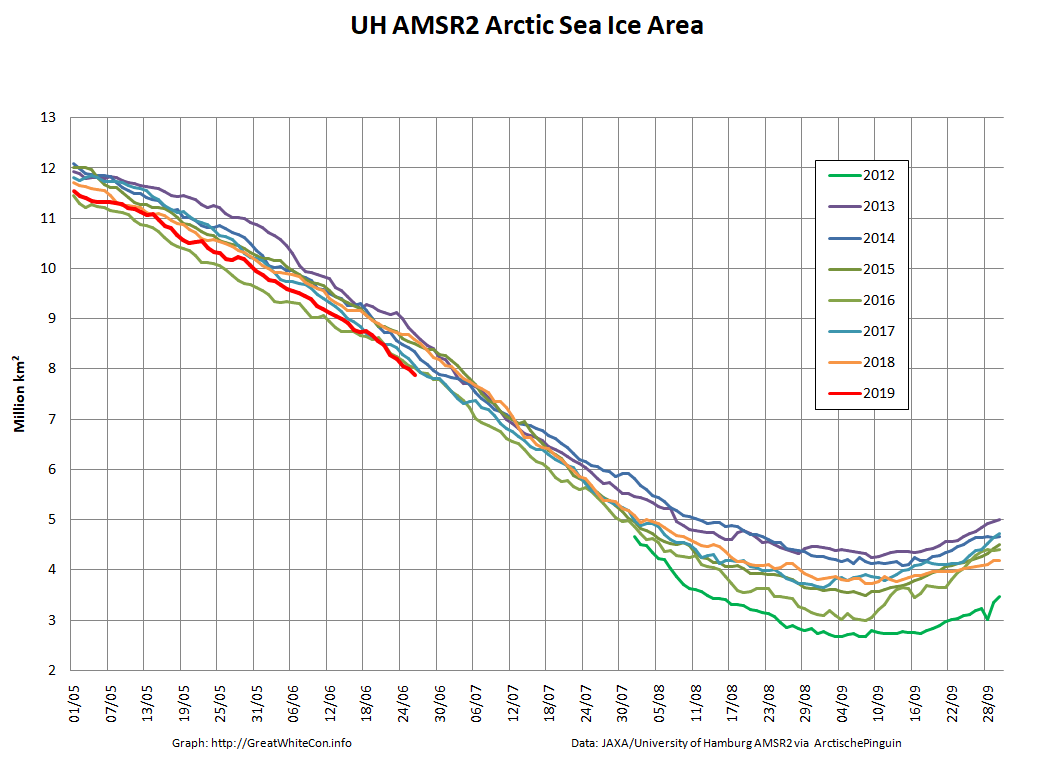
Arctic wide sea ice area is now lowest for the date in the high resolution AMSR2 record, although extent has yet to follow suit:
If you exclude the peripheral seas, which are all largely ice free by mid September in this day and age, the picture is extremely stark:
A brief glimpse through the clouds reveals that the North Pole is now starting to feel the recent heat:
Arctic wide sea ice extent is now lowest for the date in the high resolution AMSR2 record:
Here’s Arctic wide sea ice area, which is still well below the rest of the pack:
As the end of the month draws near let’s take a look at sea ice area along a couple of the famous sea routes above the Arctic Circle. First of all here’s the Northern Sea Route, comprising the Kara, Laptev, East Siberian and Chukchi Seas:
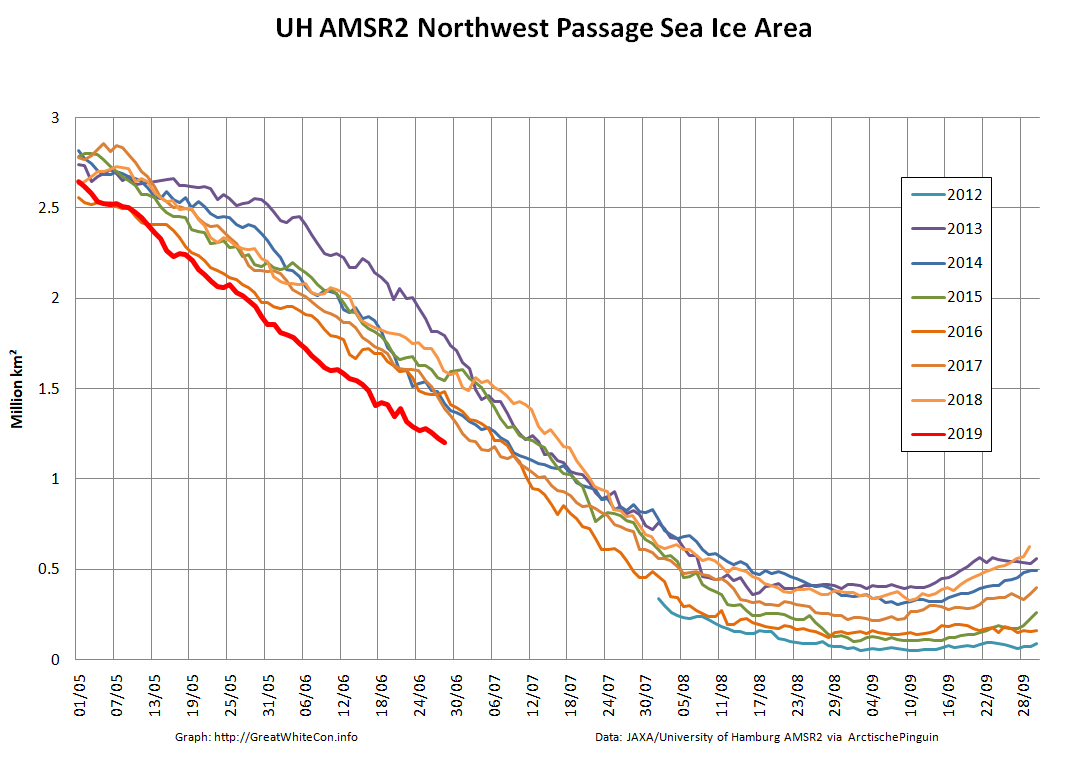
Next here’s the Northwest Passage, comprising the Chukchi and Beaufort Seas plus the channels of the Canadian Arctic Archipelago and Baffin Bay:
For completeness here too are the current Arctic wide area and extent numbers:
Watch this space!