Regular readers will be aware that in a recent article in the Mail on Sunday David Rose quoted Professor Judith Curry as stating that:
The record warm years of 2015 and 2016 were primarily caused by the super El Nino
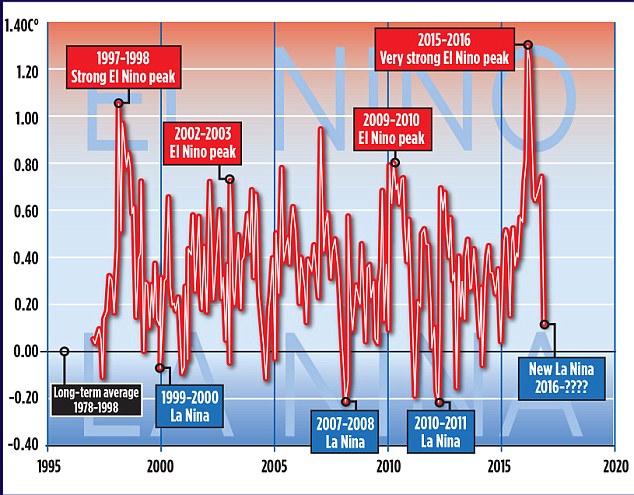
The article in question also included this graph:
It looks as though David’s left hand doesn’t know what his right hand is doing. Was the 2015 El Niño “Super” or “Very strong”? And how about the 1997/98 El Niño. Was that one really merely “Strong”?
We sought the professional opinion of an eminent expert in such matters, according to David Rose at least – Professor Judith Curry. Here’s how we got on, firstly at Prof. Curry’s “Climate Etc.” blog:
Us:
Since you mention the subject, I was wondering if Dr. Curry could take a look at the “the authoritative Met Office ‘HADCRUT4’ surface record” mentioned in David Rose’s latest Mail article and explain how it justifies her “The record warm years of 2015 and 2016 were primarily caused by the super El Nino” remark quoted in his previous one:
Bill the Frog has asked me to check the objective criteria Prof. Curry uses for differentiating between “weak”, “strong”, “very strong” and “super” El Niños. Likewise for La Niñas.
Can you assist by any chance Ristvan? Can Judith?
Them:
JH, Sure could. But first prove you are just not more loser snark.
Enso is variously but in eqch case precisely defined. I defer to Bob Tisdale comcerning details. And you?
Us:
I defer to the BoM in the first instance. How about Judith?
A different Them:
Jim Hunt
I expect the answers you are looking for are in this article by Judith back in 2014
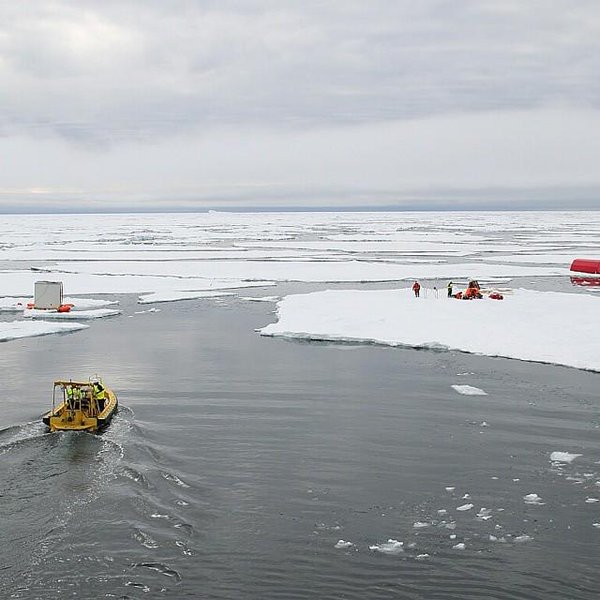
I just watched the live stream of the fall 2016 AGU press conference about the findings of the “First results from the Norwegian Young Sea ICE Expedition”.
Here’s the associated video of the expedition:
Here are the bullet points:
Initial results suggest that the thinner and younger ice is altogether different from older multiyear ice. It moves faster, breaks up easier, melts faster, and is more vulnerable to storms. This has important consequences for the Arctic as a whole, as our current knowledge is largely based on information from the “old Arctic.”
The Atmosphere
• For the first time, N-ICE2015 researchers directly observed large winter storms over sea ice and saw that they have significant effects on the young, thinner ice. The high winds create a lot of stress on the sea ice by pushing it around and breaking it up.
• One winter storm raised the air temperature from -40 F to +32 F in less than 48 hours, while the moisture in the air increased 10 times. All of these factors significantly warm the surface of the snow, even in mid-winter, and slow the growth of ice.
The Sea Ice and Snow Cover
• Researchers on the drifting ice camps found more snow on top of the ice than expected. This insulated the ice from the atmosphere, slowing its growth in winter and surface melt in summer.
• The sea ice was sometimes flooded by seawater as the large snow load pushed the thinner ice below sea level.
• The thinner sea ice was more dynamic than researchers have seen before. This could mean more ridging but also more cracks and leads between ice floes.
The Ocean
• Winter storms caused the sea ice to drift so fast that it increased mixing of the water beneath the ice. Deeper, warmer water was mixed up closer to the sea ice, causing it to melt from below despite winter air temperatures that were below freezing.
• Researchers saw summer storms stir up deep warm waters and melt as much as 25 cm of ice in a single day.
The Ecosystem
• For the first time, N-ICE2015 researchers observed an algae bloom under snow-covered pack ice. Thinner and more dynamic Arctic sea ice allows more light transmission to the ocean, especially through cracks and leads. This triggers earlier phytoplankton blooms under the snow-covered ice.
• The phytoplankton species that dominated the under-ice bloom does not sink to the deep ocean. Such shifts in phytoplankton species composition, associated with early under-ice phytoplankton blooms, could thus have important implications for the strength of the biological carbon pump in the Arctic.
There was also mention of the “waves in ice” event that the R/V Lance experienced back in June 2015:
P.S. A recording of the N-ICE2015 press conference is now available:
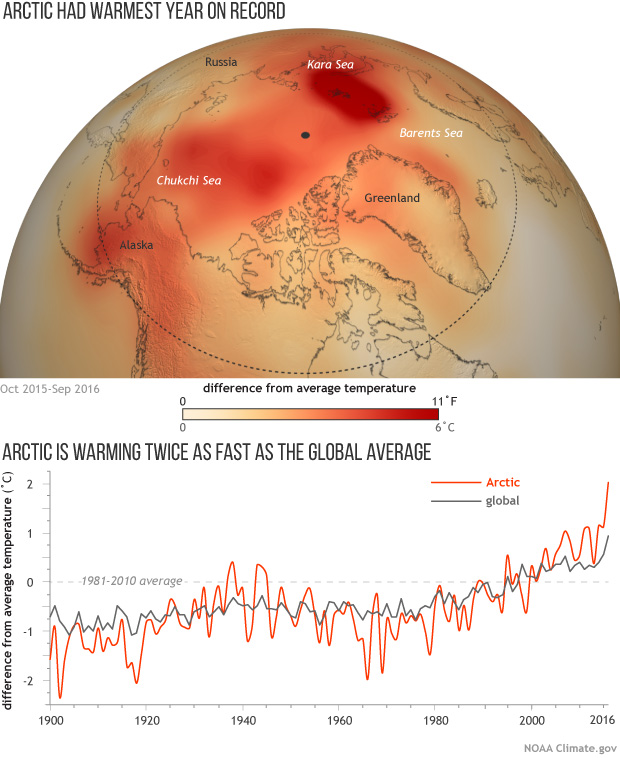
No doubt because of the recent controversy concerning the effects of the 2015/16 El Niño the first graphic that caught my eye was this one:
In the question and answer session the obvious question was asked. The answer was that while attribution is difficult the 2015/16 El Niño did have some effect on Arctic sea ice. However currently we’ve only seen “the first act of a 3 act play”. Act 2 will be the maximum extent in March.
In answer to another question, a focus of research over the next 10 years should be the interactions between mid latitudes and the Arctic.
P.S. A recording of the Arctic Report Card press conference is now available:
A variety of cryospheric posters are available via:
“Post-truth” is the the Oxford Dictionaries word of the year for 2016. The definition reads as follows:
post-truth – an adjective defined as ‘relating to or denoting circumstances in which objective facts are less influential in shaping public opinion than appeals to emotion and personal belief’.
and according to Oxford Dictionaries:
The concept of post-truth has been in existence for the past decade, but Oxford Dictionaries has seen a spike in frequency this year in the context of the EU referendum in the United Kingdom and the presidential election in the United States. It has also become associated with a particular noun, in the phrase post-truth politics.
Post-truth has gone from being a peripheral term to being a mainstay in political commentary, now often being used by major publications without the need for clarification or definition in their headlines.
Our old friend David Rose has been remarkably quiet on the topic of Arctic sea ice recently. Presumably the objective facts from the Arctic are impossible to spin to his satisfaction even for a man of David’s talents? However that didn’t stop him from penning an article for The Mail on Sunday at the end of November on the topic of the recent “record highs in global temperatures“:
Global average temperatures over land have plummeted by more than 1C since the middle of this year – their biggest and steepest fall on record.
The news comes amid mounting evidence that the recent run of world record high temperatures is about to end. The fall, revealed by Nasa satellite measurements of the lower atmosphere, has been caused by the end of El Niño – the warming of surface waters in a vast area of the Pacific west of Central America.
The Mail article helpfully included this one year old video from the World Meteorological Organization, explaining the basics of the El Niño phenomenon:
According to the commentary:
This phenomenon affects weather conditions across the equatorial Pacific, with potential knock on effects in other parts of the world.
We’ll get on to the “potential knock on effects” in the Arctic eventually, but let’s start with a snippet of Mr. Rose’s “post-truth politics”:
Some scientists, including Dr Gavin Schmidt, head of Nasa’s climate division, have claimed that the recent highs were mainly the result of long-term global warming.
Last year, Dr Schmidt said 2015 would have been a record hot year even without El Nino. ‘The reason why this is such a warm record year is because of the long-term underlying trend, the cumulative effect of the long-term warming trend of our Earth,’ he said. This was ‘mainly caused’ by the emission of greenhouse gases by humans.
Other experts have also disputed Dr Schmidt’s claims. Professor Judith Curry, of the Georgia Institute of Technology, and president of the Climate Forecast Applications Network, said yesterday: ‘I disagree with Gavin. The record warm years of 2015 and 2016 were primarily caused by the super El Nino.’ The slowdown in warming was, she added, real, and all the evidence suggested that since 1998, the rate of global warming has been much slower than predicted by computer models – about 1C per century.
David Whitehouse, a scientist who works with Lord Lawson’s sceptic Global Warming Policy Foundation, said the massive fall in temperatures following the end of El Nino meant the warming hiatus or slowdown may be coming back. ‘According to the satellites, the late 2016 temperatures are returning to the levels they were at after the 1998 El Nino. The data clearly shows El Nino for what it was – a short-term weather event,’ he said.
In case you’re wondering where the politics is in all of this, you need look no further than here:
The last three years may eventually come to be seen as the final death rattle of the global warming scare. Thanks [sic] what’s now recognised as an unusually strong El Nino, global temperatures were driven to sufficiently high levels to revive the alarmist narrative – after an unhelpful pause period of nearly 20 years – that the world had got hotter than ever before.
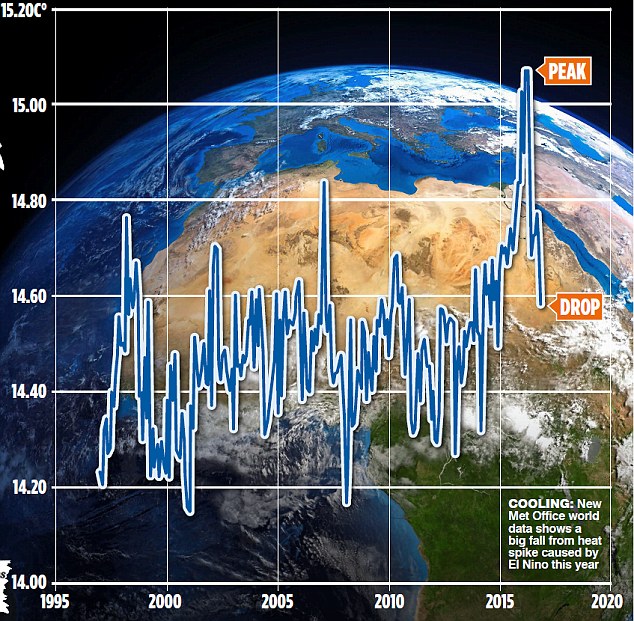
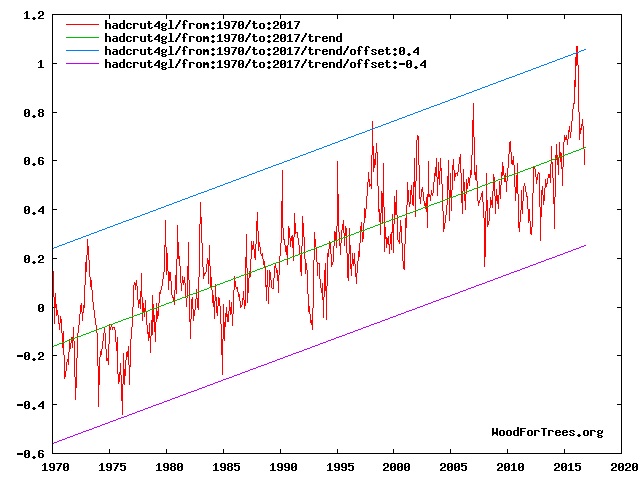
In case you’re also wondering about the objective facts of the matter David Rose quotes with approval “the authoritative Met Office ‘Hadcrut4’ surface record” in his latest article in the Mail on Sunday this very morning:
New official data issued by the Met Office confirms that world average temperatures have plummeted since the middle of the year at a faster and steeper rate than at any time in the recent past.
The huge fall follows a report by this newspaper that temperatures had cooled after a record spike. Our story showed that these record high temperatures were triggered by naturally occurring but freak conditions caused by El Nino – and not, as had been previously suggested, by the cumulative effects of man-made global warming.
The Mail on Sunday’s report was picked up around the world and widely attacked by green propagandists as being ‘cherry-picked’ and based on ‘misinformation’. The report was, in fact, based on Nasa satellite measurements of temperatures in the lower atmosphere over land – which tend to show worldwide changes first, because the sea retains heat for longer.
There were claims – now exploded by the Met Office data shown here – that our report was ‘misleading’ and ‘cherry-picked’.
Yet bizarrely, the fiercest criticism was reserved for claims we never made – that there isn’t a long-term warming trend, mainly caused by human emissions.
This just wasn’t in our report – which presumably, critics hadn’t even read.
We’ve explained all this to David before, yet bizzarely we obviously need to do so again. Here’s the Mail’s version of the latest HADCRUT 4 data from the Met Office:
Can you spot any “cumulative effects of man-made global warming”?
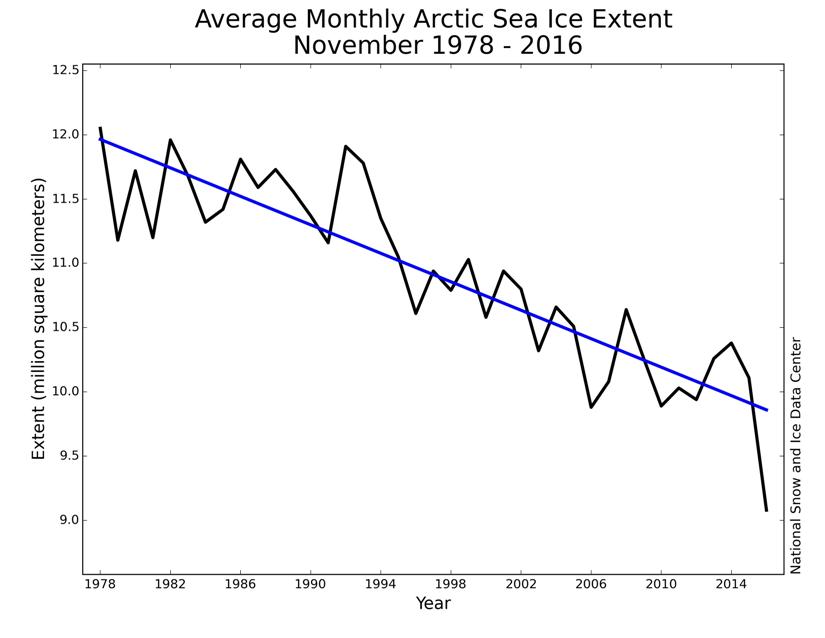
Messrs Smith, Rose, Delingpole, Whitehouse et al. may well be unaware of the fact that the satellite temperature data they’re so fond of cherry picking doesn’t include data from the lower troposphere between 80 degrees North and the North Pole. Just in case they fancy spinning the latest objective facts from the Arctic in the near future, here’s the long term autumnal temperature trend:
This website uses cookies to improve your experience. We'll assume you're ok with this, but you can opt-out if you wish. Cookie settingsACCEPT
Privacy & Cookies Policy
Privacy Overview
This website uses cookies to improve your experience while you navigate through the website. Out of these, the cookies that are categorized as necessary are stored on your browser as they are essential for the working of basic functionalities of the website. We also use third-party cookies that help us analyze and understand how you use this website. These cookies will be stored in your browser only with your consent. You also have the option to opt-out of these cookies. But opting out of some of these cookies may affect your browsing experience.
Necessary cookies are absolutely essential for the website to function properly. This category only includes cookies that ensures basic functionalities and security features of the website. These cookies do not store any personal information.
Any cookies that may not be particularly necessary for the website to function and is used specifically to collect user personal data via analytics, ads, other embedded contents are termed as non-necessary cookies. It is mandatory to procure user consent prior to running these cookies on your website.