No sooner has one of the usual suspects claimed that “Arctic Sea Ice Holds Firm” than a few more jump on the same bandwagon. The Global Warming Policy Forum have republished almost the whole of an article penned by our old friend Paul Homewood entitled “More Of The Usual Hype About Arctic Ice“. According to Paul (and Benny):
Far from collapsing, Arctic sea ice area has been remarkably stable in the last decade
He illustrates his point using a slightly different version of the Cryosphere Today Arctic sea ice area anomaly graph employed by Andrew Montford on March 29th. Here’s the latest version:
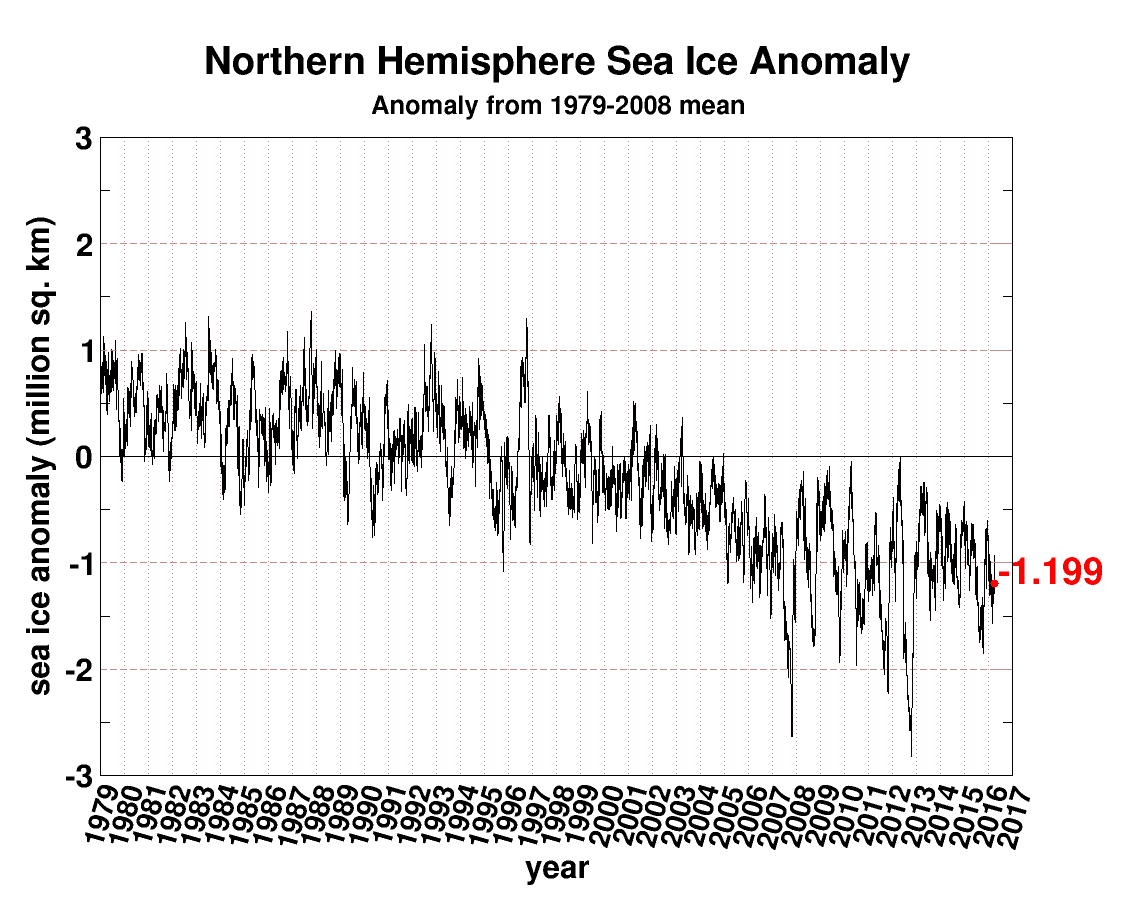
For some strange reason Paul (and Benny) neglect to mention that the current anomaly of -1.199 million square kilometers is the most negative it has ever been for the day of the year in the entirety of the Cryosphere Today record going back to 1979. They also neglect to mention that the CT anomaly is typically much larger in summer than in winter, and that despite that fact the CT anomaly never fell as low as -1.199 at any time of year until 2006.
Make sure to follow the first link above for much more on anomalously misleading area graphs. However Paul (and Benny) are not content with just one misleading interpretation of an anomaly graph. The article continues:
With multi year ice continuing to recover from 2008 lows, ice volume has also been growing in the last few years.
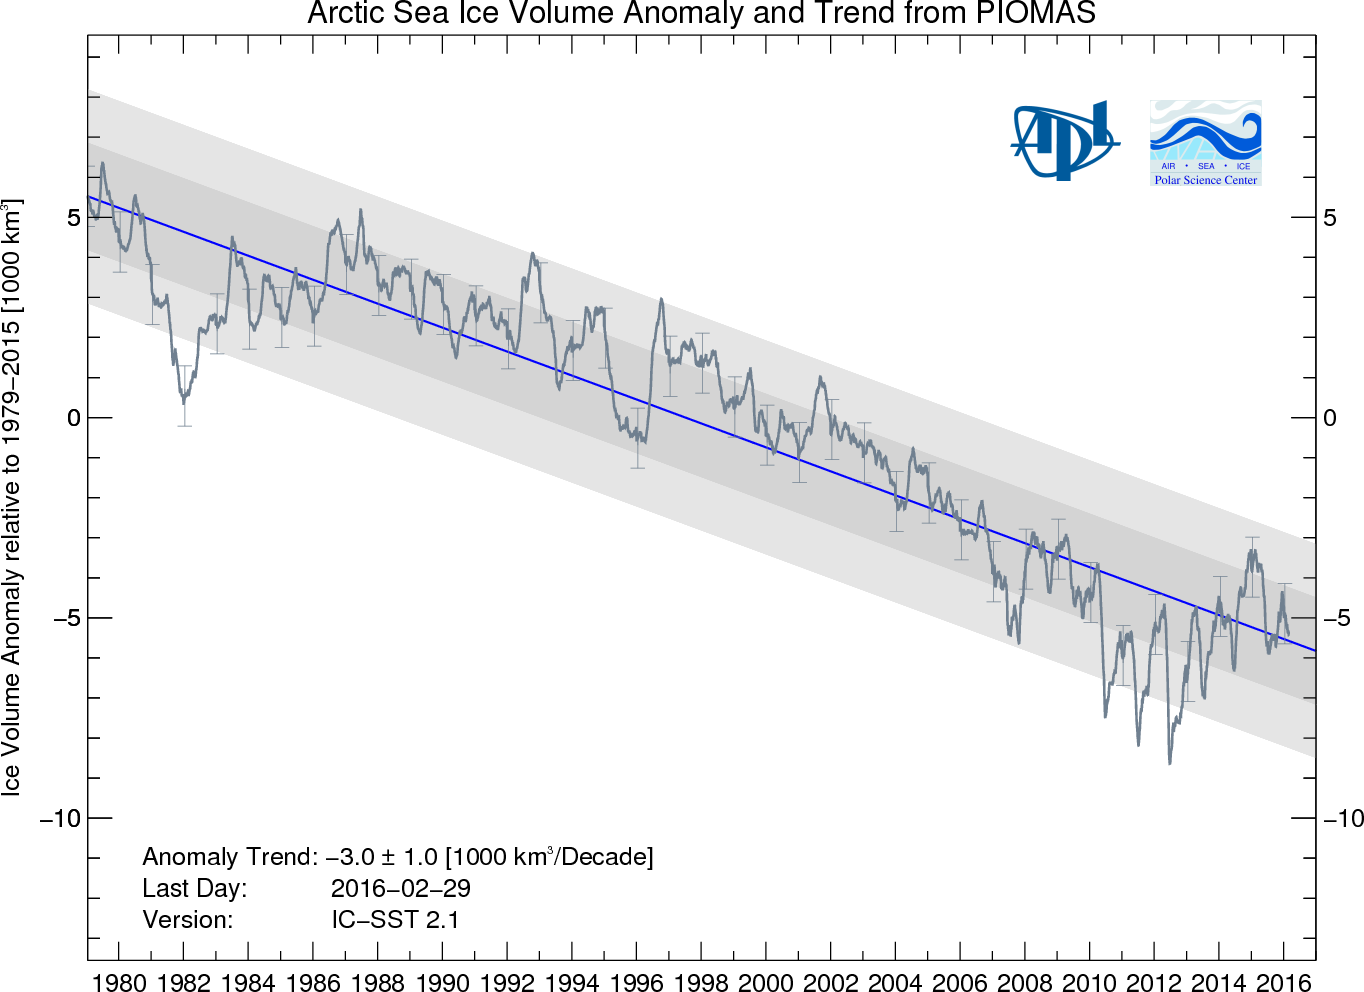
Whilst we all eagerly await the release of the PIOMAS Arctic sea ice volume numbers for March 2016, here is an alternative visualisation of the data from Chris Reynolds:
Volume is the second lowest on record [for February] since 1978 at 20.660 thousand km cubed
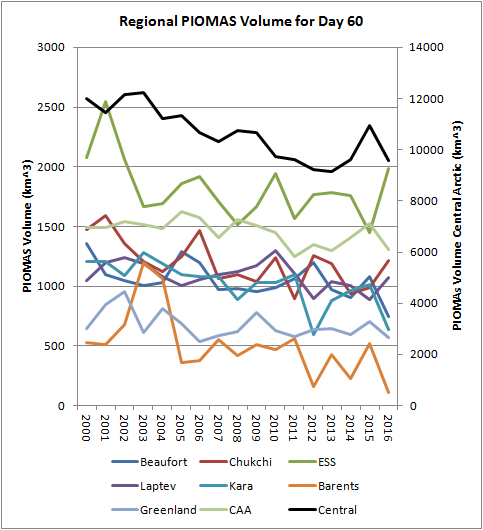
In the Central Arctic, where it matters most, sea ice volume at the end of February was only a whisker above where it was in 2012, according to PIOMAS at least. For those with short memories the CT Arctic sea ice area metric reached an *all time low of 2.23401 million square kilometers on September 13th 2012, and an *all time low anomaly of -2.81817 million square kilometers on October 14th 2012.
*Since the Cryosphere Today records began