A selection of graphs, images and videos from the Northern Sea Route.
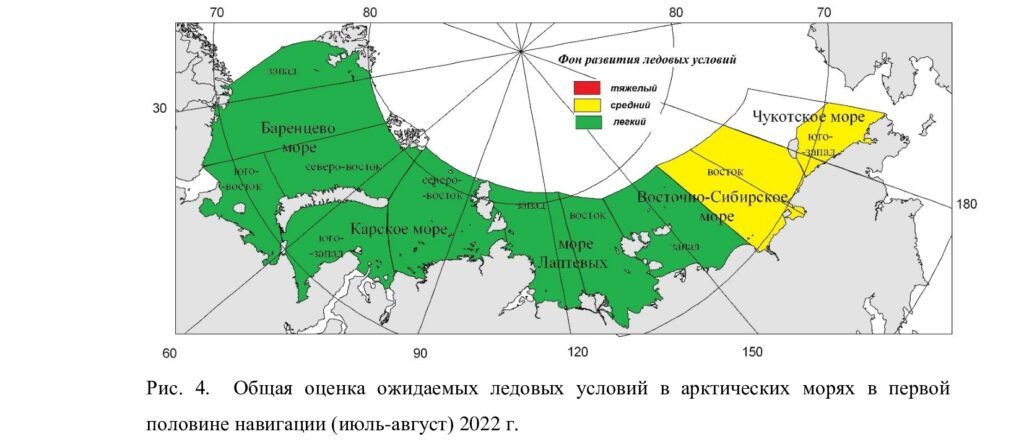
Here’s the official long term forecast for June-August 2022 as of June 17th 2022:
Here’s the current list of vessels ready and waiting to voyage along the NSR:
http://www.nsra.ru/en/rassmotrenie_zayavleniy/perechen_zayavlenii.html
On July 19th 2016 there were 463 entries.
On July 17th 2015 there were 477 entries.
Here’s the report on transit statistics for the NSR in 2015. Here’s the 2014 version, and here’s the accompanying video:
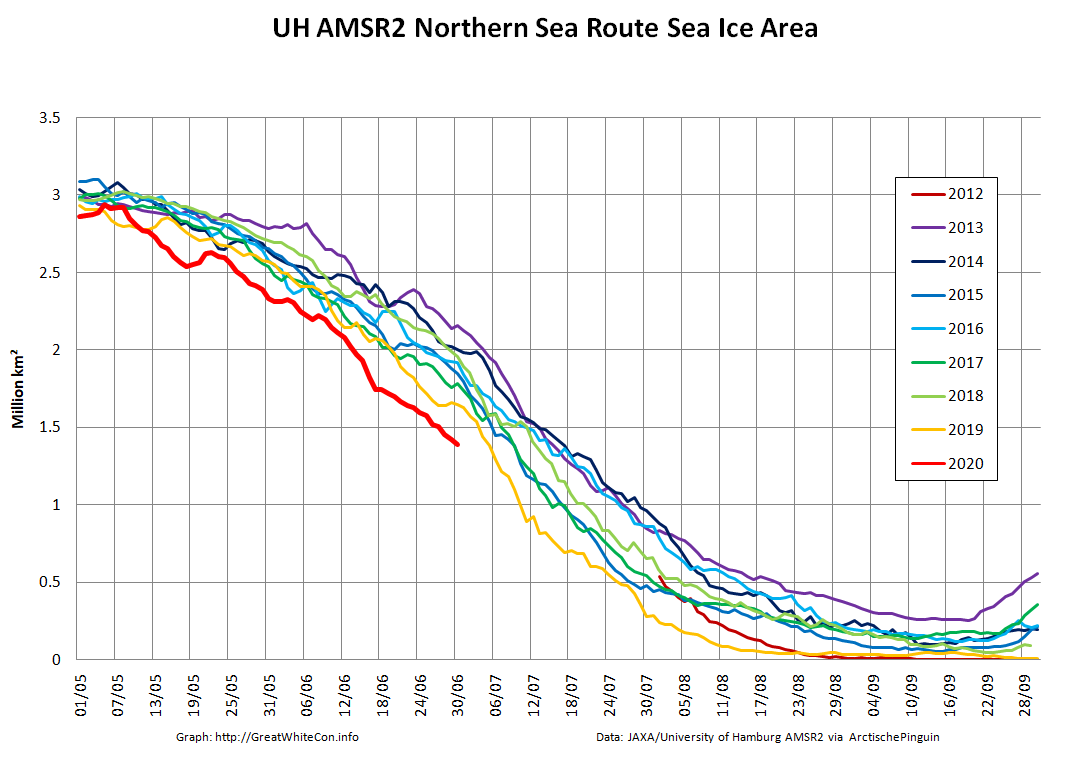
Northern Sea Route Sea Ice Area

Here are some animations of sea ice movement along the Northern Sea Route from 2012 to date:
See also our Arctic sea ice graphs overview page, our Arctic ice mass balance buoys overview page, our Arctic sea ice images page and our Arctic sea ice videos page.
Constructive technical criticism is welcome on the introductory blog post. For discussions about interpreting the information please comment on the “About Our Arctic Sea Ice Resources” page.

How come the Northern Sea Route Sea Ice Area graph doesn’t show 2020?
Because I hadn’t updated it since last year!
Now fixed.
Sorry to be a bugger, kind Sir
Jebus, HELP !!!!!!
Hey, Jim, aren’t you so glad the 50 day forecast recorrected itself it realised imminent doom is not on the cards : atleast today
I, for one, can breathe now……