On June 17th 2014 the Danish Meteorological Institute (DMI for short) published a news article which said amongst other things (and translated from the original Danish) that:
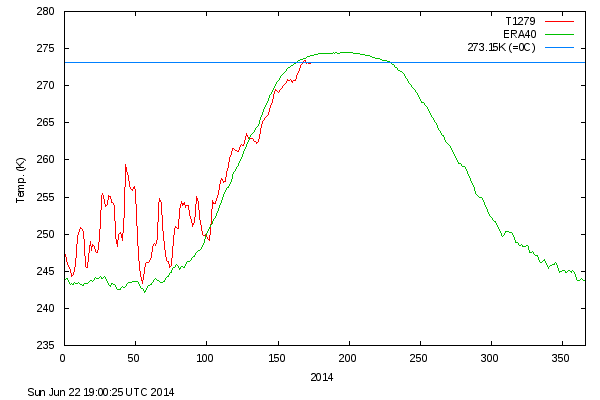
On Tuesday, June 17, 2014 daily mean temperature of the Arctic area north of the 80th northern parallel rose above the melting point. Thus, the summer melting season in the central part of the Arctic Ocean has begun.
Here’s the DMI’s graph that is being referred to:

The DMI’s news article continues:
This year’s onset of melting is 7 days later than usual and 2 weeks later than in 2012, when later in the season – in September – the sea ice shrank to the smallest area ever measured.
According to Rasmus Tonboe, one of the DMI’s sea ice experts from their Centre for Ocean and Ice:
There is a clear correlation between the start date of the melt season in June and the area of the same year’s minimum ice coverage in September. When the season starts later than the year before, then extent in September is more than the year before – and vice versa. This applies in 4 out of 5 cases since 1972.
As you might expect the usual suspects have greeted this news item with unconcealed glee. According to Steven Goddard on his so called “Real Science” blog the news is the “Alarmists’ Worst Nightmare – They Have Already Lost 15% Of The Arctic Melt Season”:
Them:
The Sun has begun its descent towards winter, and the high Arctic melt season hasn’t started yet.
Us:
As is usual these days, Steve has neglected to publish my comment on his article, which reads as follows:
By way of an explanation for my cryptic comment, Steve seems happy to ignore that fact that the graph shown above reveals that the metric under consideration was way above “average” for the entire 2013/14 Arctic sea ice freezing season, as we ourselves pointed out not so very long ago. 2014’s numbers have only been lagging behind “normal” since around day 130. Perhaps this will prove to be enough of a difference from Rasmus’s historical records such that the 2014 melting season will be one of the exceptions that proves his “4 out of 5 rule”?
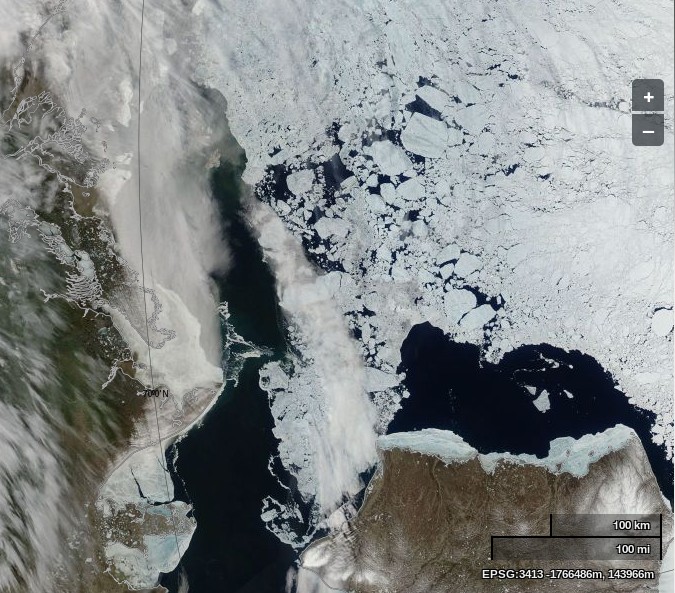
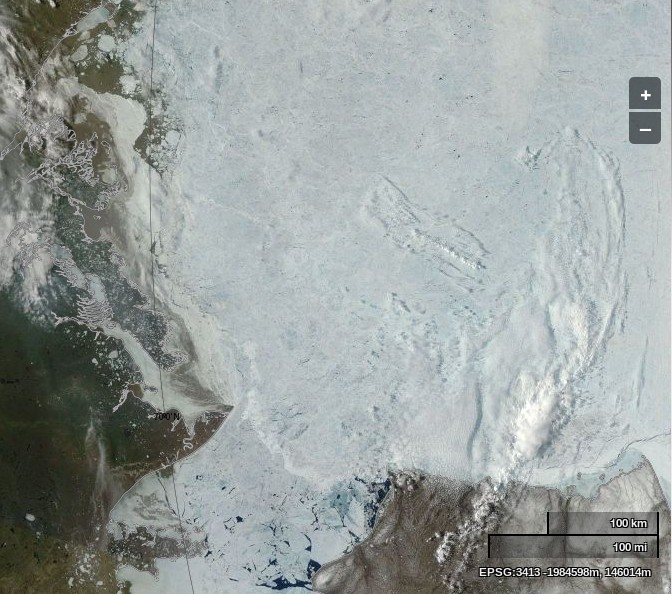
As some sort of support for this theory we suggest you take a good long look at our regional Arctic sea ice extent breakdown and our ice mass balance buoy overview. The sea ice extent in the Central Arctic Basin is currently much the same as last year, with barely any visible reduction in extent as yet. However in important areas for the overall Arctic sea ice extent in September, such as the Laptev and Beaufort Seas, the melt in 2014 is way ahead of 2013. In the former case the melt is even ahead of 2012 at the same time of year.
Do you suppose that Steve will be able to spot the difference between these two satellite images, taken one year apart?


We’ll keep you posted!

Thanks Jim, your comment about volume as against extent has had me amused for sometime.
It is a crippling blow to Watts. The analogy that has come to mind is being offered the choice between two pieces of gold; one weighing 250 grams but hammered out into a sheet, the other being in a small chunk but weighing 350 grams.
’tis interesting that the mean temp. above 80 degrees latitude is tracking a degree or so below normal – very similar to 2013. will that slow down the melt somewhat?
Phil – Here’s a different view on roughly the same sort of data. This is a time series of 2m temperatures north of 80 degrees from the NCEP/NCAR reanalysis instead of ERA40. Note that the big melt years of 2007 and 2012 don’t show particularly high values!
The chart is for May/June only at the moment. It will be interesting to see what it shows when the July numbers are in