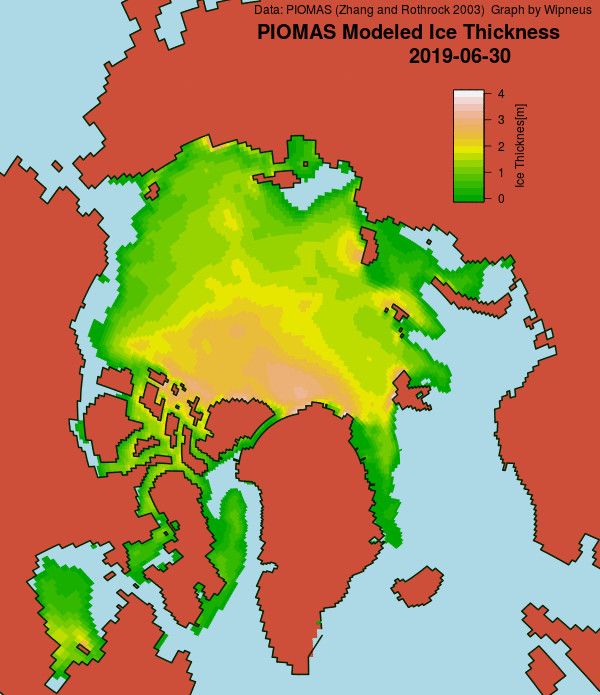
The June PIOMAS Arctic sea ice gridded thickness numbers have been released. Here once again is Wipneus’ visualisation thereof:
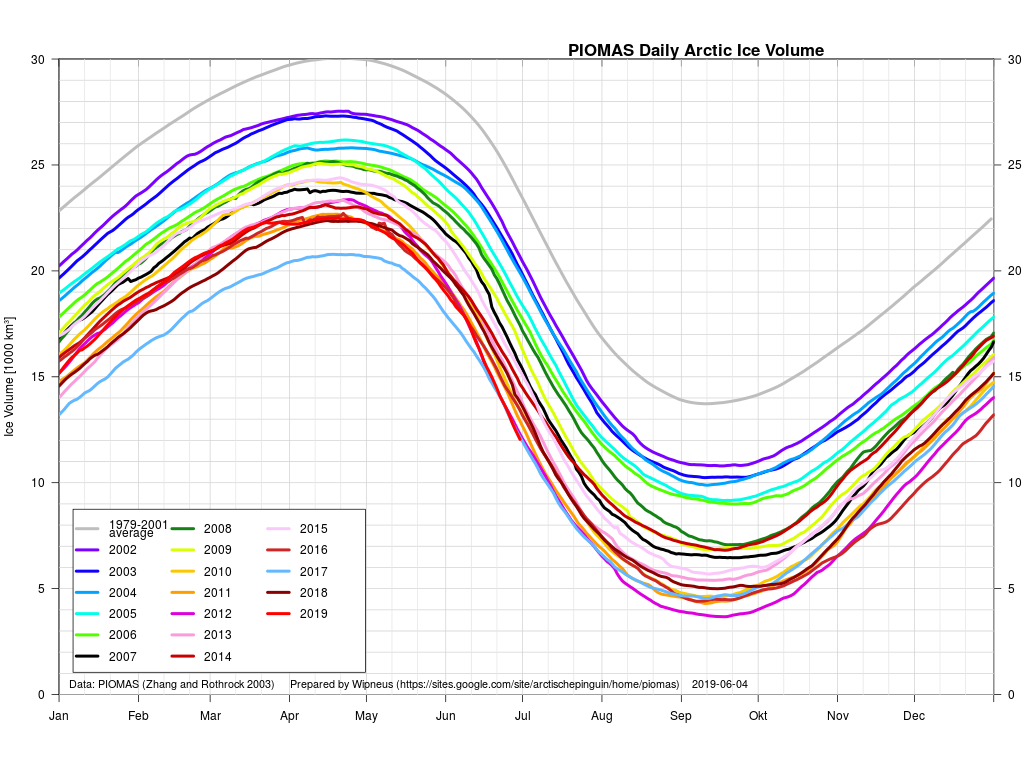
The Arctic wide volume graph does not make a pretty sight:
The recent rapid rate of decline has continued through the second half of June and PIOMAS modelled volume is now lowest for the date in the Polar Science Center’s records.
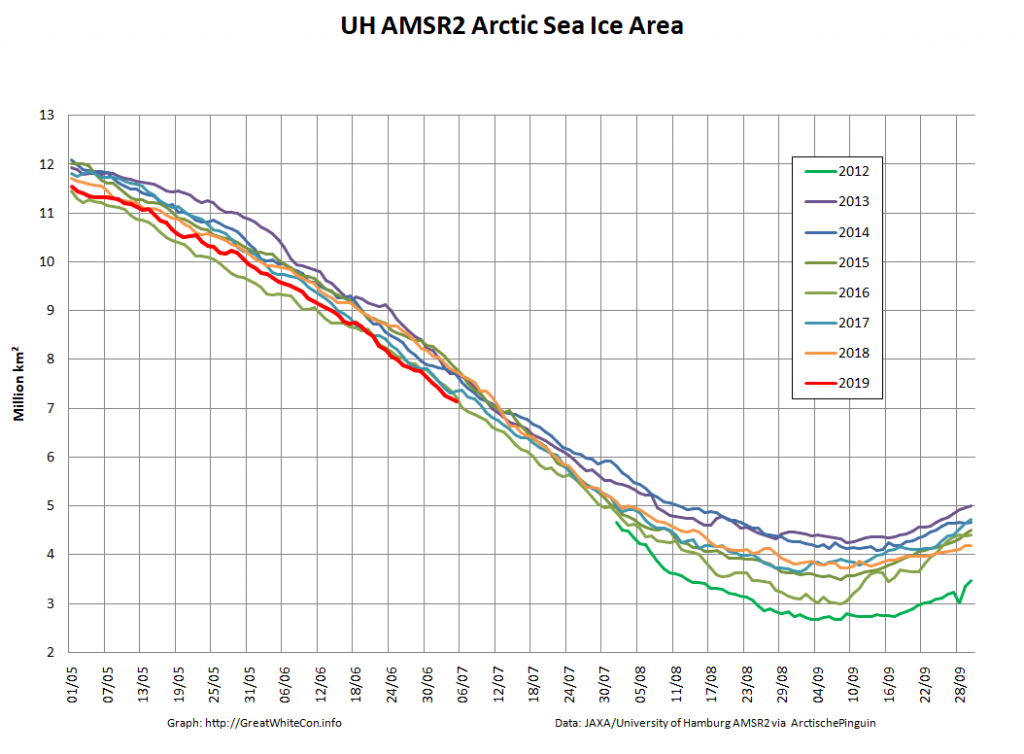
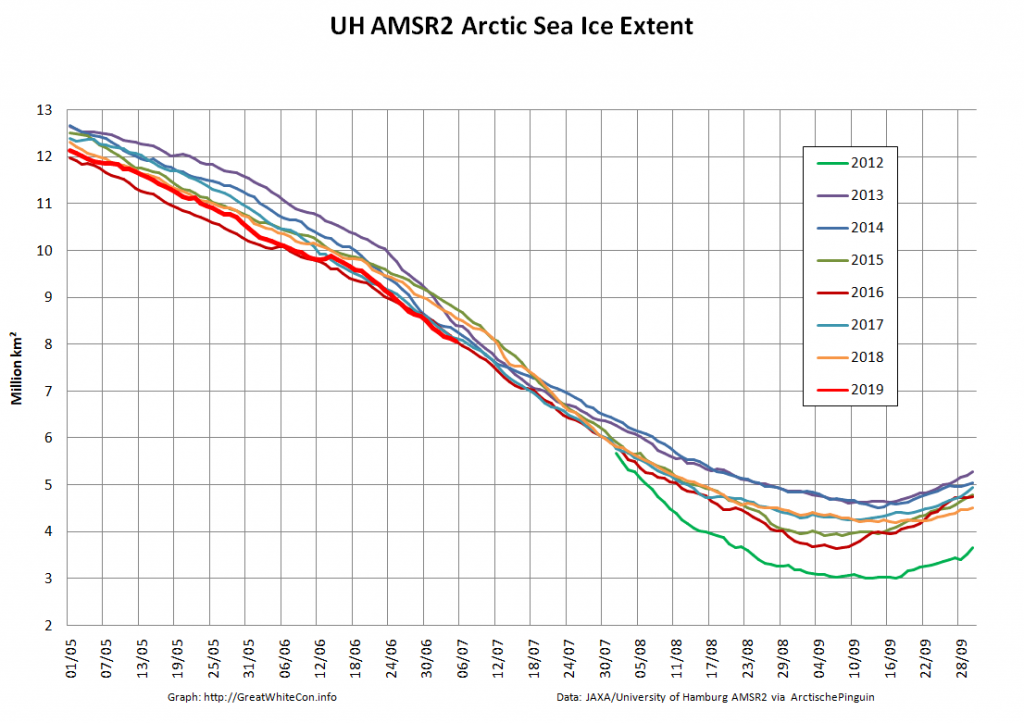
The various methods of measuring Arctic sea ice thickness don’t produce meaningful results during the summer, so let’s move on to area and extent. Arctic wide high resolution AMSR2 area and extent remain “lowest for the date”, although it currently looks as though 2016 may regain that dubious honour in the near future:
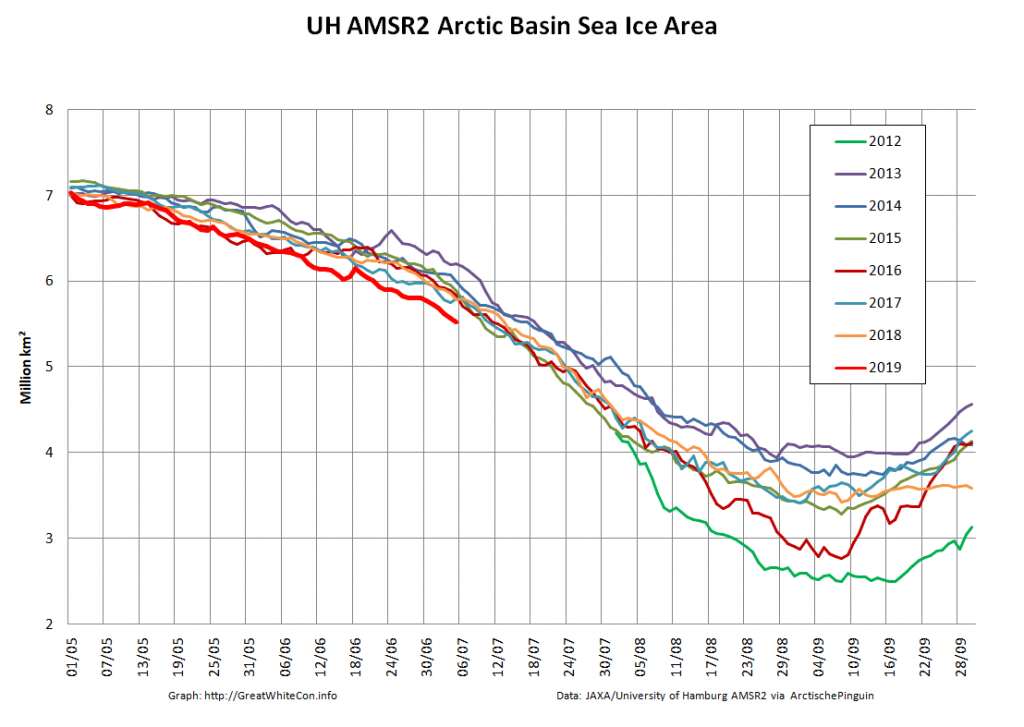
Confining the view to the Arctic Basin there is no doubt that 2019’s position will not be in doubt for quite some time:
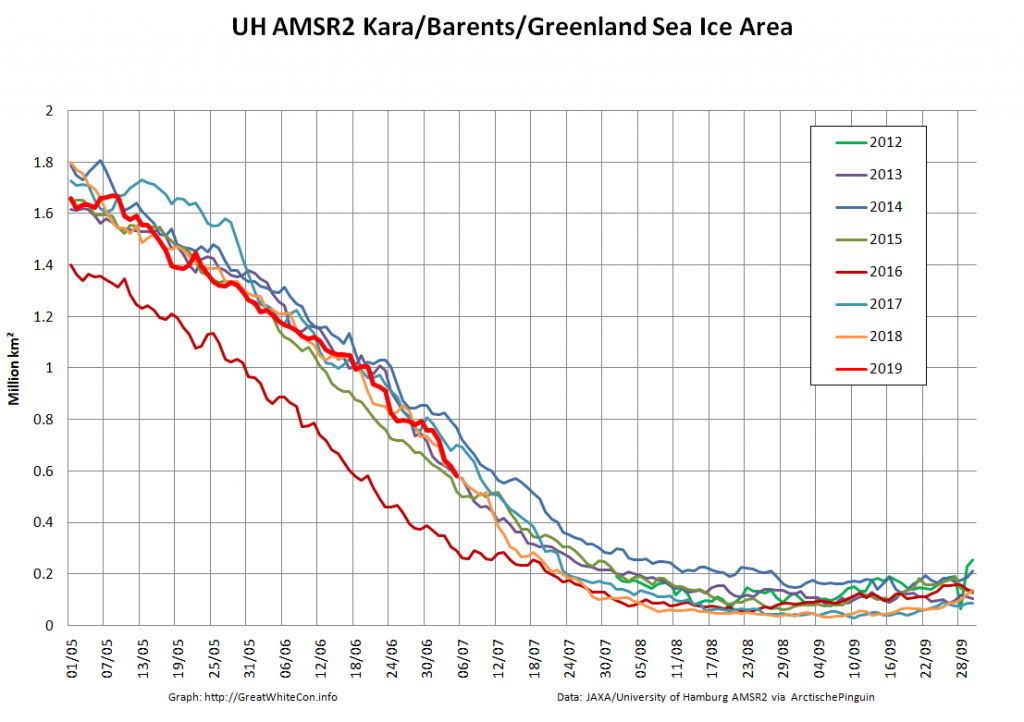
The apparent discrepancy is explained by taking a closer look at the Atlantic side of the Arctic:
Some of the thicker ice that has continued to be exported from the central Arctic in the direction of the North Atlantic is surviving there, for the moment at least.
Watch this space!
Great update, Jim!
BTW, do you think there’s a correlation between how eager people are to see e.g. June volume numbers, and the extra time UW takes to publish them? I notice they’re still not out, only the graphics.
June melt: If my computer is correct, 2019 didn’t melt more ice in June than 2012 did, but June 2019 melt’s share of the winter max (total available ice) was greatest on record, with 31.4% and 31.2%, respectively.
This will amuse you Jim!
https://wattsupwiththat.com/2019/07/30/shockingly-thick-first-year-ice-between-barents-sea-and-the-north-pole-in-mid-july/
[Link target archived – Mod]
Flailing about with not even a berg to stand on can be amusing. Straight from Susan “everything’s cool with Polar Bears” Crockford.