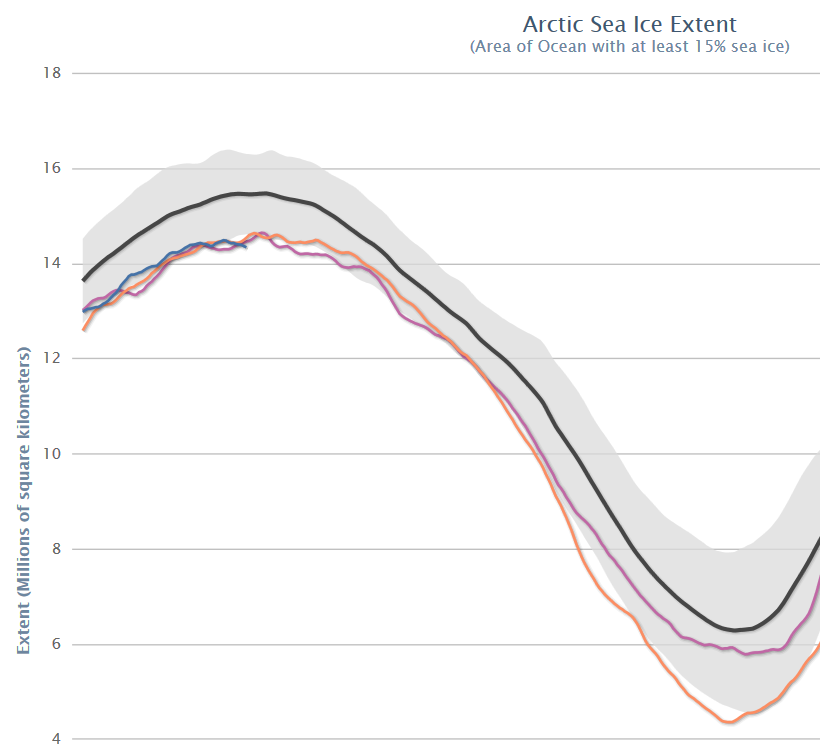
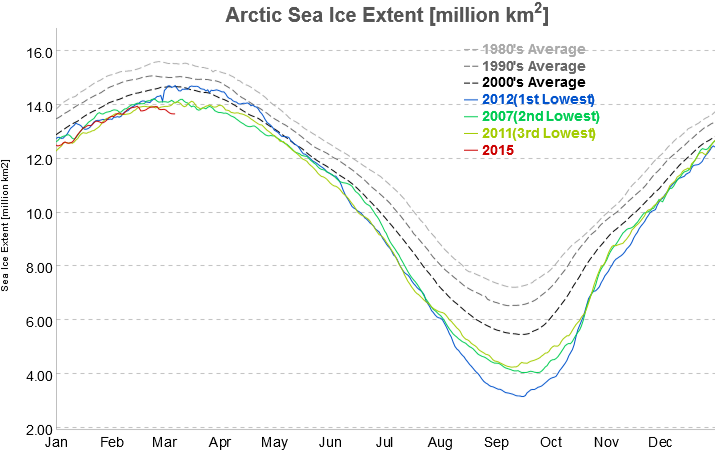
As we reported on February 18th, some of the Arctic sea ice extent metrics reached the lowest levels for the date in their respective histories quite some time ago. Today though, we’re looking at a full house. The daily NSIDC and IJIS extent numbers have both been at all time lows for the date for quite some time now. Here’s how the NSIDC 5 day average extent looks at the moment:
and here’s the IJIS/JAXA daily extent:
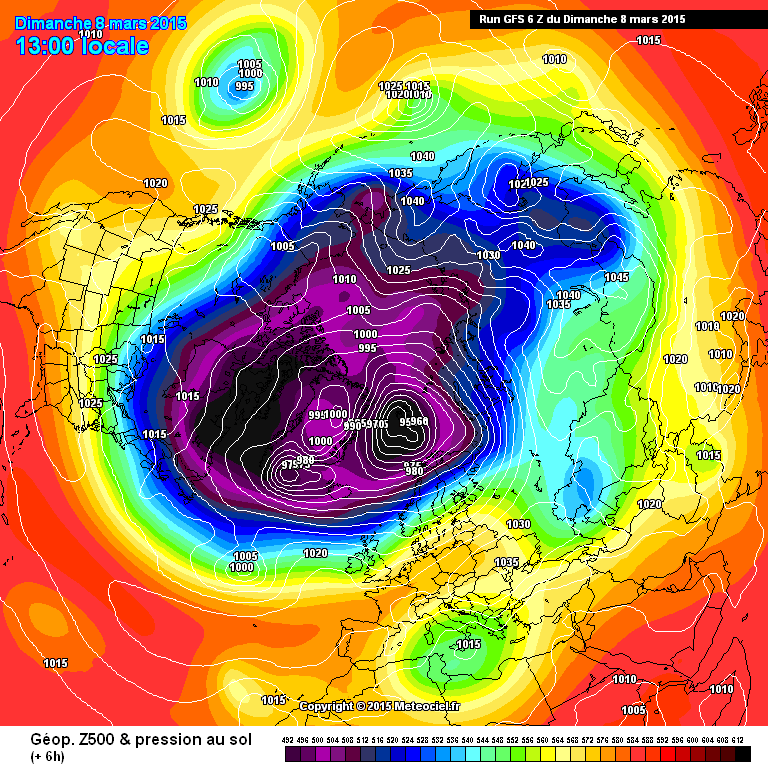
Meanwhile a series of storms in the North Atlantic have been bringing large surf to the shores of the Western United Kingdom, and battering the edge of the sea ice in the Greenland and Barents Seas. Here’s how GFS looks currently, as visualised by MeteoCiel:
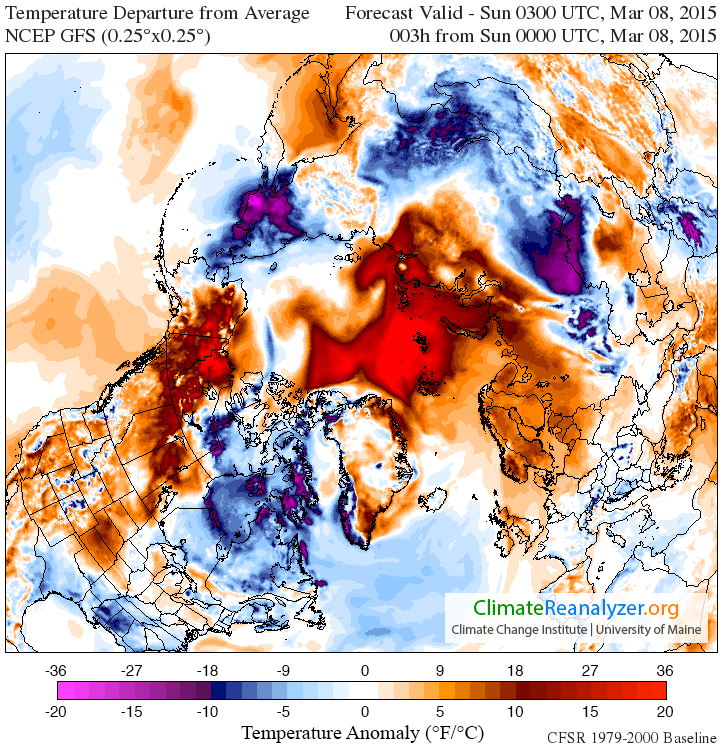
In addition this has resulted in warm air from further south being funnelled into the high Arctic, so much so that the surface temperature anomalies currently look like this:
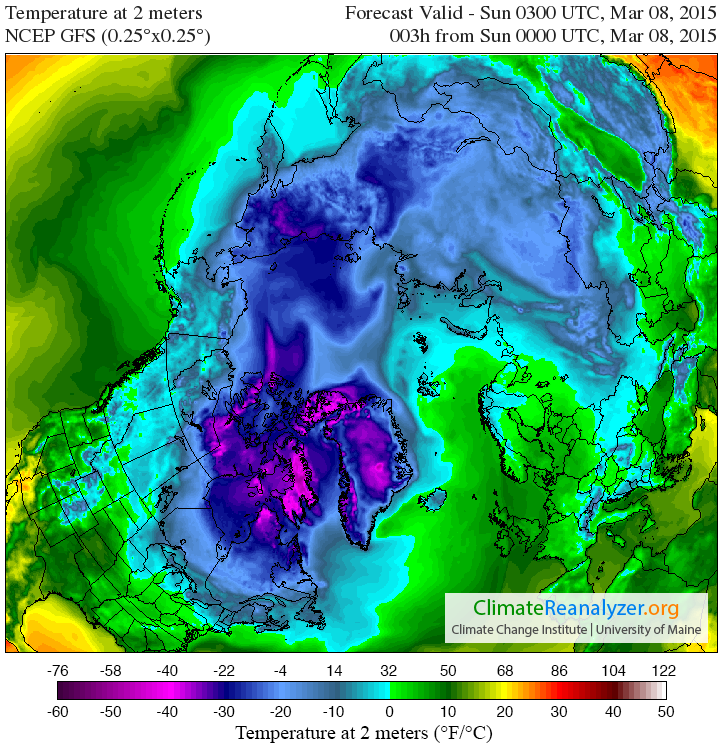
whilst the temperatures 2 metres above the surface of the Arctic look like this:
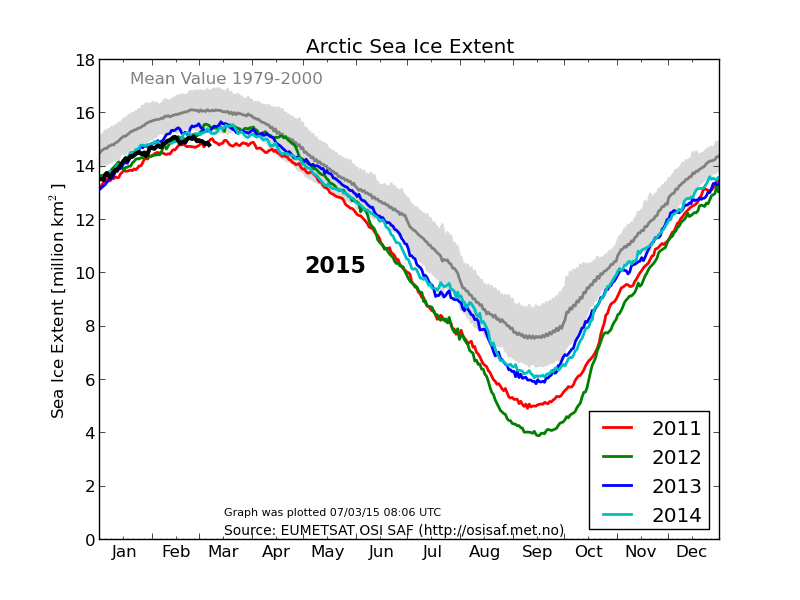
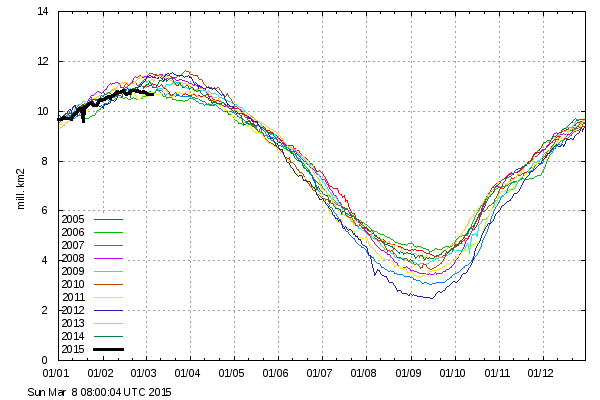
If you look closely you’ll see that air temperatures 2 metres above the North Pole are currently similar to those around the shores of the Great Lakes of North America. As a result of all this atmospheric activity today we bring you news that both the Danish Meteorological Institute “new” 15% extent:
and “old” 30% metrics:
have now joined the club.
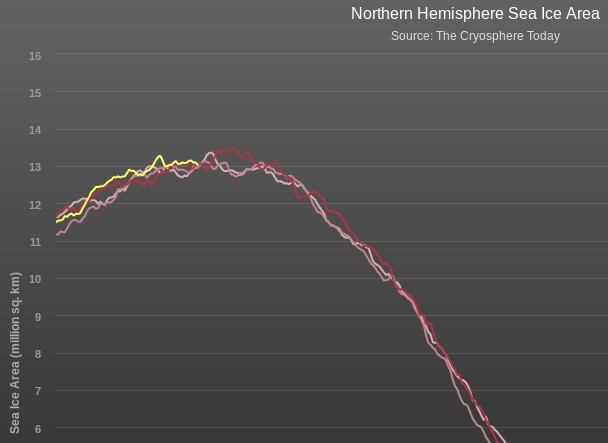
The Cryosphere Today area metric has been holding out against the trend in sea ice extent for weeks, but we can confidently predict that when their next update is released it too will also reveal the lowest ever Arctic sea ice area for the 65th day of the year, in records going back to 1979. Here’s how their graph looks currently:
What did we tell you?