For reasons that will take too long to explain just at the moment I answered a question asked by Ron Clutz over at Paul Homewood’s “Not A Lot Of People Know That” blog. Having done that I had a quick look round and discovered that unlike most of his “skeptical” friends Paul is writing almost as many posts per day about sea ice as I am! Needless to say he’s raking over the coals of his “Gross Deception” article from last year.
Yesterday he published another article on the topic of Arctic sea ice, entitled “DMI’s Missing Graph“, in which he claims:
For the last few months, there has been a widening divergence between the two Arctic sea ice extent graphs produced by DMI…
Now there may be good reasons for this difference, and it must be pointed out that DMI has never stated that there is any problem with the 30% version, or reason to doubt it…
But the real problem is that DMI has now withdrawn their 30% graph, offering this explanation:
“I have removed the old sea ice extent graphics and the new graphics (http://ocean.dmi.dk/arctic/icecover.php) is now our one and only official sea ice extent.
When I introduced the new graphics I also announced that the old graphics would be removed after some time – and now is the time, sorry.
I spend too much time explaining the differences and it was quite confusing for many – so, I decided to remove the old graphics. However, all the data are available here http://osisaf.met.no/p/ if you would like do the plotting your selves.”
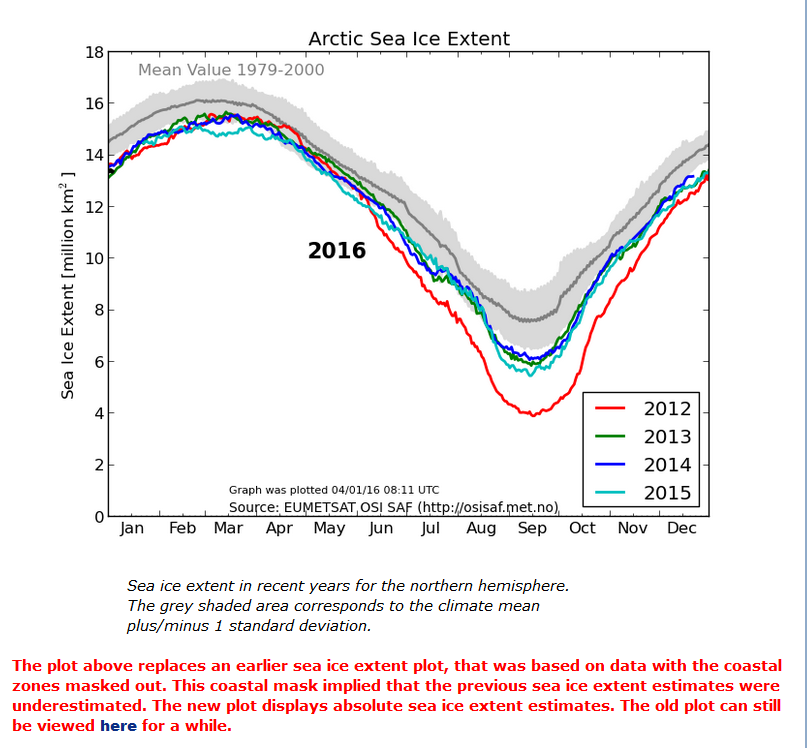
The real problem would instead seem to be that Paul Homewood cannot read, and DMI have in fact been offering a good reason to anyone with eyes to see for many months. We explained all this only the other day, but nonetheless here is an example of the DMI’s 15% threshold extent graph from earlier this year, carefully preserved for posterity in a secure archive deep in the ice shelf underneath the Great White Con Ivory Towers:
For those poor souls amongst us currently afflicted by acute snow blindness it says in bright red lettering, amongst other things:
The plot above replaces an earlier sea ice extent plot… The old plot can still be viewed here for a while.
For the moment at least the last word on the matter must come from the Danish Meteorological Institute, who report via the @PolarPortal on Twitter that:
Latest sea ice plot from @dmidk shows lowest ever #Arctic sea ice extent for time of year. https://t.co/qWl8uIezvi pic.twitter.com/n5sIPdHlS5
— Polar Portal (@PolarPortal) February 19, 2016
[Edit – February 21st 2016 at 21:30 UTC]
The gross deception increases! Not a lot of people know that all my comments on Paul Homewood’s blog are now hidden from view, on the pretext that I’m a troll. Paul really must be blind if he thinks Snow White resembles a troll in any way shape or form. Here’s what some trolls actually look like:
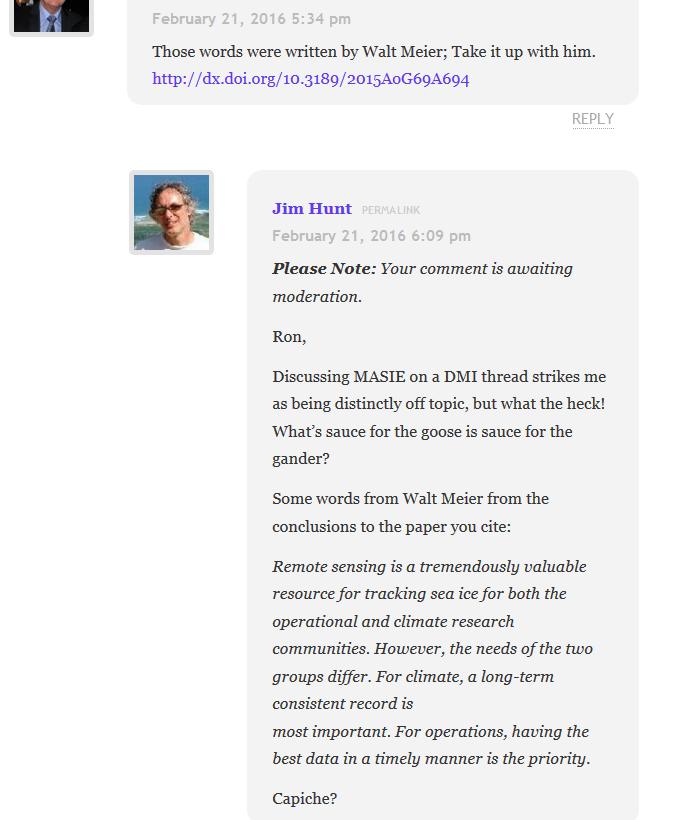
The thread about DMI’s deprecated graph has degenerated into a free for all about MASIE, when there’s already a thread over there for the discussion of that thorny topic. More on MASIE in due course, but let’s try and stick with DMI extent here. Unlike Paul Homewood and Ron Clutz, who no doubt welcome the distraction!
Them:
Jaime – With regard to the apparent ‘conundrum’ regarding the significant increase in 30% SIE and the lack of increase 15% SIE. It seems to me – and correct me if my logic is faulty – that the ‘at least 30% concentration’ increase tells us that the area of more consolidated ice has increased relative to previous years. The ‘at least 15% concentration’ lack of increase (or decrease) tells us that the less consolidated ice edge area has not increased significantly compared to previous years and may even be declining.
Us:
What “at least 30% concentration increase” would that be then Jaime?
[This is currently visible – mod]
Them:
Pethefin – “at least 30 % concentration” = minimum 30 % concentration = ice coverage with concentration equal to or higher than 30 %. Anyone with the slightest ability to think for themselves would be able to figure it out. Trolls however…
Us:
[This is currently invisible – mod]
Them:
Jaime – Jim, that increase shown in comparison with earlier years by the discontinued DMI graph shown above, starting in September and culminating with the large difference notable right up to mid February.
Us:
[This is currently invisible too – mod]
I’m sure you get the general idea by now. All of which means that not a lot of people know that if you were to follow the sound advice that DMI gave Paul Homewood and “do the plotting yourself” using the open source software and support made freely available on the Arctic Sea Ice Forum you would discover that (surprise, surprise!) 30% threshold Arctic sea ice extent on February 20th 2016 was significantly less than on the same date in 2015.
[Edit – February 21st 2016 at 22:30 UTC]
And here’s the coup de grace. Before and after the wielding of the NALOPKT red pencil:
Before:
After:
[SNIP]
Jim
I have already warned you.
You have already posted eight comments on just one article, none of which had the slightest relevance to the original post, not to mention several more.
All you have done is disrupted the comment thread. I am aware that you have attempted to do exactly the same on other blogs. I am not prepared to allow you to do the same here.
If you want an argument, I suggest you decamp to Disqus, or better still go and argue with yourself on that pathetic little blog of yours, which very few people appear to read.
You are on your final chance. If you have any relevant comments to make, they will be welcome. But any more trolling, and you will be banned.
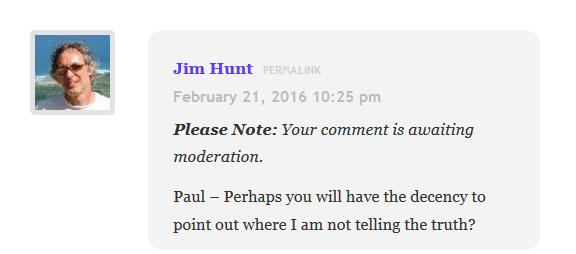
BTW – If you want to slag me off on your own rarely visited site, as you have before, perhaps you might at least have the decency to tell the truth
Paul
[Edit – February 22nd 2016 at 10:00 UTC]
You will note from the comments below that Lawrence Martin has also now fallen foul of the “Not A Lot Of People Know That” censor red pencil. Next in line looks like it will be Neven Acropolis from the Arctic Sea Ice Blog, who is currently still permitted to valiantly fight the good fight:
I’m not interested in why the DMI replaced their 30% SIE graph with a 15% SIE graph, because a switch from 30% to 15% isn’t all that exciting. Perhaps it is for someone who doesn’t understand the difference, but it isn’t for me.
And it’s not like they did it all of a sudden. The graph was replaced months ago, with the announcement that the old graph would be discontinued at some point.
I’m also not interested in why the graph was in error. What’s interesting about that? Why would I want DMI people who have lots of different stuff to do, to spend time and money on something that bears no relevance to anything, except to some guy who thinks it’s a all big conspiracy?
Them:
Notice how Neven The Gullible avoids answering or commenting any of these questions.
Us:
 [This is also currently invisible – mod]
Them:
We’ll keep you posted!

Our old friend Reggie coined the term WAR to describe what the science deniers are creating… Wingnut Alternate Reality.
Peter Hadfield calls the move the Monckton Maneuver
I see you’ve had “The Snip” at NALOPKT too Lawrence. And been awarded a “Troll” badge. I trust that you will wear it with pride?
I call it “How to Upset a Global Warming Sceptic” episode two.
And the science deniers wonder why we describe their blogs as circle jerks and echo chambers, Willard watts has picked up on the DMI conspiracy and one of the participants in yesterday’s conversation at Paul’s science fiction blog has posted this at WUWT. http://bit.ly/1Uin0Hc
I think that from now on all references to Homewood and NALOPKT should just be “Paul’s Science Fantasy Blog.”
As one who has taken a stance on skiffy vs sigh-fie, hard sf vs soft sf, and other mnemonic wars in the SF&F world – ‘science fantasy’ tells the reader that belief and knowledge of actual science is not germane to the story being told.