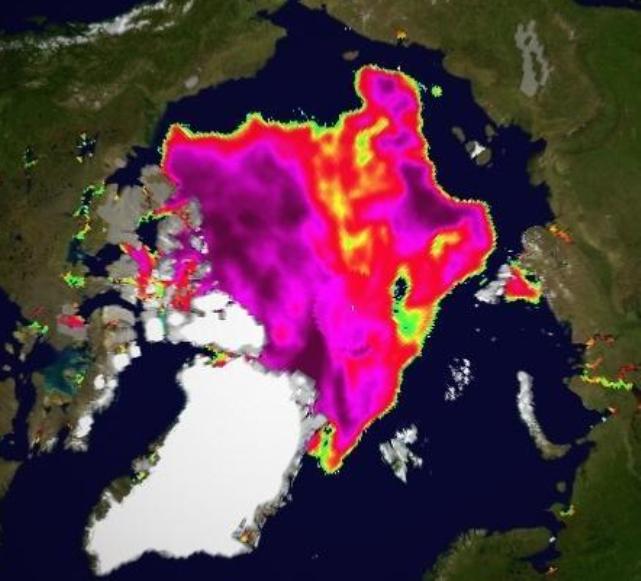
Regular readers may recall that way back when in September 2013 we wondered why David Rose hadn’t seen fit to reproduce any visualisations of Arctic sea ice concentration in a previous article about Arctic sea ice, particularly when his source materials from the NSIDC contained some very nice examples.
Today we are pleased to be able to inform you that David has now followed our long standing advice, and his article in the Mail on Sunday yesterday included two such “stunning satellite images”. Of course they are not really “photographic” images, any more than the visualisations of Arctic sea ice extent that David was so keen to show his loyal readers last time around were. Unfortunately David neglected to include a “stunning satellite concentration visualisation” for August 25th 2013 in yesterday’s article. We are pleased to be able to help correct that no doubt inadvertent oversight, albeit somewhat belatedly, with the able assistance of the Department of Atmospheric Sciences at the University of Illinois and their Cryosphere Today web site:

Paraphrasing David Rose’s article yesterday, can you see all the yellow and green areas denoting regions where the ice pack is least dense?
Can you see “an unbroken ice sheet more than half the size of Europe stretch[ing] from the Canadian islands to Russia’s northern shores”?
Can you see Santa’s secret summer swimming pool, just a short sleigh ride away from his natty North Pole residence?
Answers on a virtual post card please, to the address below.