This is the Great White Con version as opposed to the NOAA version published during the Fall AGU conference earlier this week, although there is some overlap.
Hot off the presses, here’s how Arctic sea ice age has progressed over the last year and a bit:
The 4 and 5 year old ice looks to be edging away from the area north of the Canadian Arctic Archipelago towards the Fram Strait. Here’s the current CryoSat-2 Arctic sea ice thickness map:
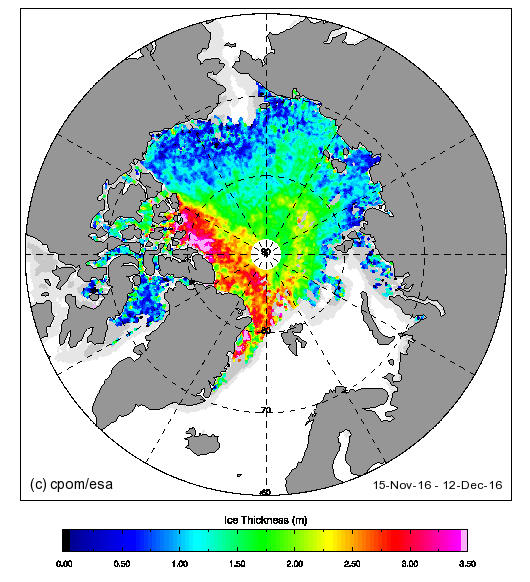
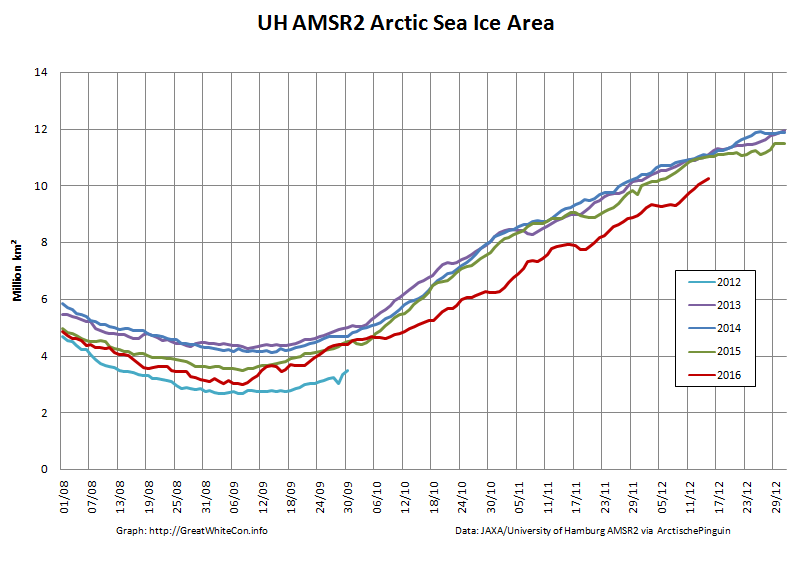
Almost no ice over 2 meters thick to be found in the Beaufort sector or anywhere on the Siberian side of the Arctic. Here’s the current AMSR2 Arctic sea ice area graph:
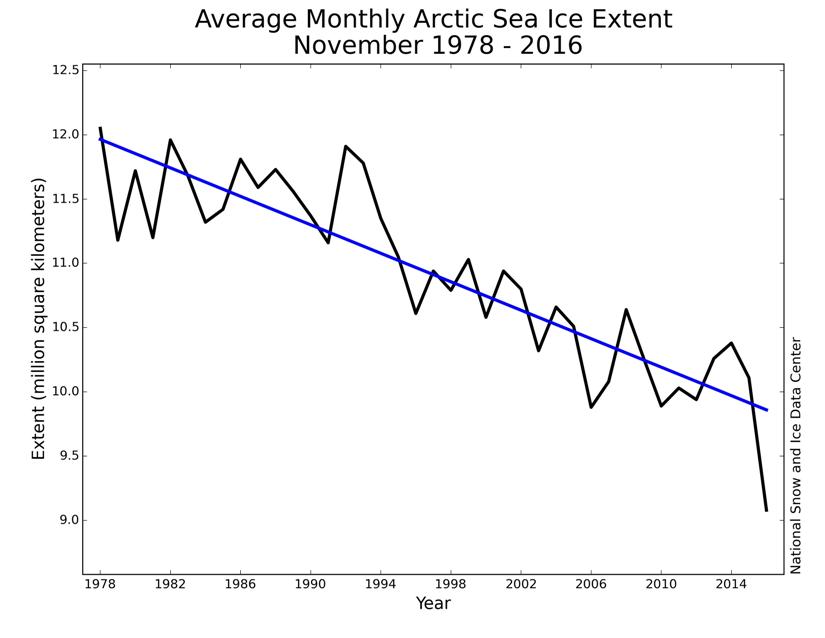
Lowest for the date in the satellite record. Here’s the NSIDC’s long term trend in November sea ice extent:
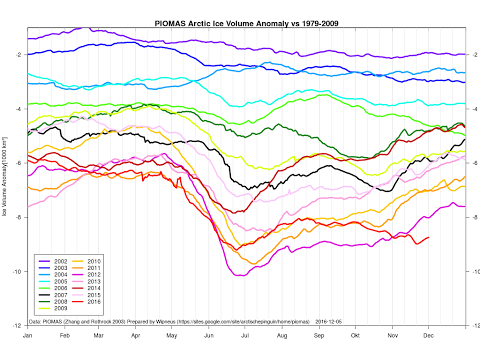
Act 1 of a 3 act play according to Don Perovich at AGU. Here’s the current PIOMAS Arctic sea ice volume anomaly graph:
Lowest for the date in the satellite record. Here’s NOAA’s Arctic and global surface temperature graph:
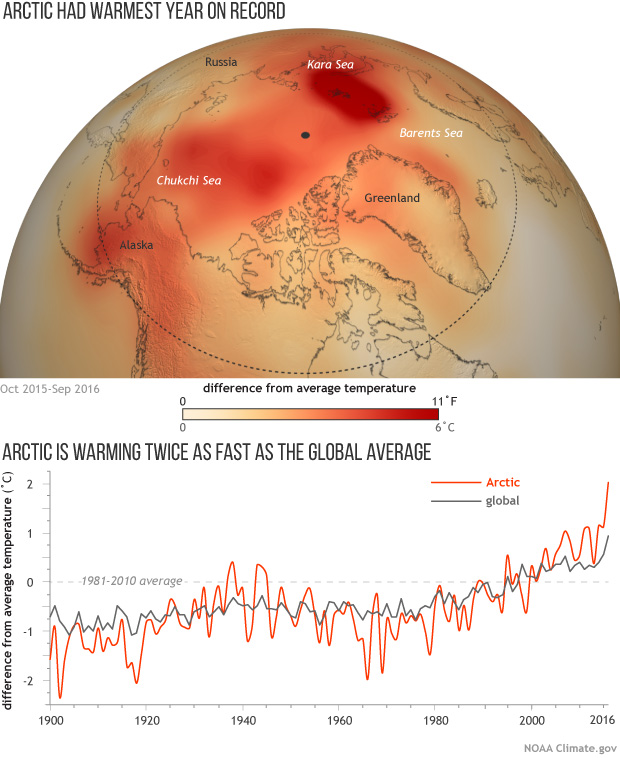
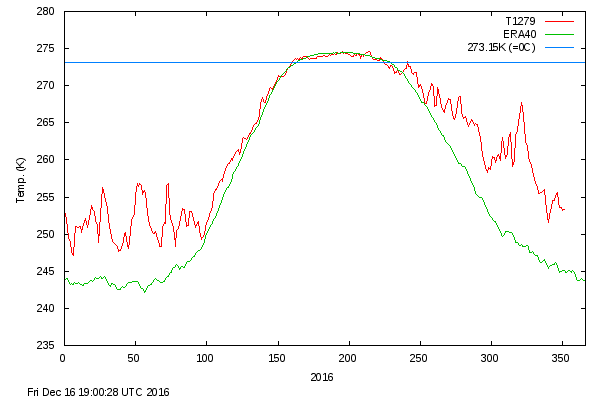
Warmest in a record going back to 1900. Here’s the current DMI >80N surface temperature graph:
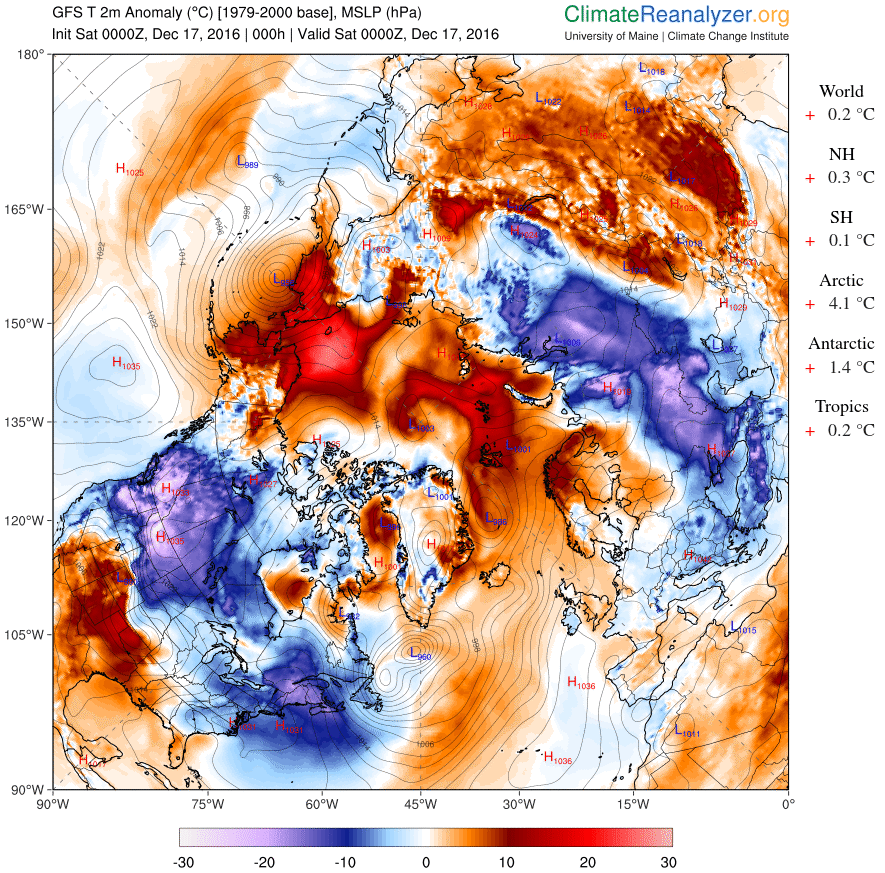
and here’s the current Arctic surface temperature anomaly map:
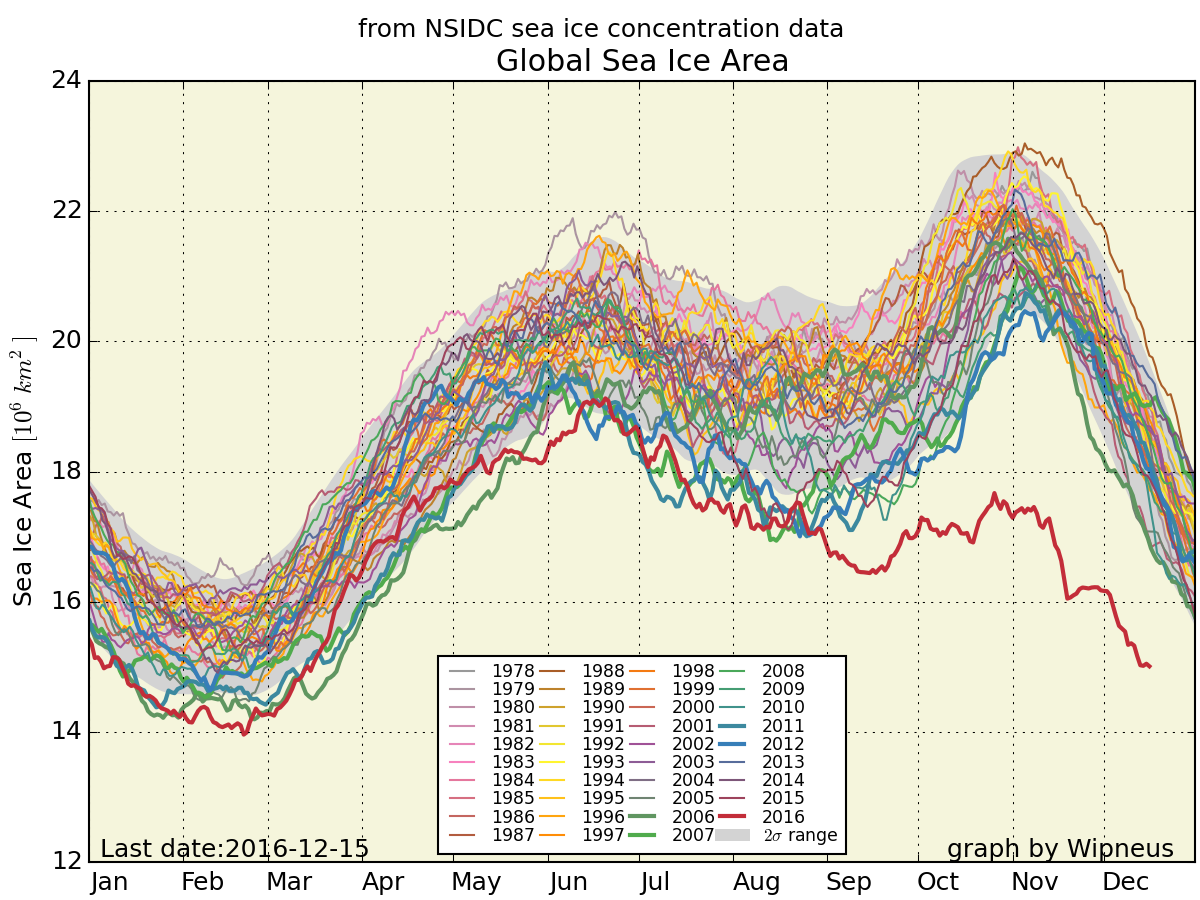
Finally, for the moment at least, here’s global sea ice area just for good measure:
Need I say more? How about this:
Ice has no agenda. It just melts.
Out of the labs and into the streets?