Earlier today the National Snow and Ice Data Center announced that:
On September 11, Arctic sea ice likely reached its annual minimum extent of 4.28 million square kilometers (1.65 million square miles). The 2024 minimum is the seventh lowest in the nearly 46-year satellite record. The last 18 years, from 2007 to 2024, are the lowest 18 sea ice extents in the satellite record…
Note that this is a preliminary announcement. Changing winds or late-season melt could still reduce the Arctic ice extent, as happened in 2005 and 2010. NSIDC scientists will release a full analysis of the Arctic melt season, and discuss the Antarctic winter sea ice growth, in early October.
Consequently several of the usual cryodenialospheric suspects have been frantically spinning their webs of deceit around the announcement.
First up was Javier Vinós, who beat the NSIDC’s starting gun by firing a broadside on X (formerly Twitter) on Sunday. If you’re unfamiliar with the name, Javier frequently pontificates about Arctic sea ice, amongst other things, on Judith Curry’s “Climate Etc.” blog. He confidently announced that:
Arctic sea ice reaches its annual minimum with an extent greater than in 2007, 2012, 2016, 2019, 2020 and 2023.
The two warmest years in a row at > +1.5°C have ZERO IMPACT on the 17-year resilience of Arctic sea ice.
Needless to say, “Snow White” felt compelled to quibble:
Following which Javier valiantly decided to dig himself into an ever deeper hole, after proudly supporting his alleged “case” by presenting me with a learned journal article I’m already writing about in a draft blog post of my own:
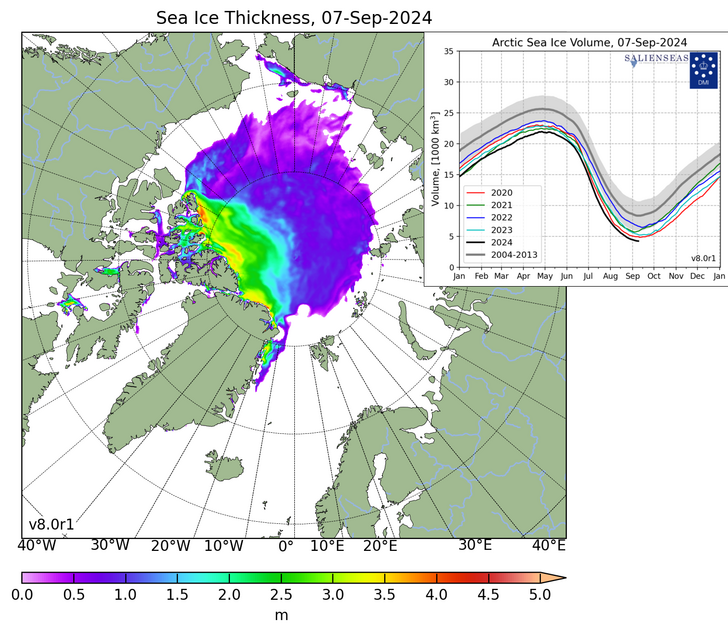
Following the NSIDC’s announcement today, Anthony Watts hastily copied an evidently even more hastily produced article by Paul Homewood, which opened with this graphic graphic dated September 7th:
Not a lot of people know that Snow White and I are currently no longer persona non grata at both NALOPKT and WUWT:
I cannot help but wonder how long that happy state of affairs will last?
[Update – September 25th]“Not long at NALOPKT” is the answer! Paul got bored with humouring me, and this comment of mine is now on his cutting room floor. As are several others:
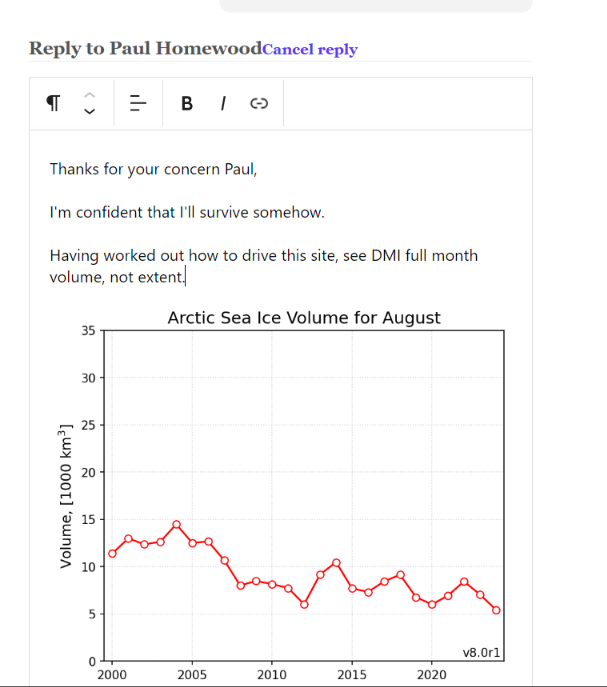
My invisible comment was in reply to Paul’s standard “skeptical” sign off:
Simply word salad.
DMI have tampered with their data so as to make historical ice thickness thicker in comparison with the last few years. They did this because their previous data showed that sea ice volume had not been reducing, which was highly inconvenient.
Their ice volume figures therefore can no longer be trusted.
Thanks for reminding me about this fraud, Jim. I will repost my original article tomorrow!
I’m sorry to see you get so few readers these days.
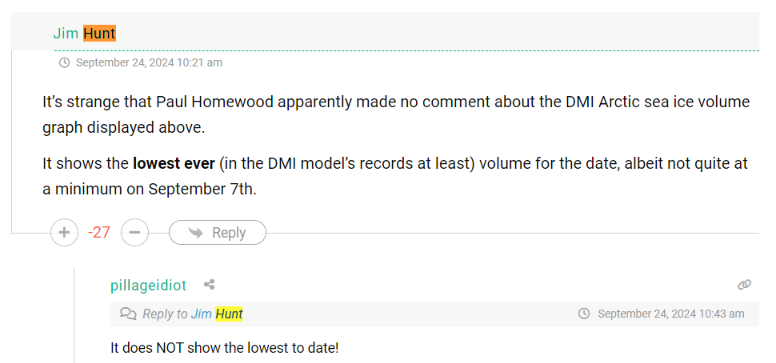
Meanwhile Anthony Watts has yet to curtail my free(ish) speech, but his flock of faithful followers are doing their utmost to sink their teeth into me:
27 downvotes and counting!
[Update – September 26th]Paul Homewood has poison penned another Arctic article. This one is entitled “Arctic Sea Ice Volume”. Paul assures his flock of faithful followers that:
There has been a suggestion that although Arctic sea ice extent has remained stable since 2007, it is getting thinner.
As the ice volume charts make clear, this is nonsense. Volume, and therefore thickness, have remained as stable as extent.
NALOPKT my pithy comment in response will never see the light of day:
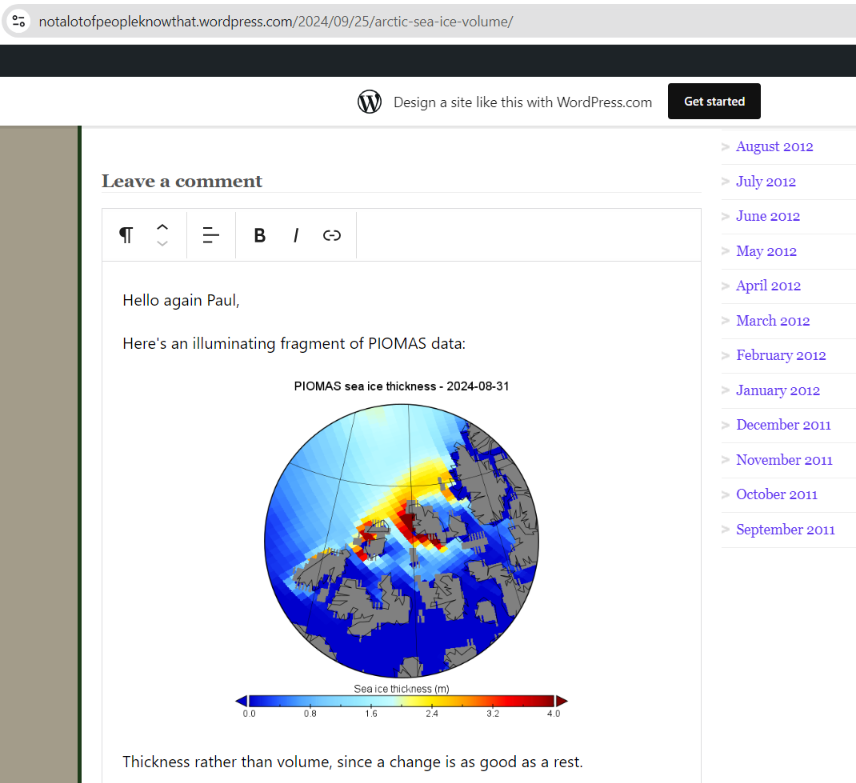
Hopefully by now a fair few people know that (AFFPKT?) Ron Clutz has no idea what he’s talking about? For yet more evidence see his comment on Arctic sea ice volume at NALOPKT:
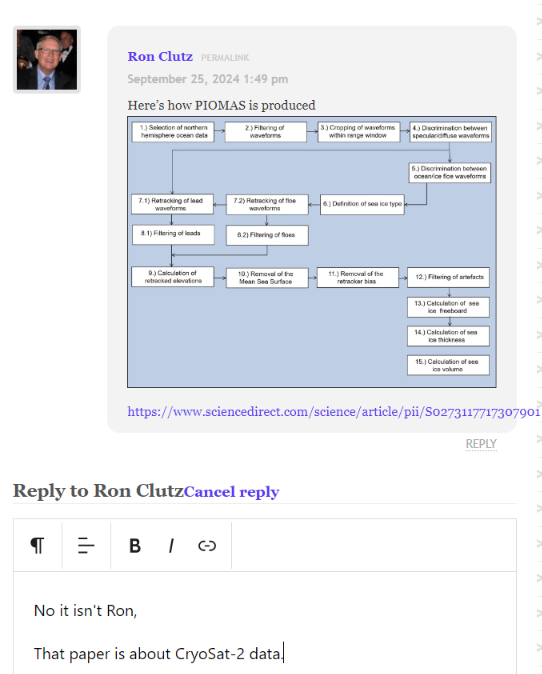
This is the paper he links to:
https://doi.org/10.1016/j.asr.2017.10.051
Meanwhile the “attack dogs” at WUWT and Javier on XTwitter have fallen strangely silent:

It looks as though -29 will the final total of my gold stars for explaining the meaning of Anthony’s graph to him. In other news from the heart of darkness, some surprise thumbs up:

In other news from Elmo’s “town square”, junk scientist Steve Milloy has been waxing lyrical about Al Gore and the 2024 minimum extent:
[Update – October 1st]Not according to @wattsupwiththat it didn’t Steve.
— Snow White (@GreatWhiteCon) September 27, 2024
Least sea ice evah! (In the satellite era):https://t.co/uXnuiPWDIa
Slightly late to the Arctic sea ice extent party comes Tony Heller, whose response to an Arctic article in Earth.com runs as follows:
There has been no trend in Arctic sea ice extent for over seventeen years.

For some strange reason Tony neglects to mention this bit of the Earth.com article:
Measurements collected with spaceborne altimeters, including NASA’s ICESat and ICESat-2 satellites, have found that much of the oldest, thickest ice has already been lost.
New research from NASA’s Jet Propulsion Laboratory in Southern California shows that in the central Arctic, away from the coasts, fall sea ice now averages around 4.2 feet thick, down from a peak of 8.8 feet in 1980.
One of the conclusions from the academic journal article reads as follows:
Over the satellite record, there is an overall thinning of ~1.2 m from the 3 m peak winter thickness in the IceSat record to the mean winter thickness of 1.8 ± 0.12 m in the 13-year CryoSat-2 record. The low variability of winter FYI thickness in the CryoSat-2 record, hovering around 1.4 ± 0.1 m, can be compared to the thicker FYI of 2.0 ± 0.2 m in the IceSat record prior to 2007. While the MYI thickness has declined from ~3.5 m in the IceSat record, there is more variability in the CryoSat-2 record (2.6 ± 0.2 m) even as the MYI coverage continues to decrease. We attribute the variability to the smaller MYI areas, now located north of Greenland and CAA coasts, that consist of areas more prone to ice convergence and associated thickness changes.
Watch this space!

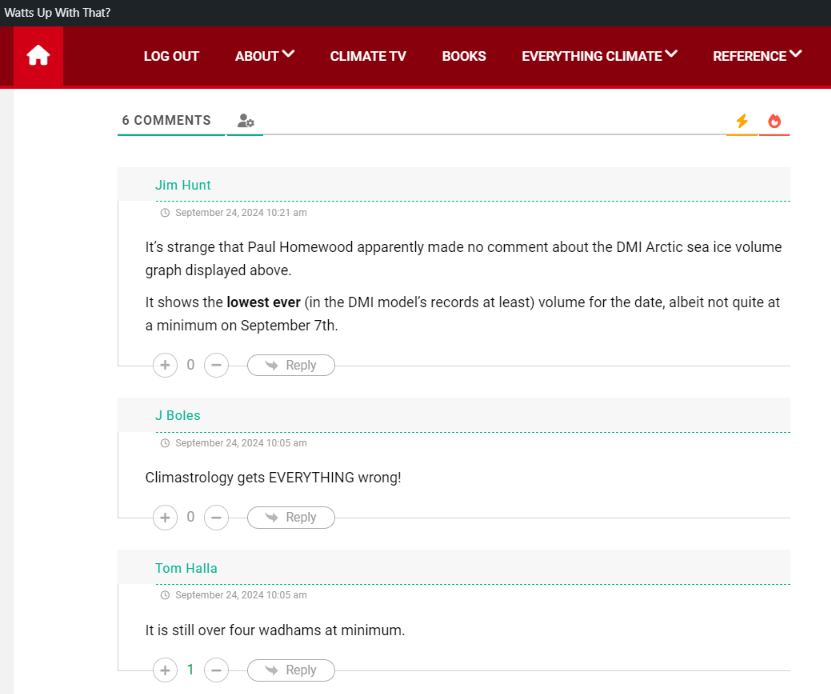
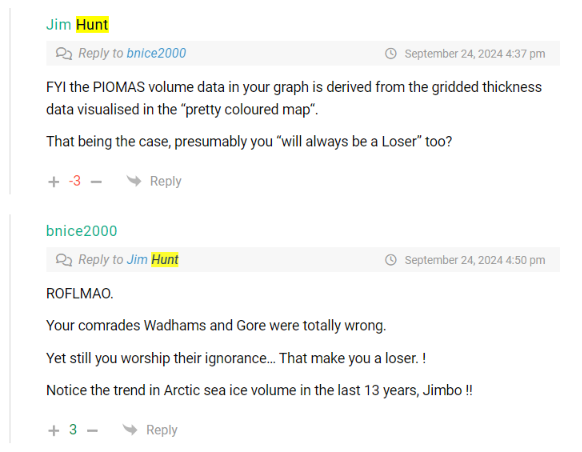
My comment has attracted a lot of downvotes at WUWT, but I have not been “censored” as yet:
Shock News!!!
Paul Homewood is humouring “Snow White”!
Jim<
Paul Homewood is a piece of work. Every, and I mean every reflexive attack he makes about the UKMO is wrong, and as such easy to debunk, the faithful being so skeptical as to take it as gosple. I don't bother to rebutt on NALOPKT but I do on WUWT (despite the attack-dogs from the choir). I have meteorological background. 32 years working for the MetO the last 21 as an on-the-bench forecaster.
Hi Tony,
Thanks for dropping by. You and I have previously crossed paths, back in the mists of time. At Judy’s “Climate Etc.” if my ageing memory recalls correctly.
Paul has the DMI in his sights this time, rather than the UKMO. I was persona non grata at NALOPKT for a long time, and now I am once again! See above.
The WUWT attack dogs are after me, but have yet to inflict a flesh wound. And certainly not a fatal mauling!
The August 2024 median forecasted value for pan-Arctic September sea-ice extent is 4.27 million square kilometers.
Couldn’t get much closer than this!
That’s for the September monthly average though Neil, so not quite as brilliant a “prediction” as you are implying:
https://GreatWhiteCon.info/2024/09/the-2024-arctic-sea-ice-minimum-extent/#Sep-04
Even more shocking news!
There’s been a glitch in Elmo’s matrix:
Hi Jim the moderator,
Another minimum ice extent and more evidence that Arctic ice hasn’t decreased since 2007.
Just how long do you think you can keep this charade up. You must be desperately hoping that Arctic ice will start decreasing again, but my guess it will start increasing again in concert with the AMO as it is due to start its downturn.
You see Jim, you believe by faith, not evidence and logic.
Hello again Peter the “skeptic”,
Here’s some evidence for you. Can you spot the difference between 2007 and 2024?
Just how long do you think you can keep this charade up?
Nice graph Peter uses to prove his point!
September Trend: -11.6%/decade
Trend since when, Jim? Answer makes a big difference, as I’m sure you know. Pity we don’t have comparable measures from the ‘50’s and ‘30’s. I’m speculating your -11.6% might not hold up. In fact, simple arithmetic says it can’t.
I’m simply reading what it says on Peter’s graph Taylor.
The graph says it’s derived from “v2.2 OSI SAF Sea Ice Index”
It was -11.8%/decade a few years ago…
Long time no see Matt,
Do you have any on topic comments to make?
What do you make of Paul Homewood’s censorship at NALOPKT for example?
Or the stream of abuse from the “attack dogs from the choir” at WUWT?
“Trend since when…”. My point exactly. Most of the quoted trends, including the one in the graph, start at the beginning of the modern satellite era, 1979. If I remember correctly, that was during one of the coldest periods in the last century, when some were predicting a new ice age. Trends since then are meaningless from a climate perspective, as would be a trend starting at 1935.
Just like Matt’s comment, that’s nothing to do with the point of this article Taylor.
At the risk of repeating myself:
“What do you make of Paul Homewood’s censorship at NALOPKT for example?
Or the stream of abuse from the “attack dogs from the choir” at WUWT?”
?