For years now I’ve been using the convenient tools provided at the NCEP/NCAR reanalysis web site to generate custom maps and time series illustrating the climate of the Arctic. By way of example see last December’s “Post-Truth Global and Arctic Temperatures“:
Prompted in part by the obvious difficulty the different models are currently having in generating accurate short term forecasts for the “New Arctic”, I’ve been recently been comparing assorted reanalysis products. For example the UCAR Climate Data Guide points out that:
NCEP Reanalysis (R2) is better than NCEP-NCAR (R1) but still a first generation reanalysis. It is best to use 3rd generation reanalyses, specifically, ERA-Interim and MERRA.
I recently discovered that Richard James has performed a similar analysis for the Arctic, which can be viewed at:
wherein I mentioned the NOAA ESRL Web-based Reanalysis Intercomparison Tool, which allows you to produce plots and timeseries for arbitrary areas of Planet Earth using NCEP/NCAR, ERA Interim, MERRA-2 and numerous other reanalysis products. Here’s one little example:
which makes it evident that NCEP-NCAR (R1) and ERA Interim have different ideas about surface temperatures in the Arctic. So does MERRA-2!
For a graphic example of the differences between the three products here is my version of Richard’s Arctic winter temperature comparison (note that currently ERA data is only available up to January 2017):
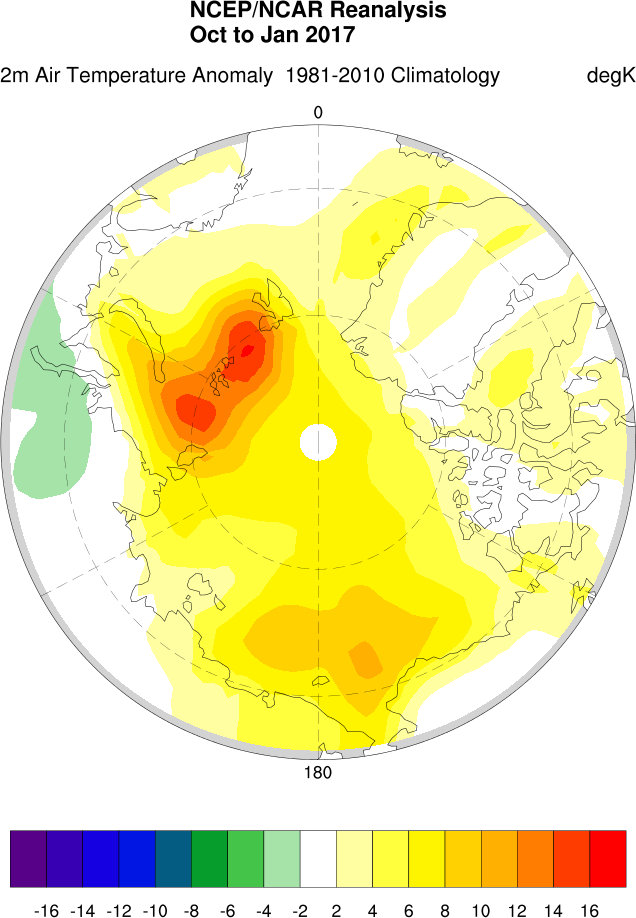
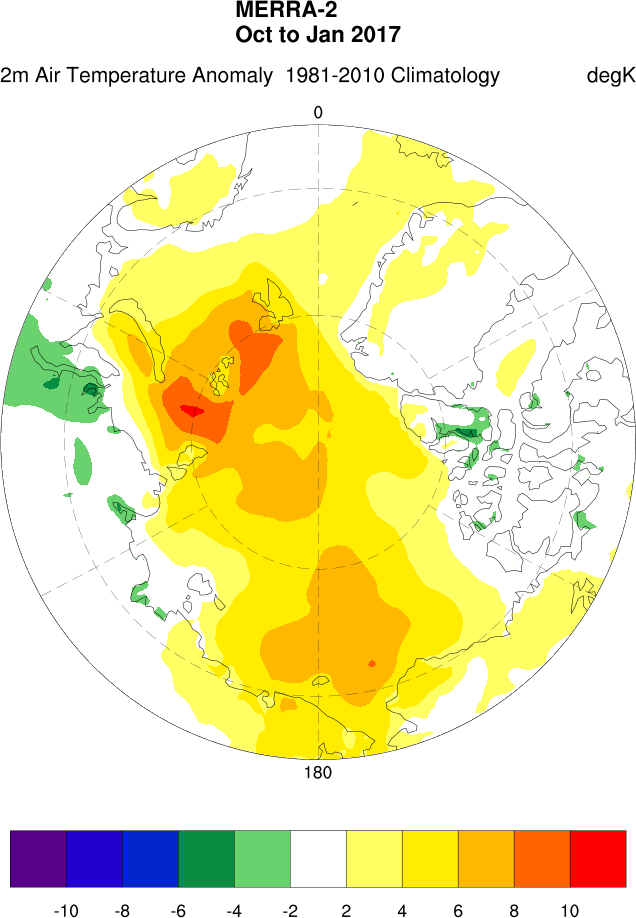
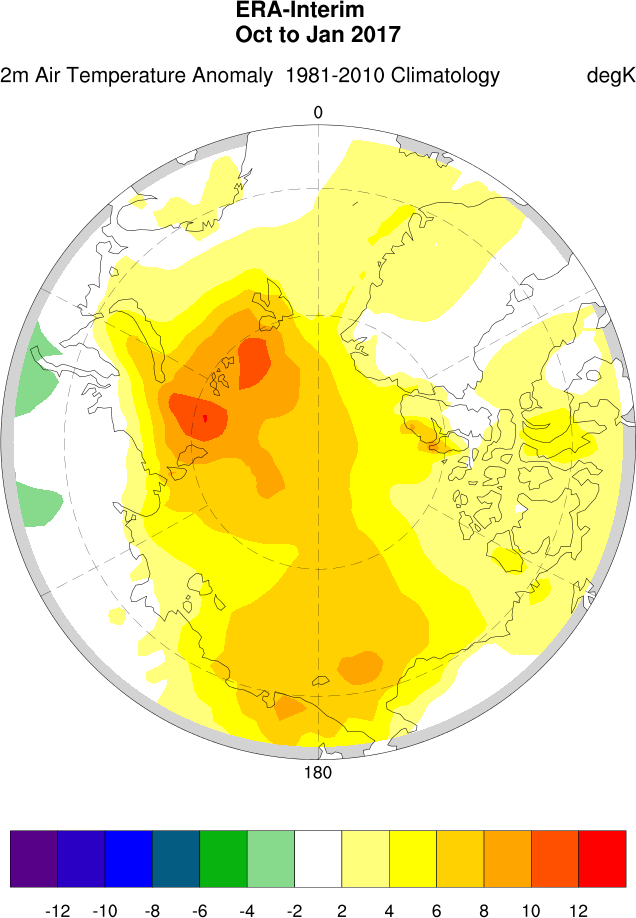
Can you spot the difference? In conclusion, here’s the Era Interim version of the High Arctic autumnal 925 hPa temperature trend graph at the top: