Cold Regions Research and Engineering Laboratory Ice Mass Balance Buoys
 Perovich, D., J. Richter-Menge, B. Elder, T. Arbetter, K. Claffey, and C. Polashenski, Observing and understanding climate change: Monitoring the mass balance, motion, and thickness of Arctic sea ice, http://http://imb-crrel-dartmouth.org, 2017.
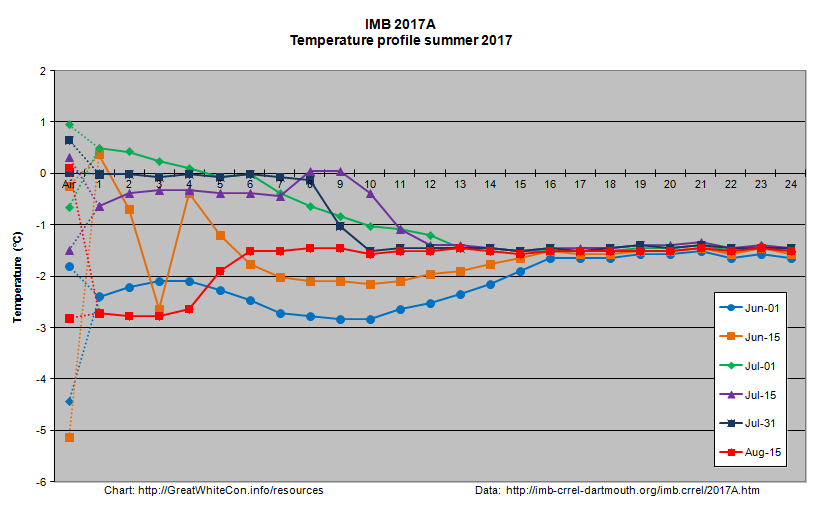
Google Maps/Earth format data and temperature profiles for all active ice mass balance buoys. See the ice mass balance buoy introduction for an explanation of the graphs. Click the pushpins on the Google maps for additional information:
Seasonal Ice Mass Balance Buoy 2017A
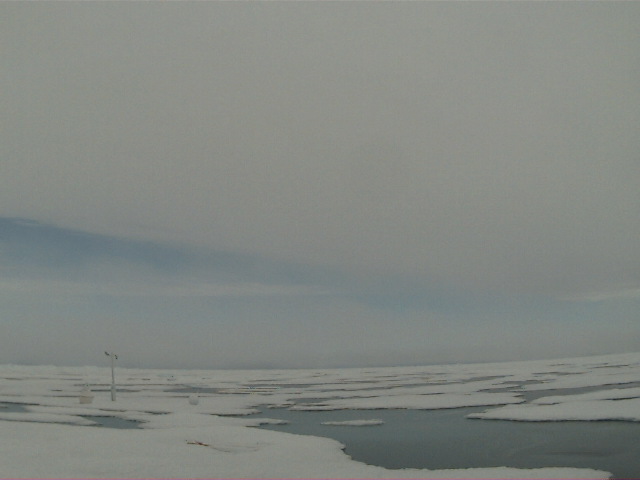
Image of 2017A from WARM 6 on July 18th 2017. NSF project: NSF OPP #1603548
View IMB 2017A in a full screen map
|
|
|


Seasonal Ice Mass Balance Buoy 2017B
View IMB 2017B in a full screen map
|
|
|


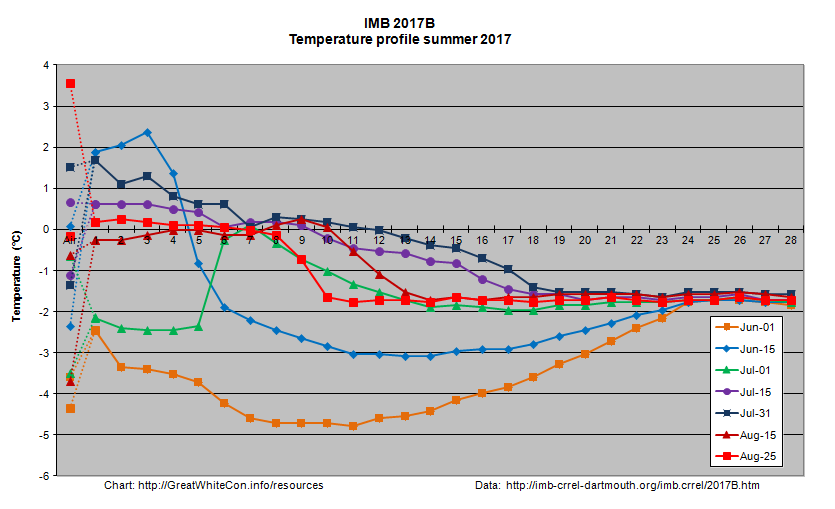
Ice mass balance buoy 2017B is colocated with ice tethered profiler 95. Here are the ITP95 temperature and salinity profiles:

See also our Arctic sea ice graphs overview page, our Arctic sea ice images page and our Arctic sea ice videos page.
Constructive technical criticism is welcome on the introductory blog post. For discussions about interpreting the information please comment on the “About Our Arctic Sea Ice Resources” page.