We have received some constructive criticism from Anthony Watts to the effect that our resources section is sadly lacking in graphs, plots and maps of Arctic sea ice. The best such resource we are aware of on the web can be found at:
The Arctic Sea Ice Graphs web site.
In addition here are some additional graphs and maps focussing on Arctic sea ice thickness and volume that are difficult to update automatically. We shall endeavour to do so manually as and when time allows.
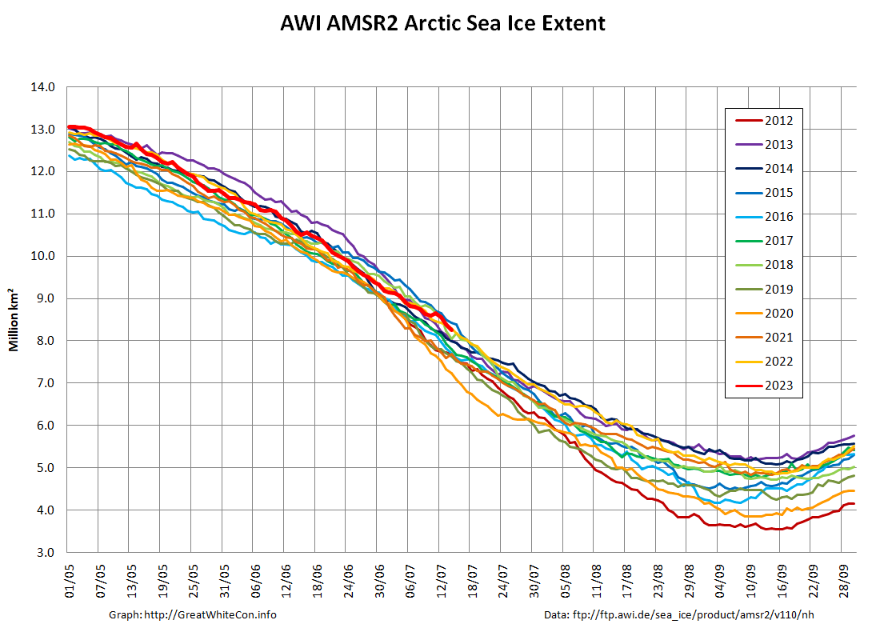
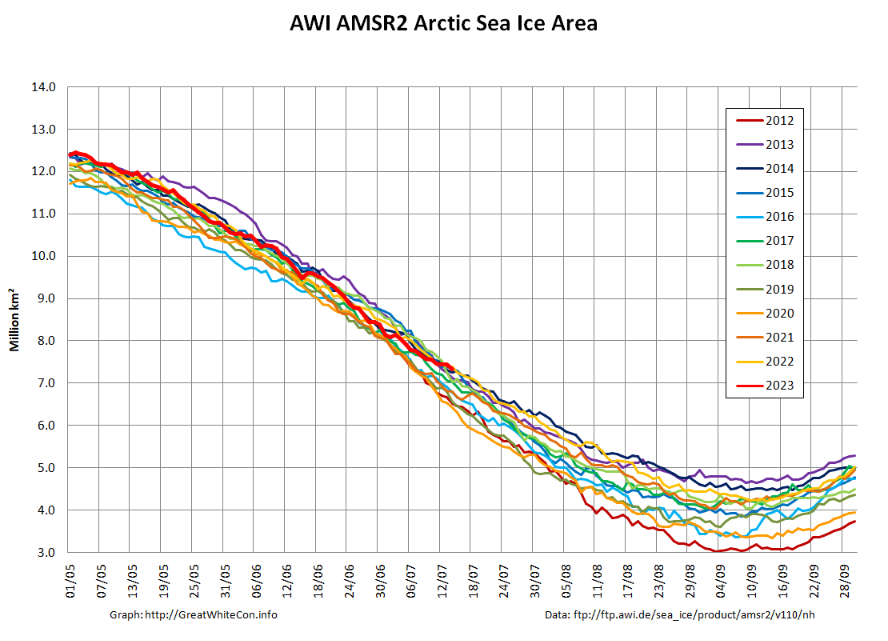
JAXA/UH Arctic Sea Ice Area/Extent
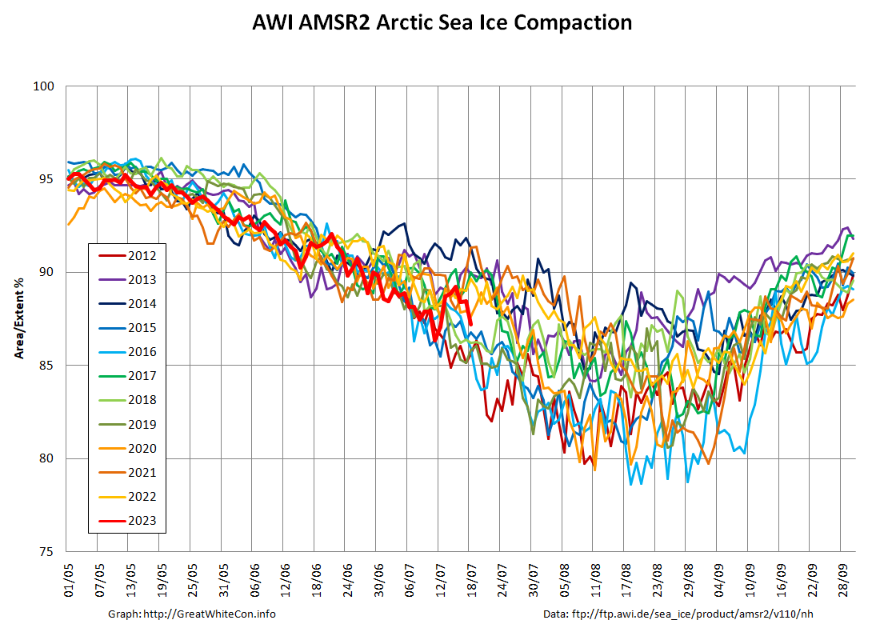
Following the sad demise of the SSMIS instrument on the DMSP F-17 satellite, here’s Arctic sea ice area, extent and compaction as calculated by Wipneus at ArctischePinguin, using the University of Hamburg’s high resolution version of JAXA’s AMSR2 data:
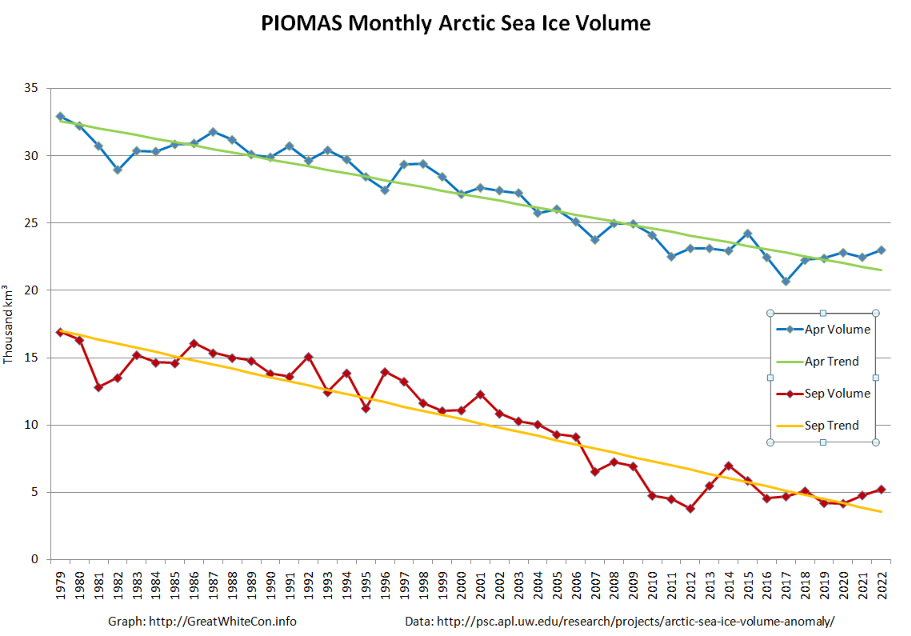
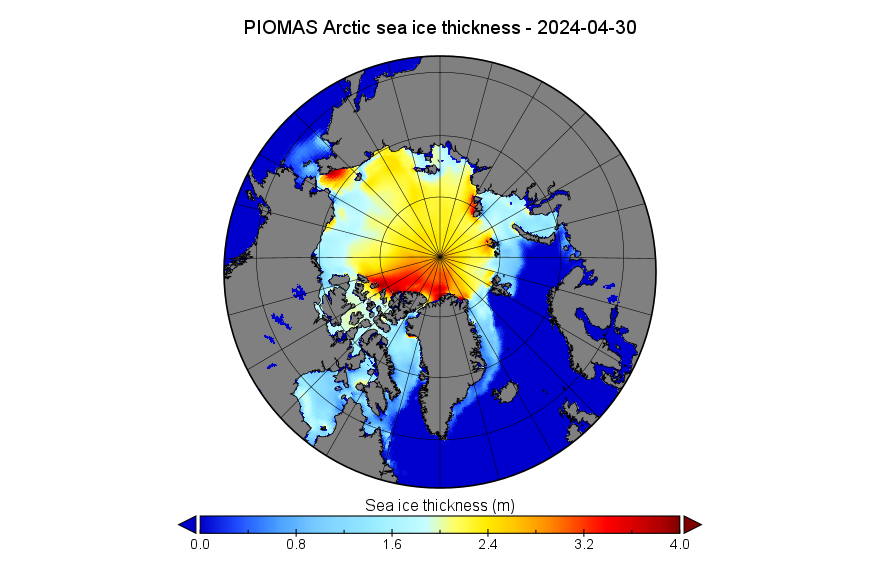
PIOMAS Arctic sea ice volume:


PIOMAS monthly volume from the Polar Science Center:
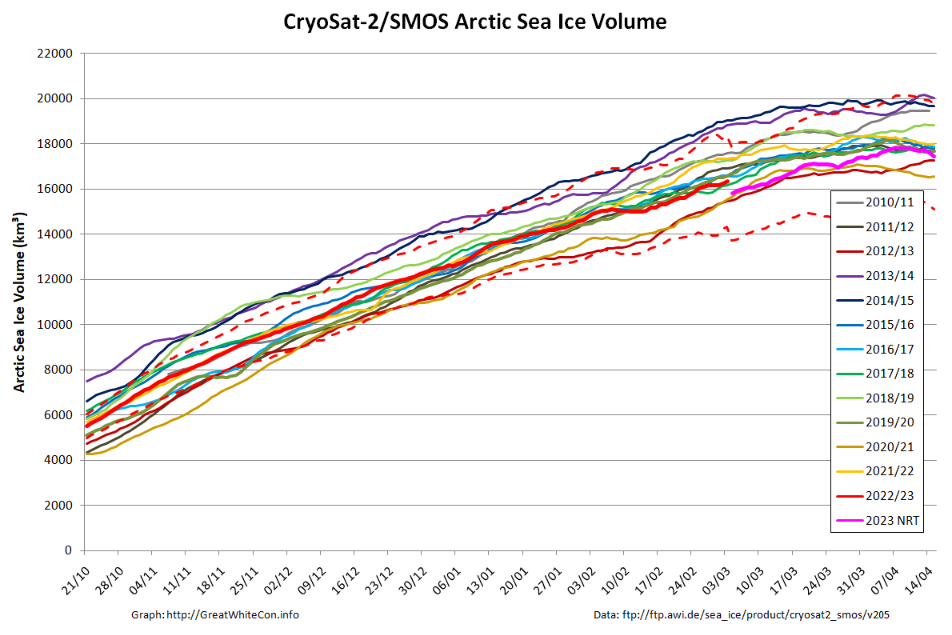
Merged CryoSat-2/SMOS volume from the Alfred Wegener Institute:
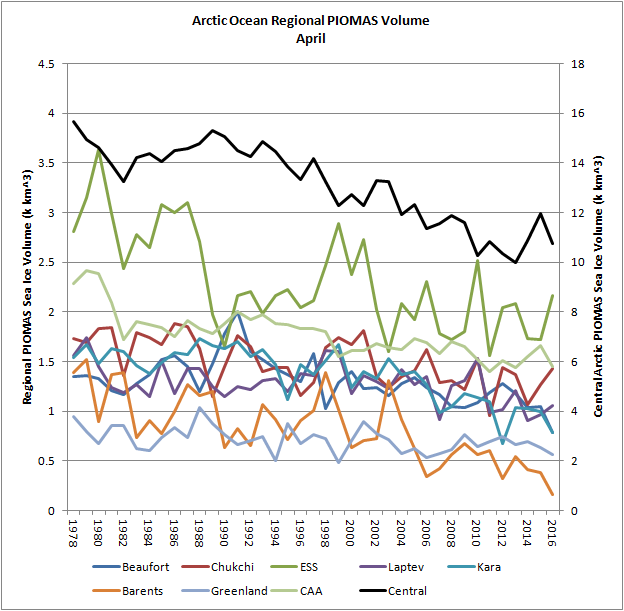
PIOMAS volume by region from Chris Reynolds:

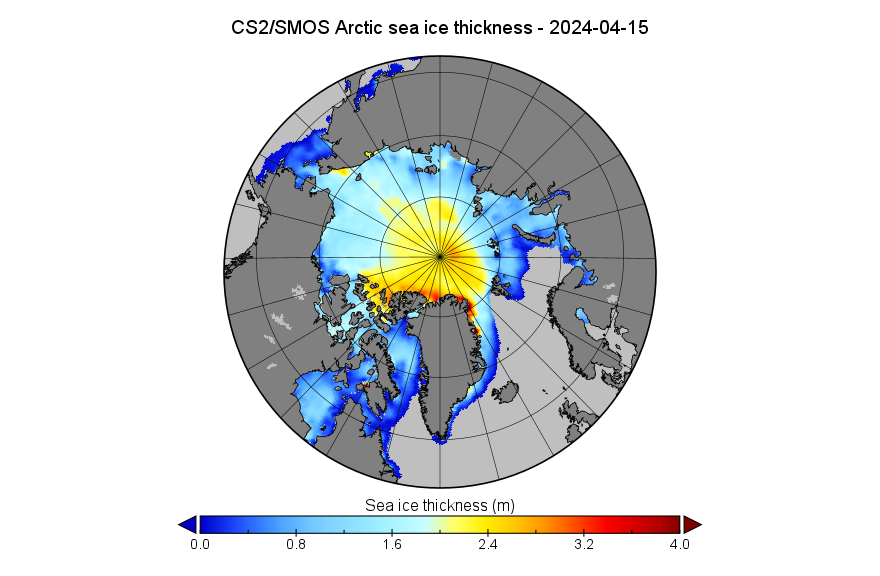
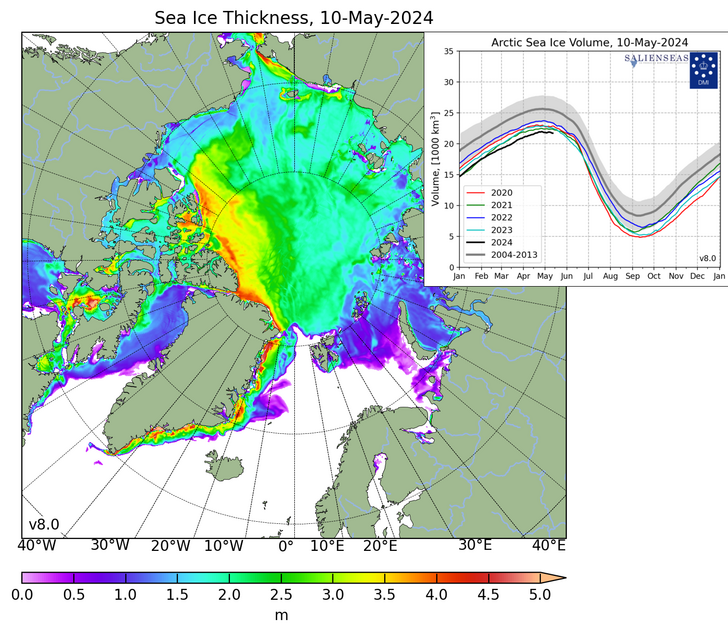
Merged CryoSat-2/SMOS thickness data from the Alfred Wegener Institute:
CryoSat-2 near real time Arctic sea ice thickness
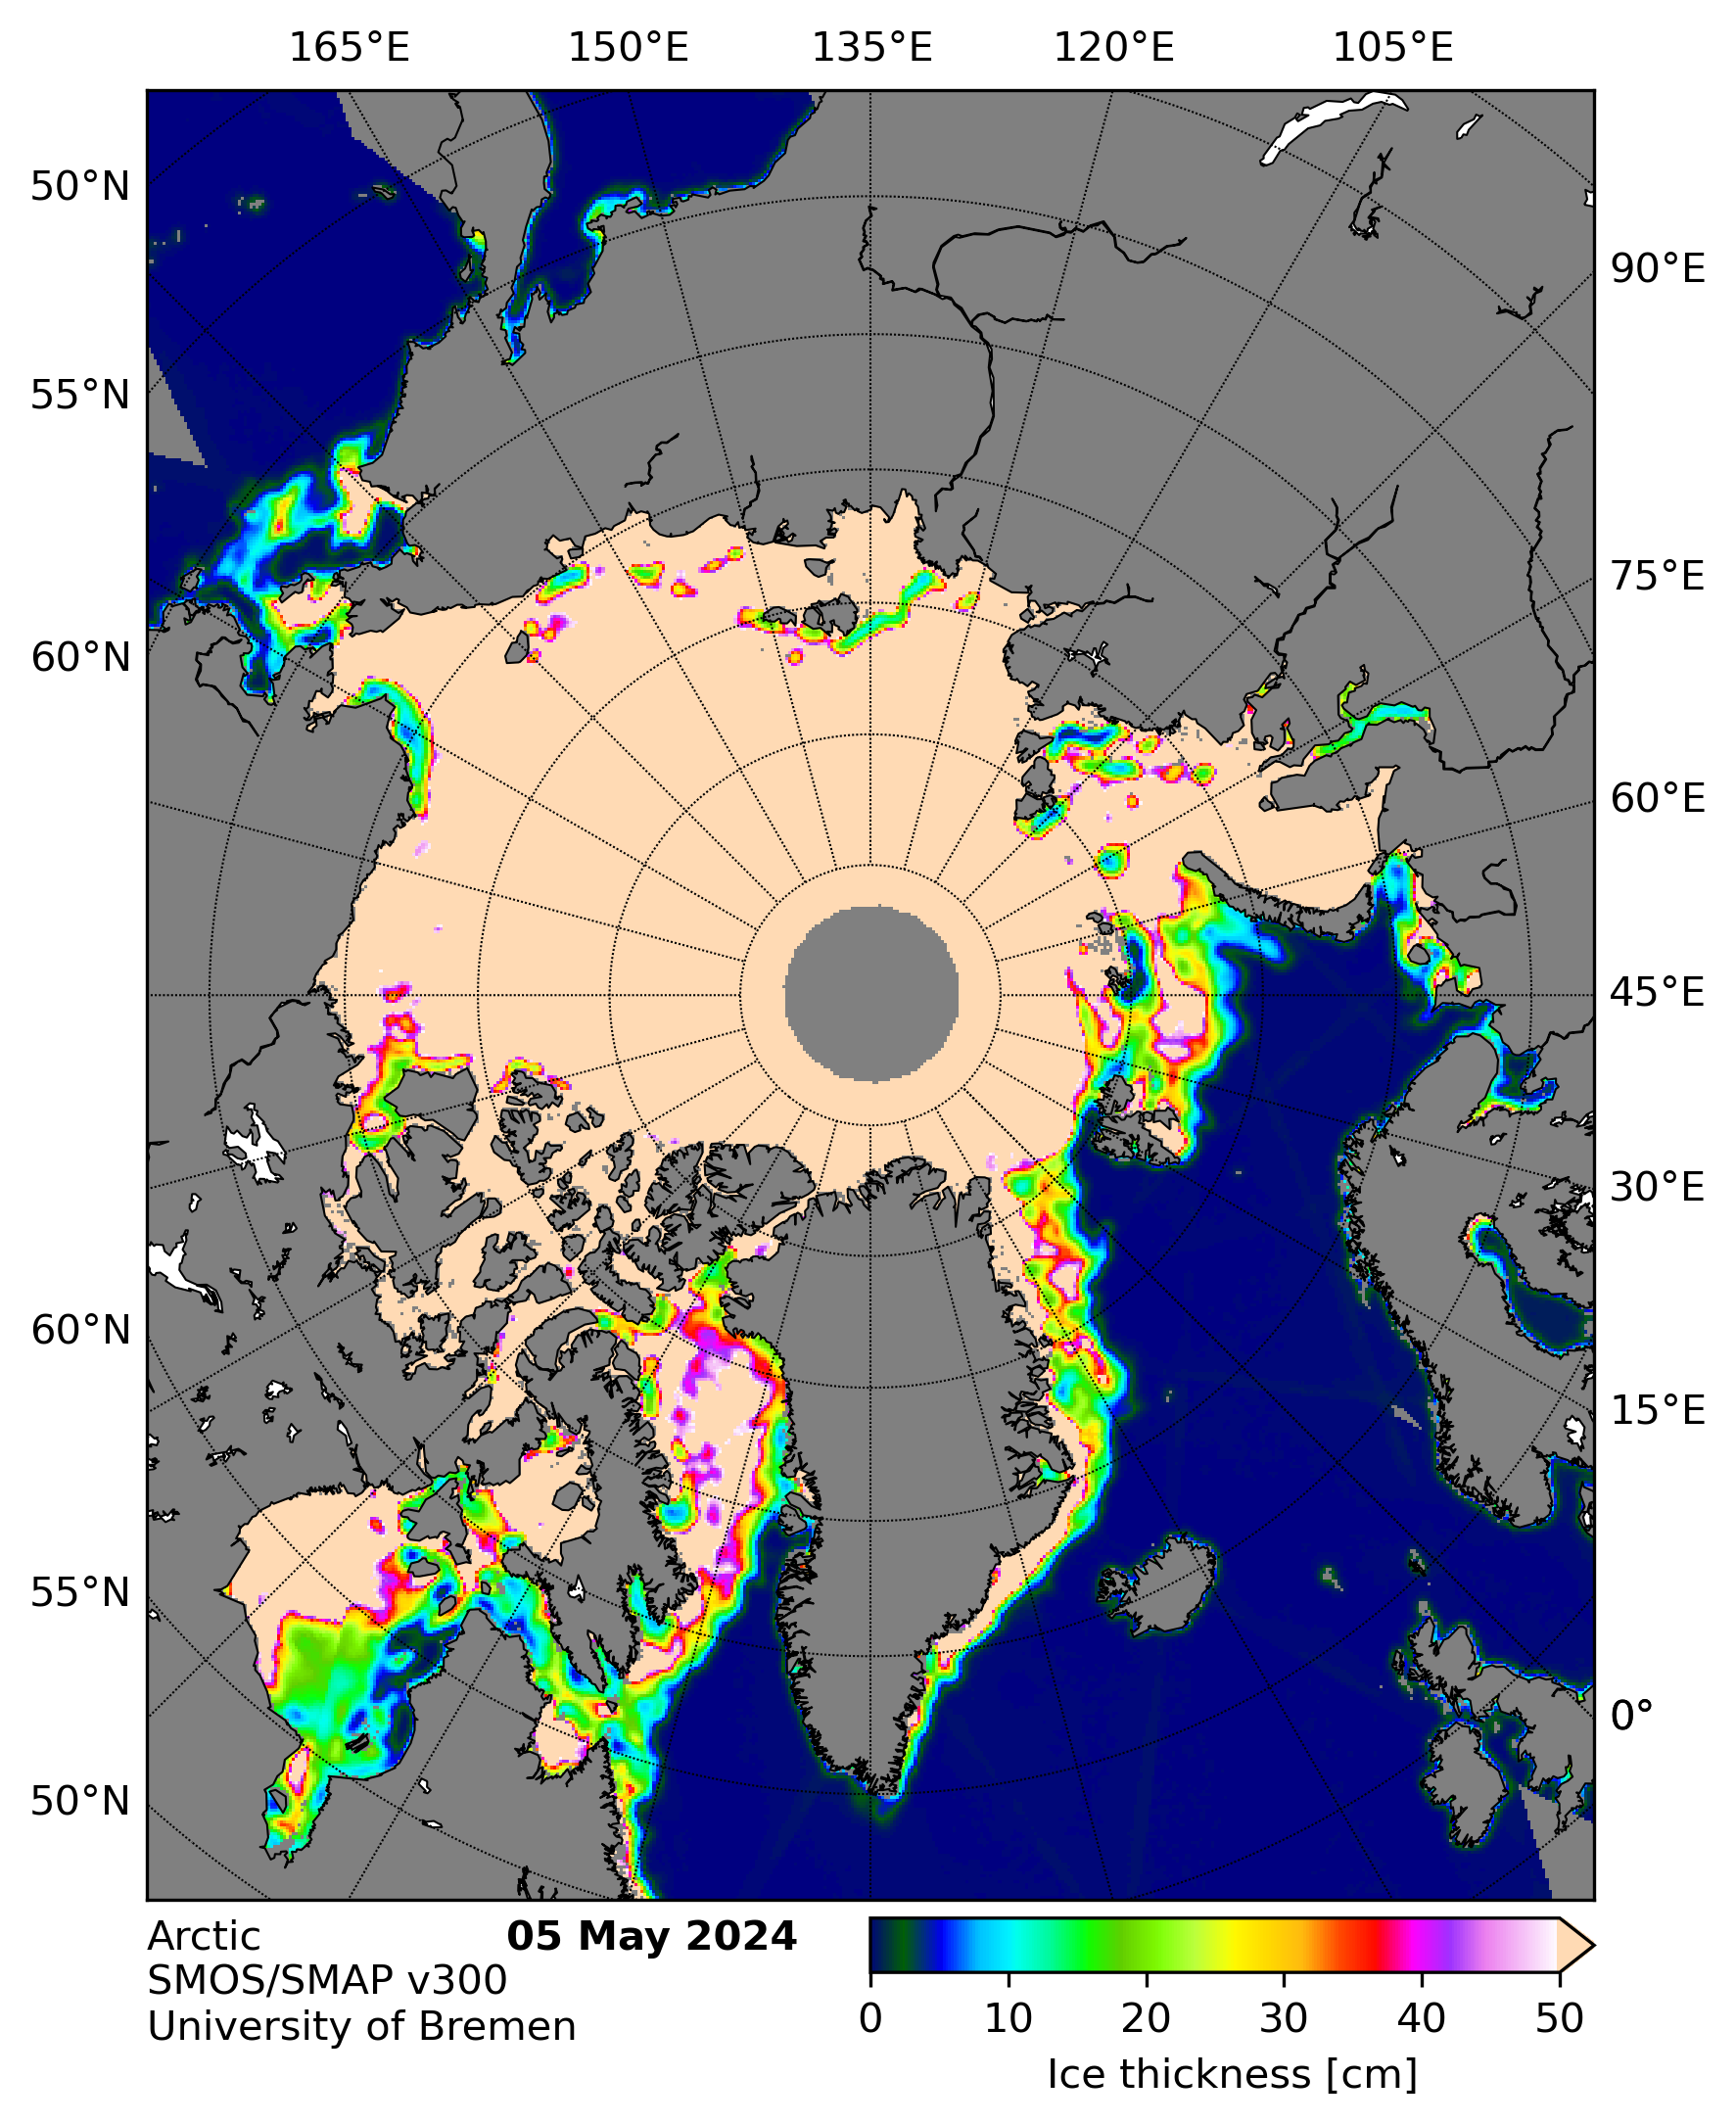
SMOS thickness from the University of Bremen:

Arctic Sea Ice Melt Pond Fraction
AMSR2 thickness and melt concentration from the Arctic Data Archive System

Sentinel 3 Arctic sea ice melt pond fraction from the University of Bremen

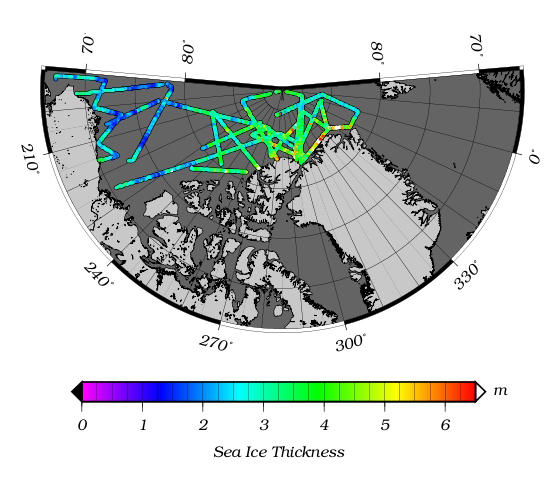
Sea ice thickness from the NASA Operation IceBridge Arctic 2014 Sea Ice Science Results page.
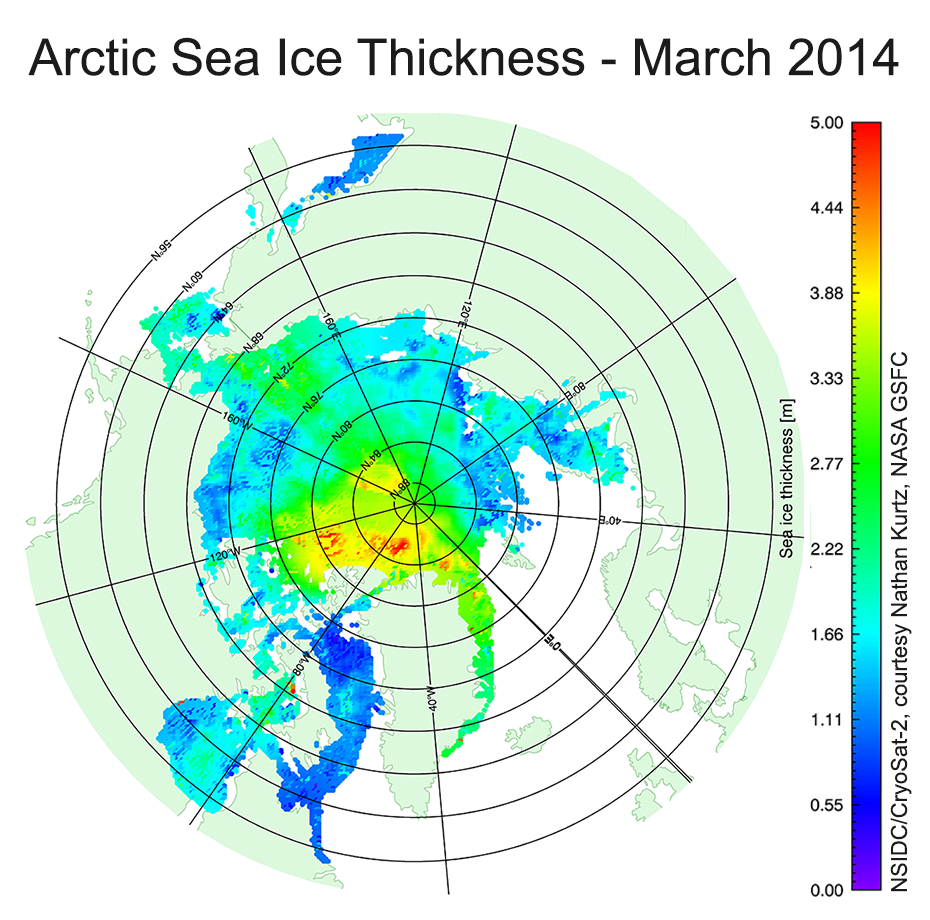
NASA Operation IceBridge Arctic sea ice thickness from the NSIDC

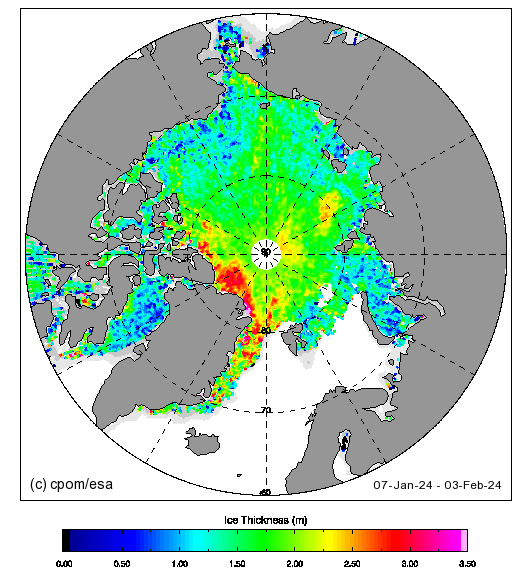
CryoSat-2 Arctic sea ice thickness from the NSIDC:
CryoSat-2 Arctic sea ice thickness from the European Space Agency:
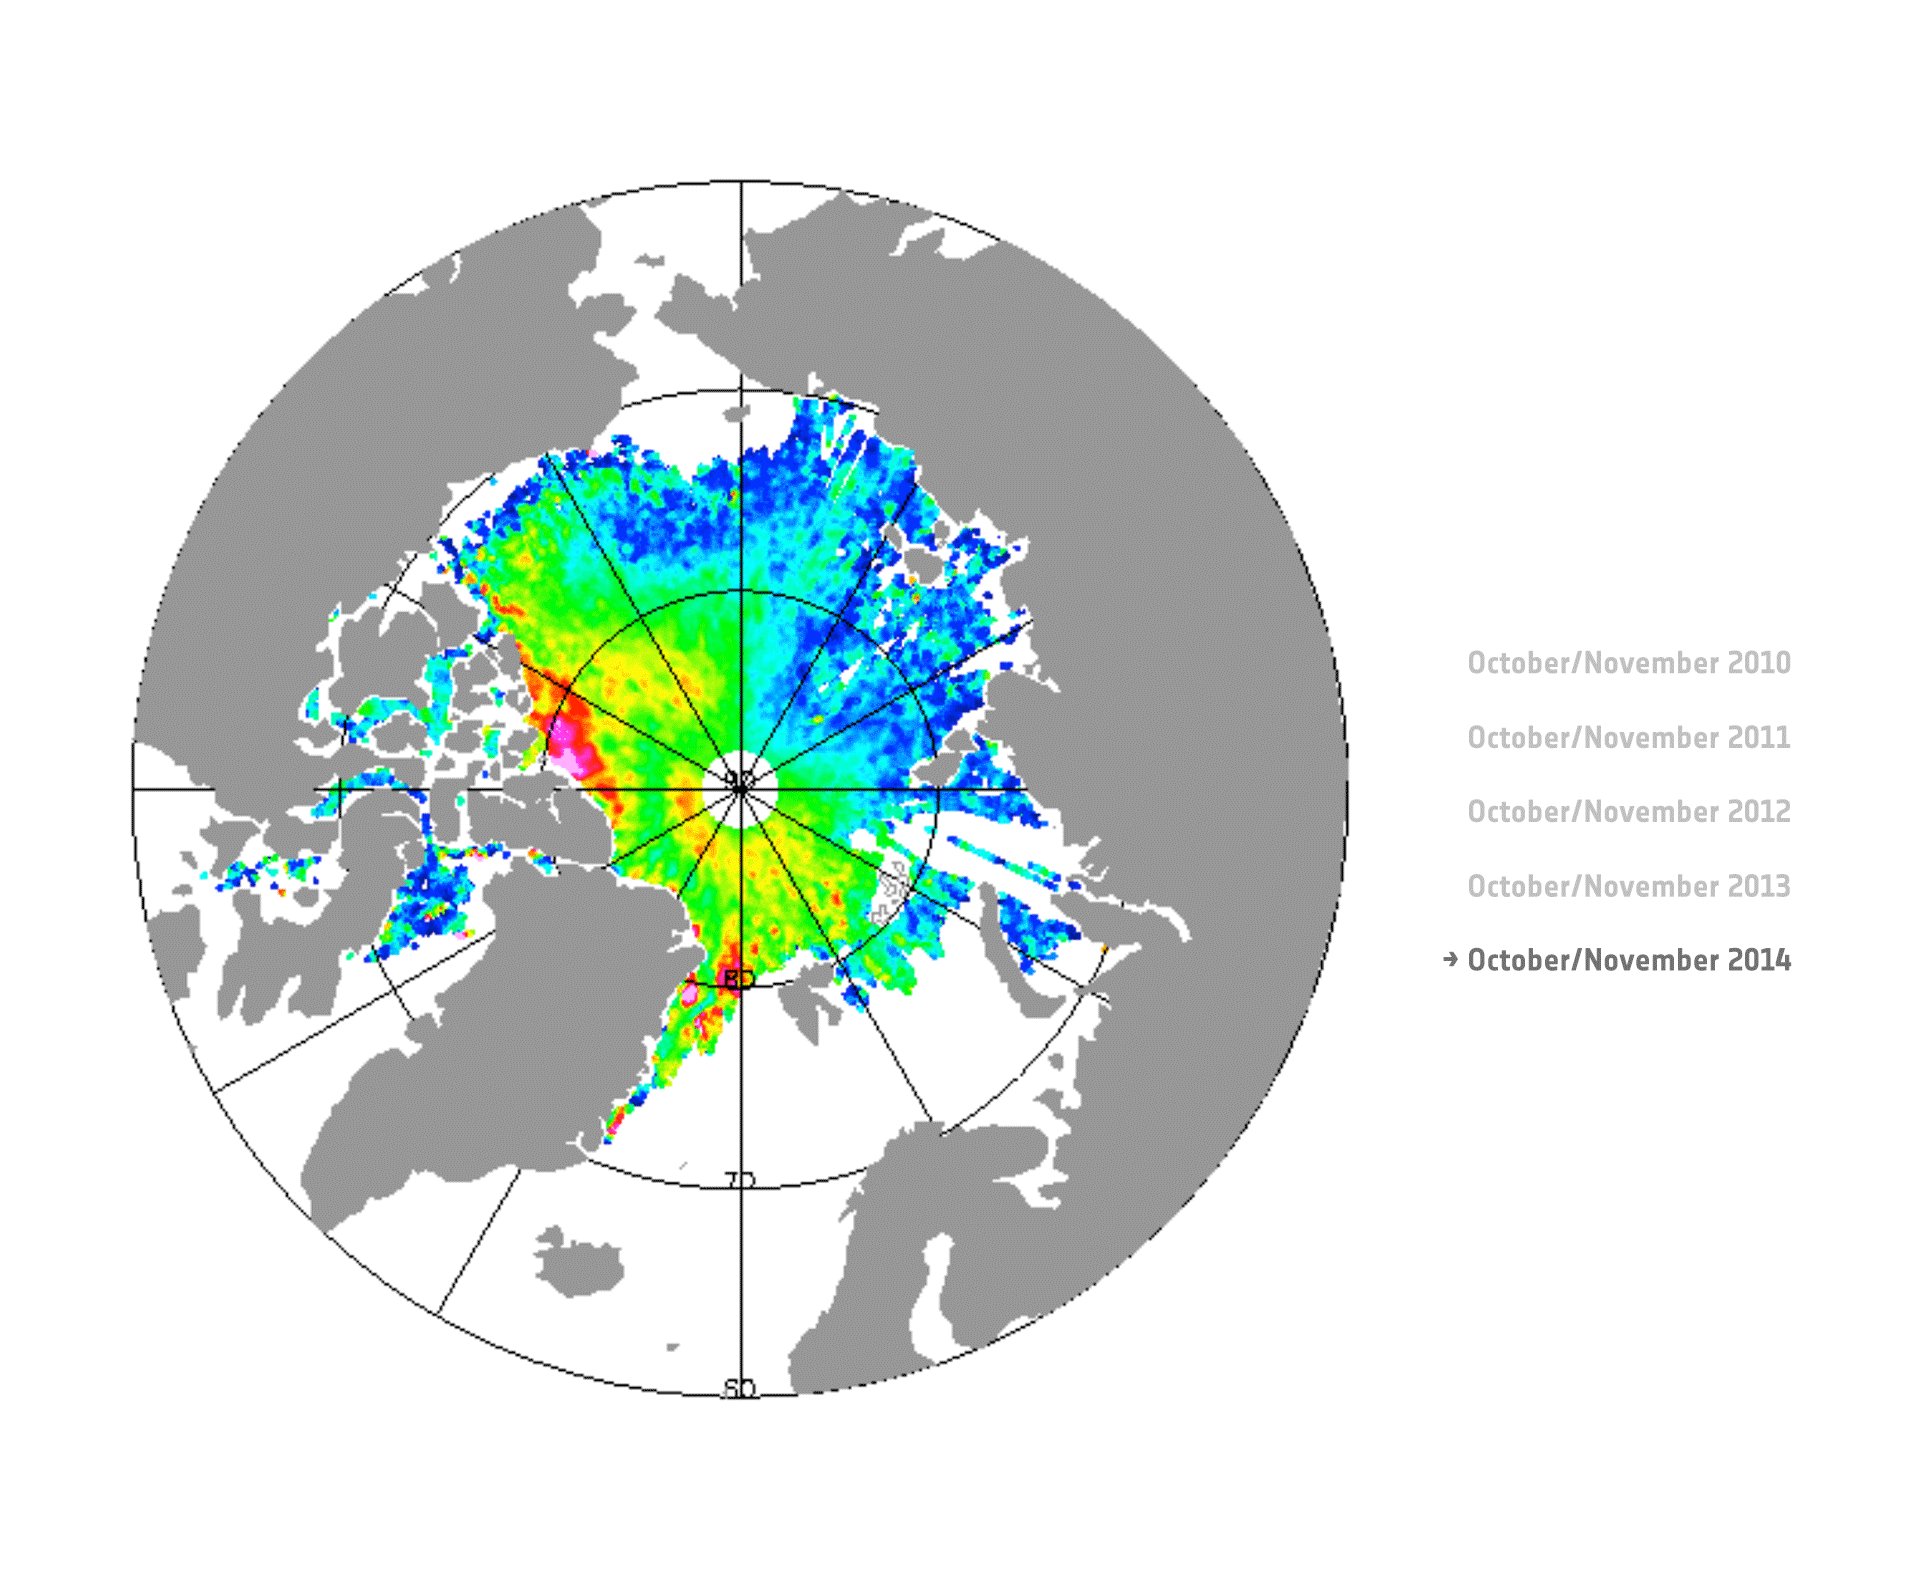
Northern Hemisphere Snow Cover
Northern Hemisphere Multisensor Snow Extent:


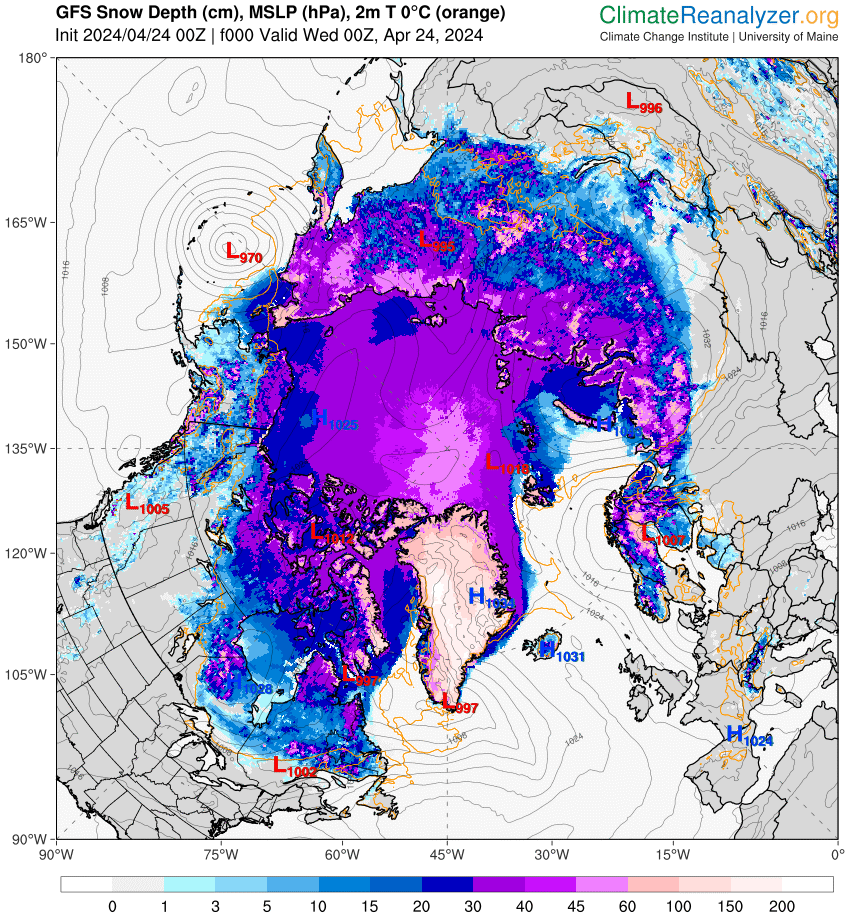
Climate Reanalyzer GFS Arctic Snow Depth:

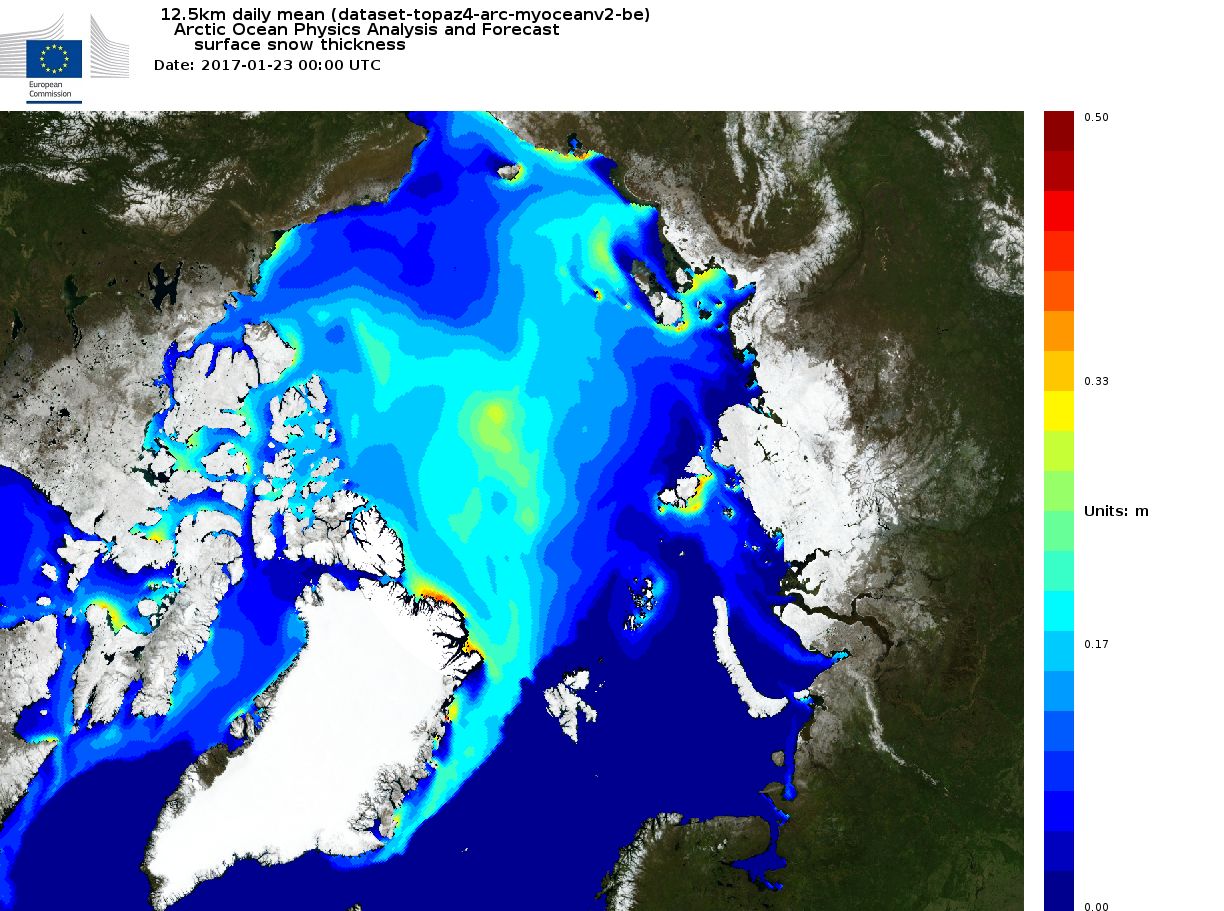
Topaz 4 Arctic Snow Depth:
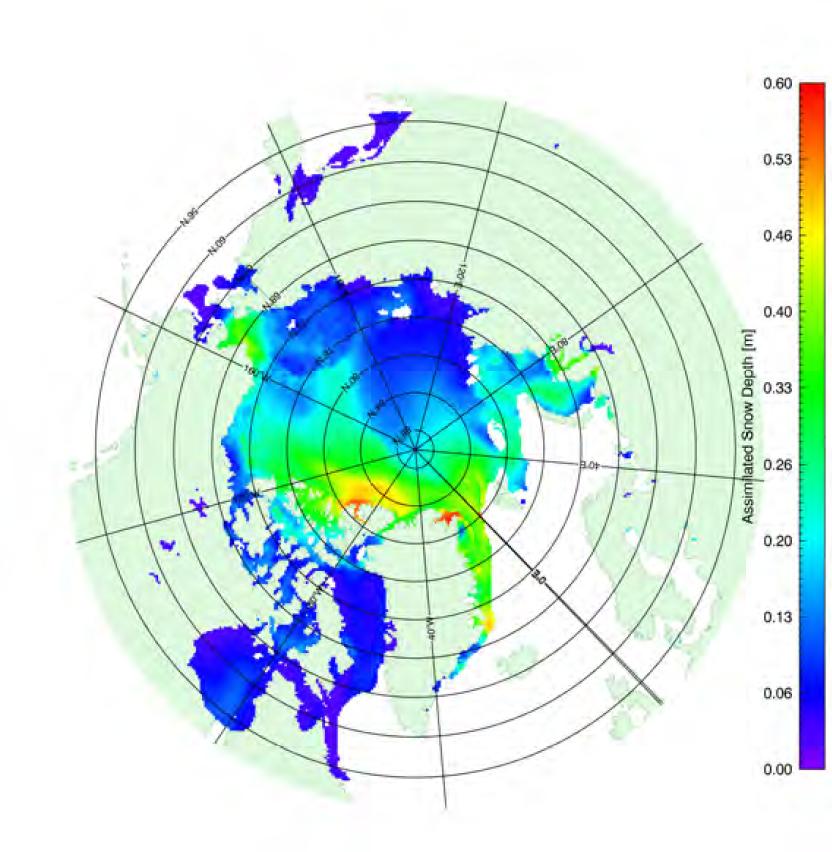
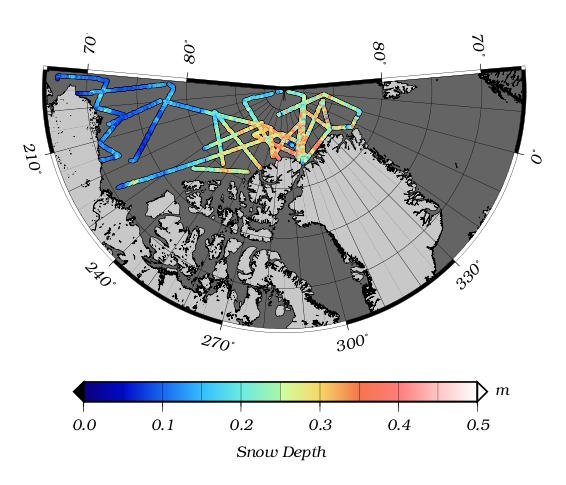
Quick look March 2015 snow depth, from optimal interpolation of NASA IceBridge snow radar and MERRA reanalysis data.
Snow depth from the NASA Operation IceBridge Arctic 2014 Sea Ice Science Results page.
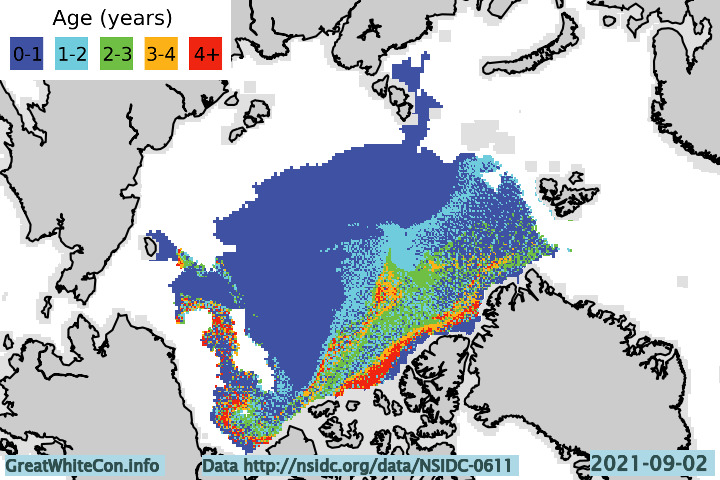
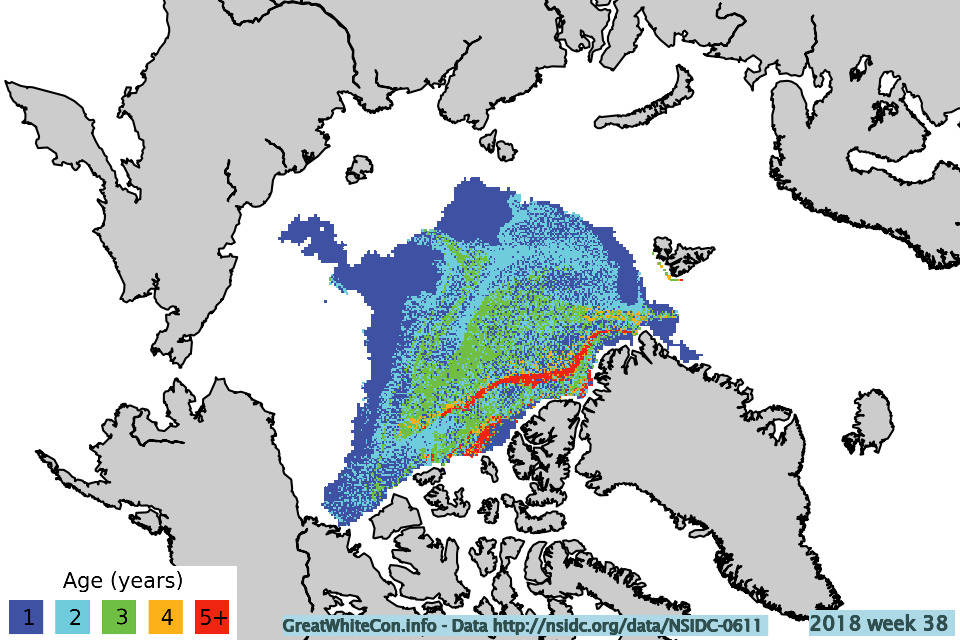
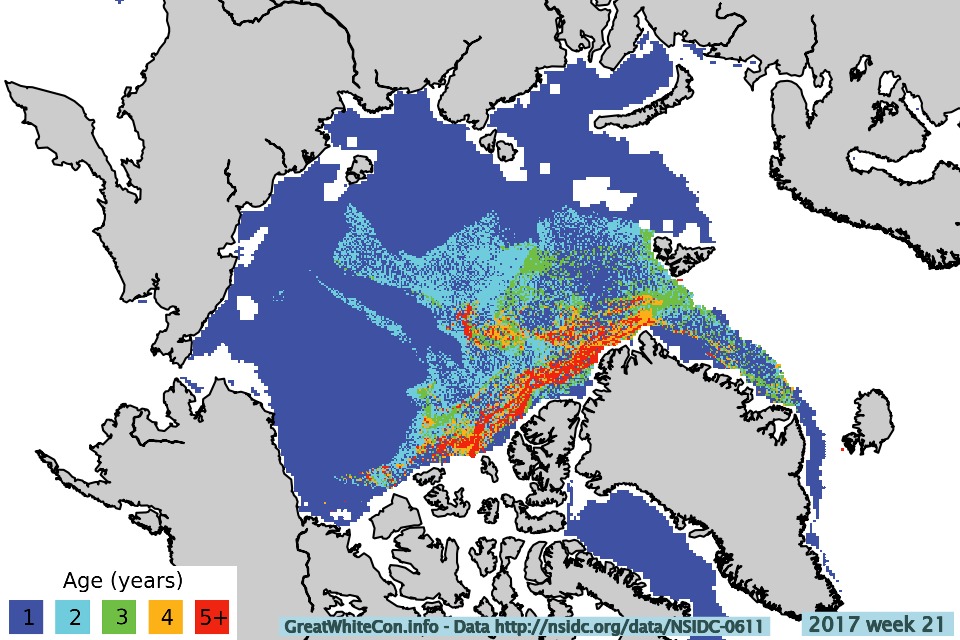
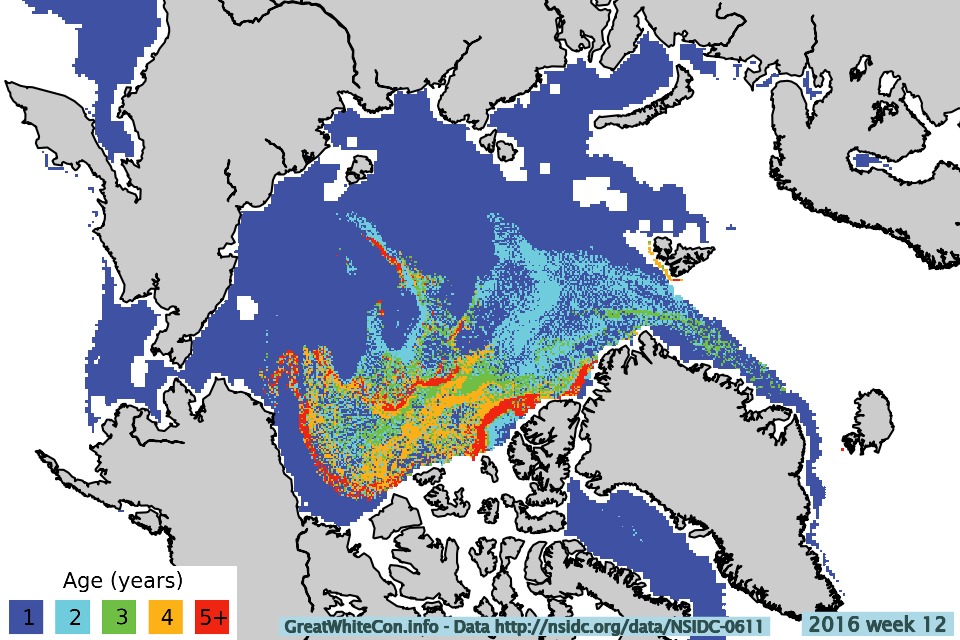
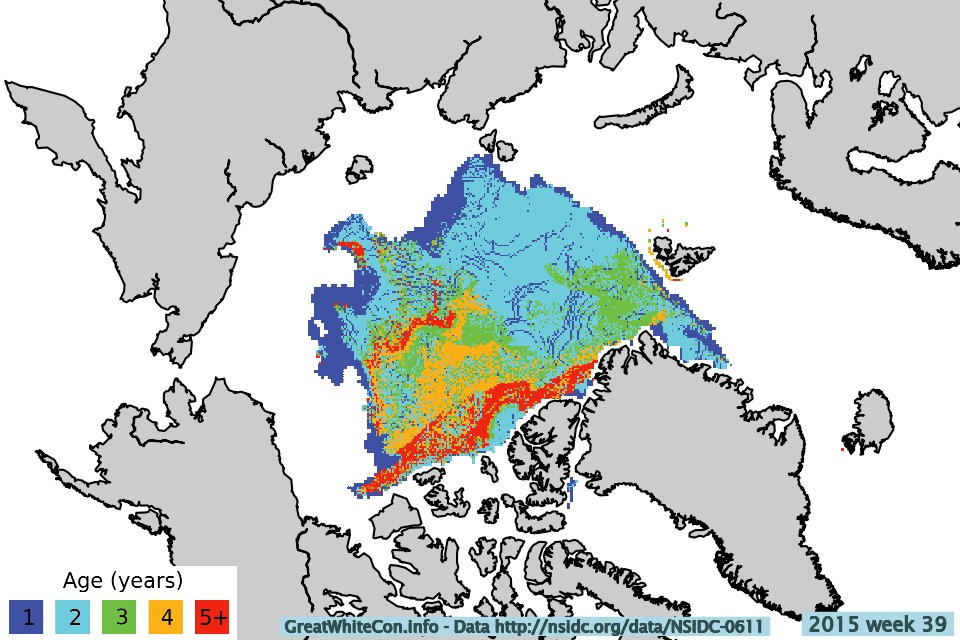
Sea Ice Drift Age Model:
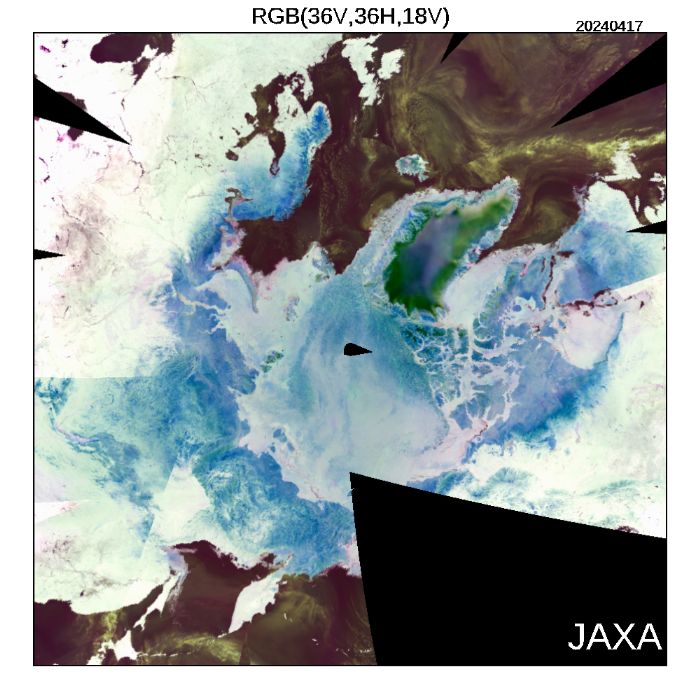
JAXA GCOM-W1/AMSR2 Daily RGB false colour image:
METOP-A Advanced Scatterometer (ASCAT) Daily Image:

METOP-A/B combined ASCAT Daily Image:

Arctic and Antarctic Research Institute Ice Type Analysis:


DMI HYCOM/CICE/ECMWF thickness
Arctic Sea Ice Leads
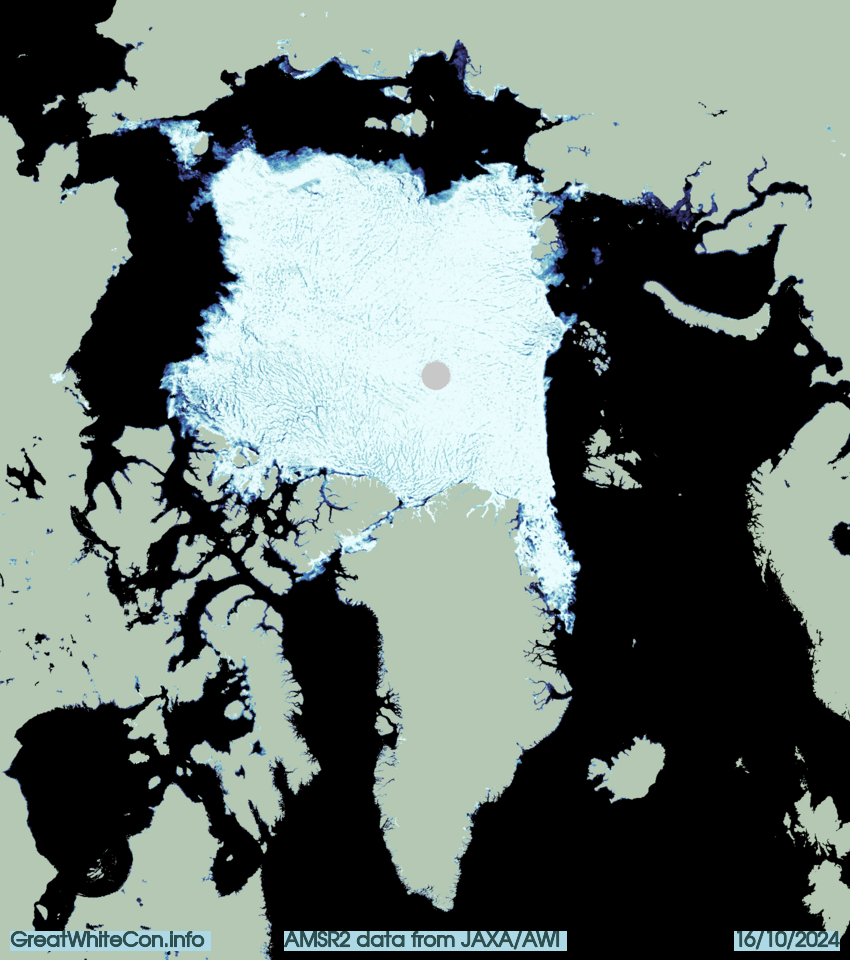
AMSR2 Arctic sea ice leads from the Alfred Wegener Institute
Arctic Sea Ice Concentration

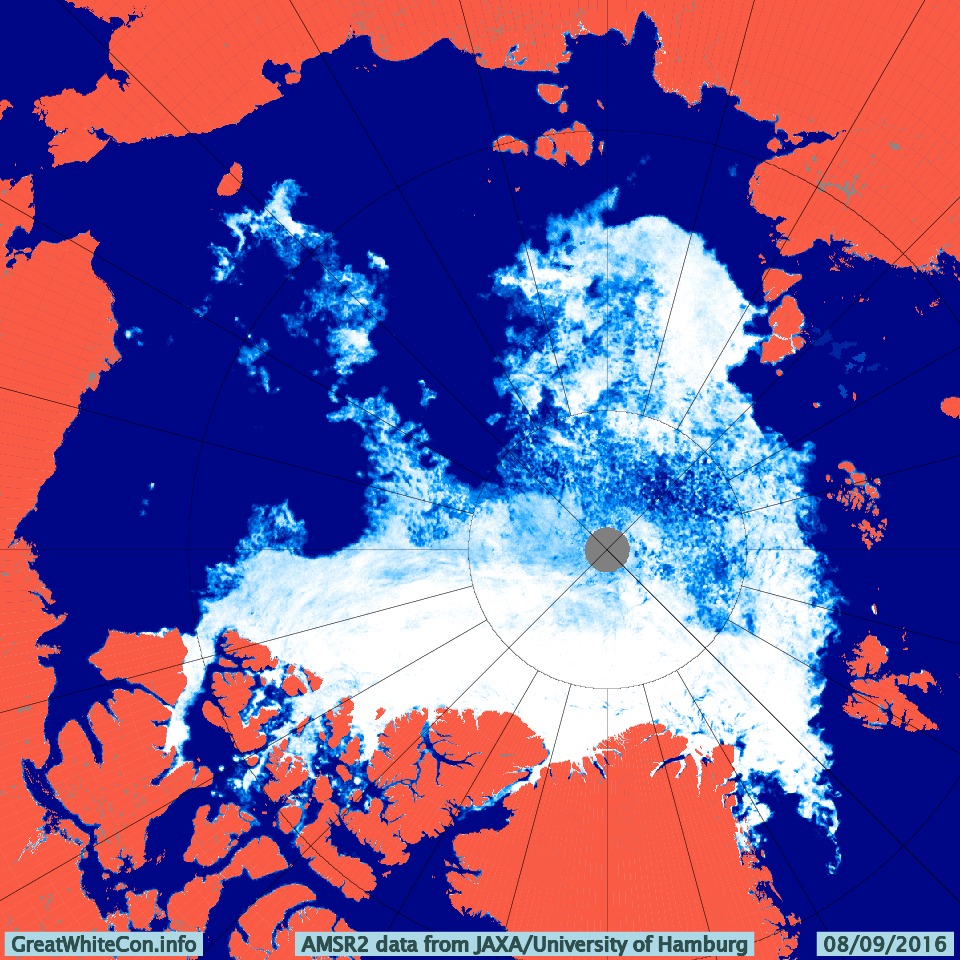
AMSR2 Arctic sea ice concentration from the Alfred Wegener Institute:
AMSR2 Arctic sea ice concentration from the University of Hamburg
Regional Arctic sea ice area from ArctischePinguin:
Arctic Basin sea ice area from ArctischePinguin:

Arctic sea ice compactness from ArctischePinguin:

Arctic sea ice regional compactness from ArctischePinguin:

Regional Arctic sea ice extent from ArctischePinguin:
Arctic Basin sea ice extent from ArctischePinguin:

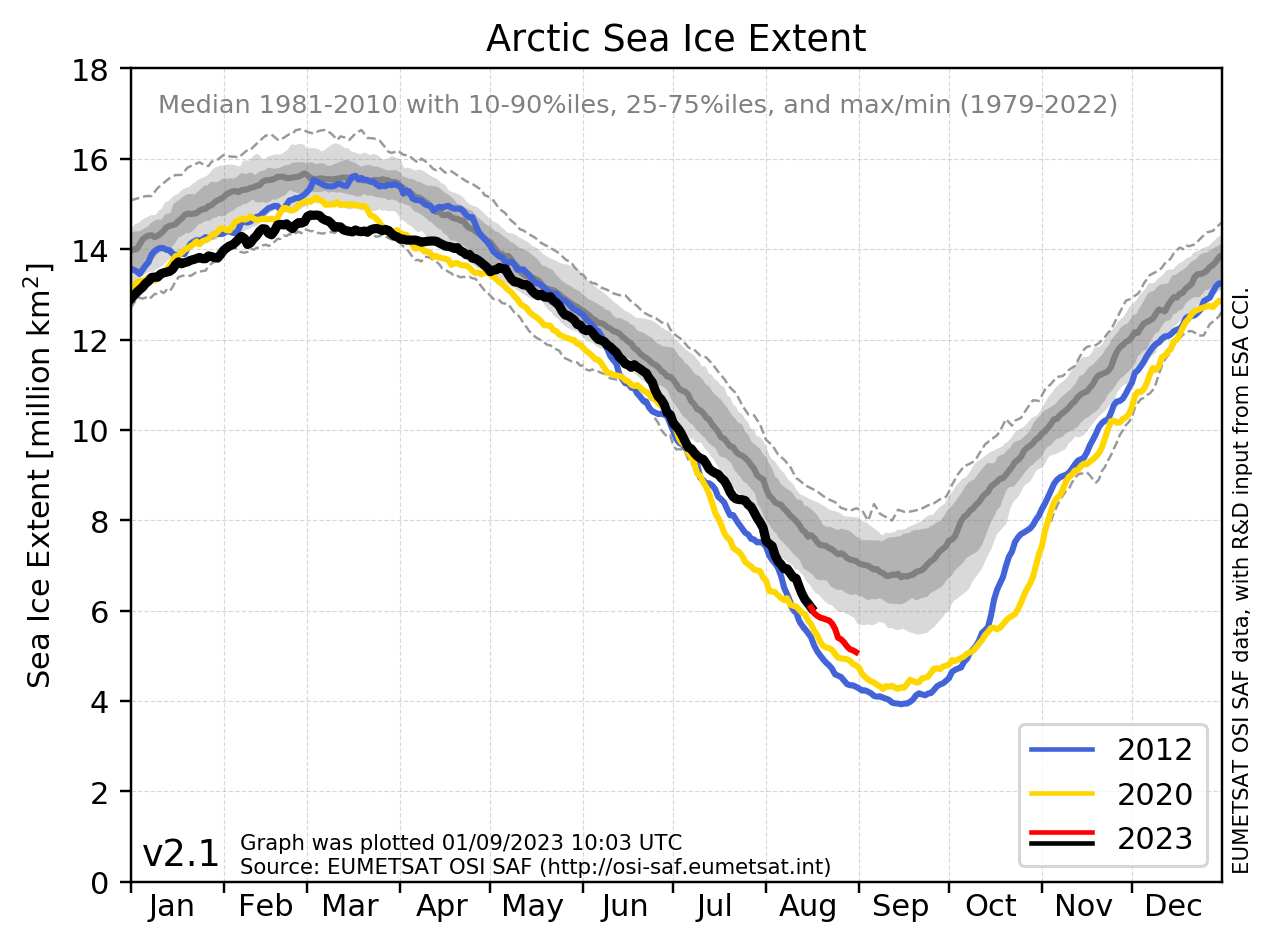
Arctic sea ice extent from the EUMETSAT Ocean and Sea Ice Satellite Application Facility:
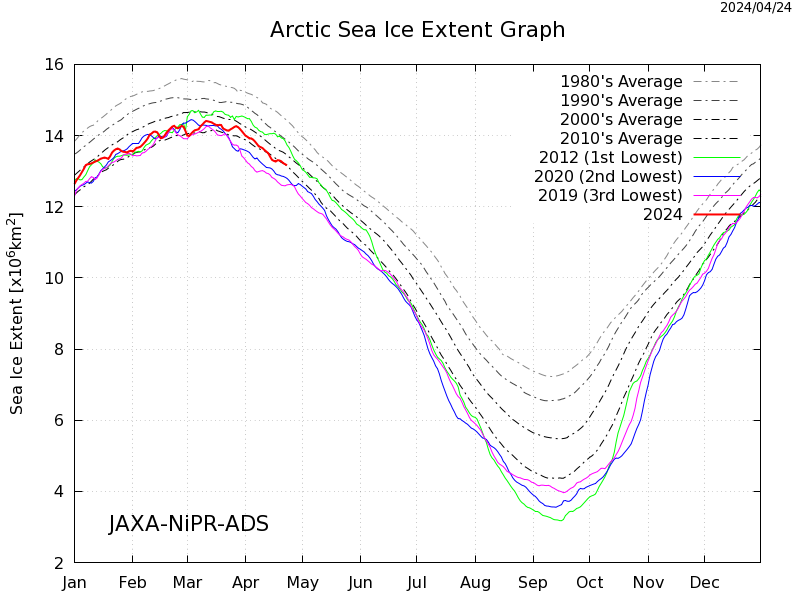
Arctic sea ice extent from the Japan Aerospace Exploration Agency:
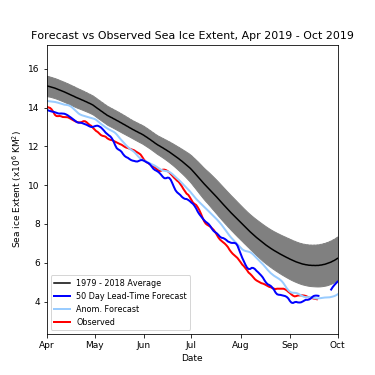
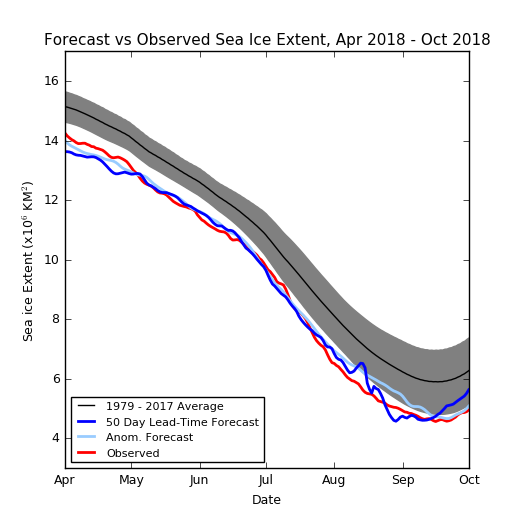
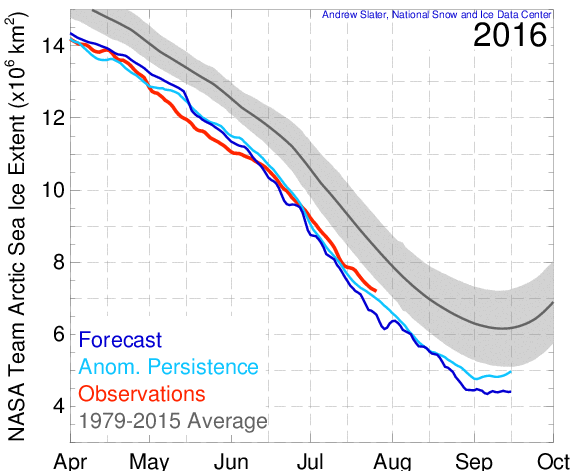
Slater Probabilistic Ice Extent, courtesy of Andrew Slater at the NSIDC


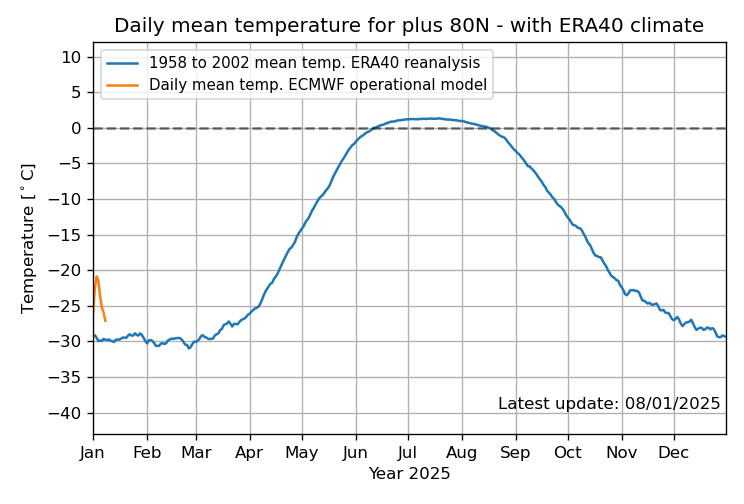
DMI Average Air Temperatures north of 80°
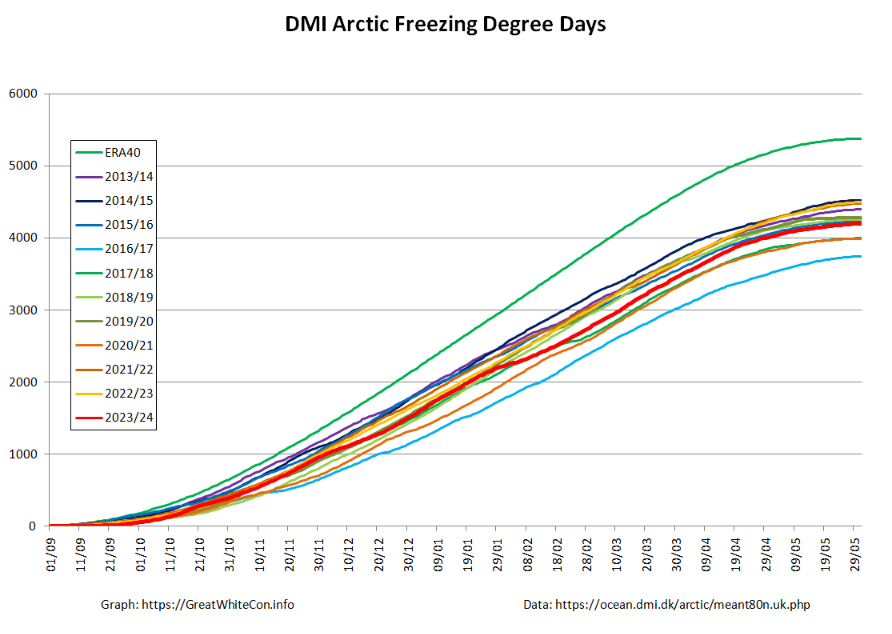
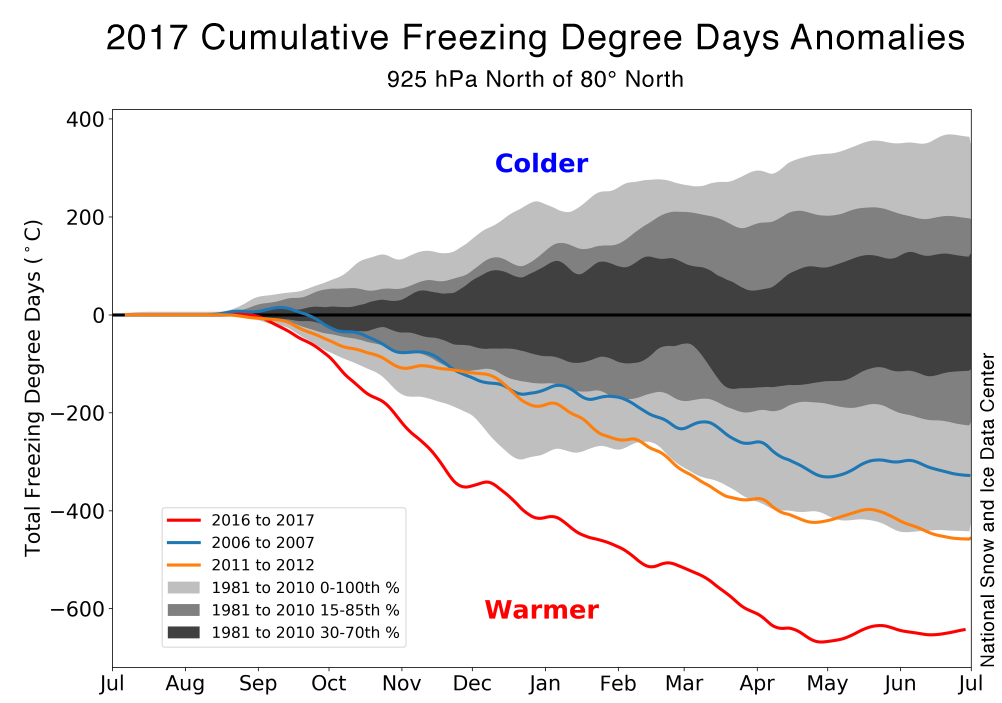
Arctic Freezing Degree Days based on DMI >80N data:
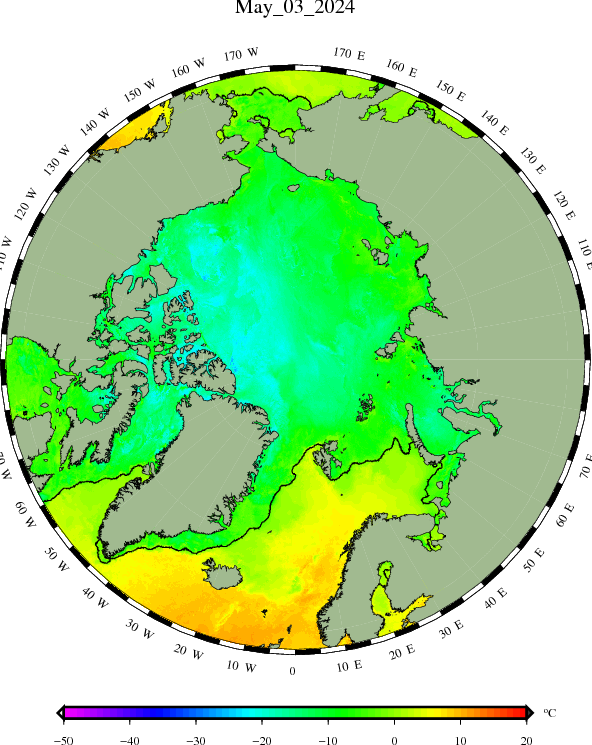
Arctic Ocean 925hPa Temperature, courtesy of Andrew Slater at the NSIDC:


DMI Ice Temperature
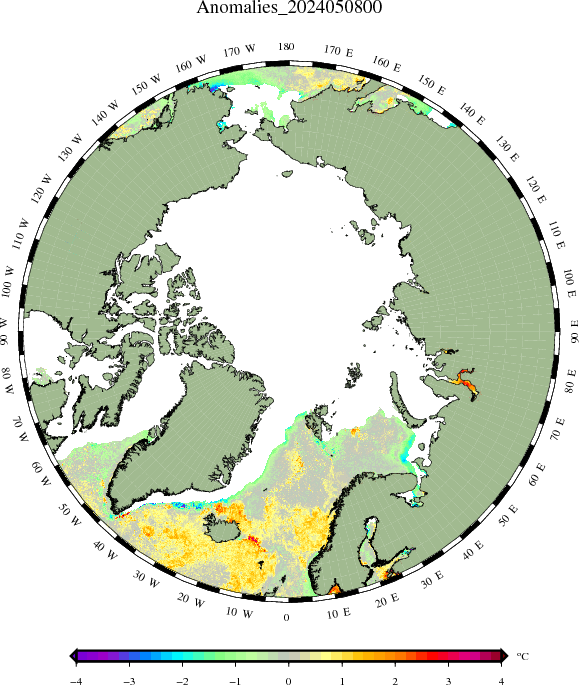
DMI Sea Surface Temperature Anomaly
GOFS 3.1 sea surface temperature
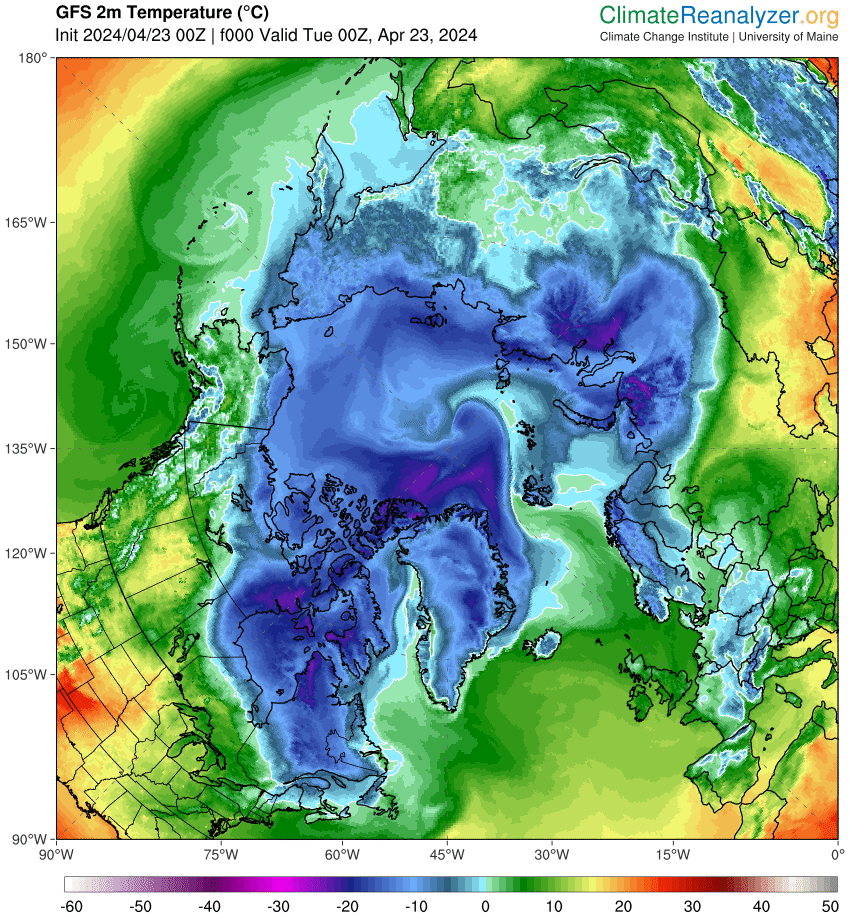
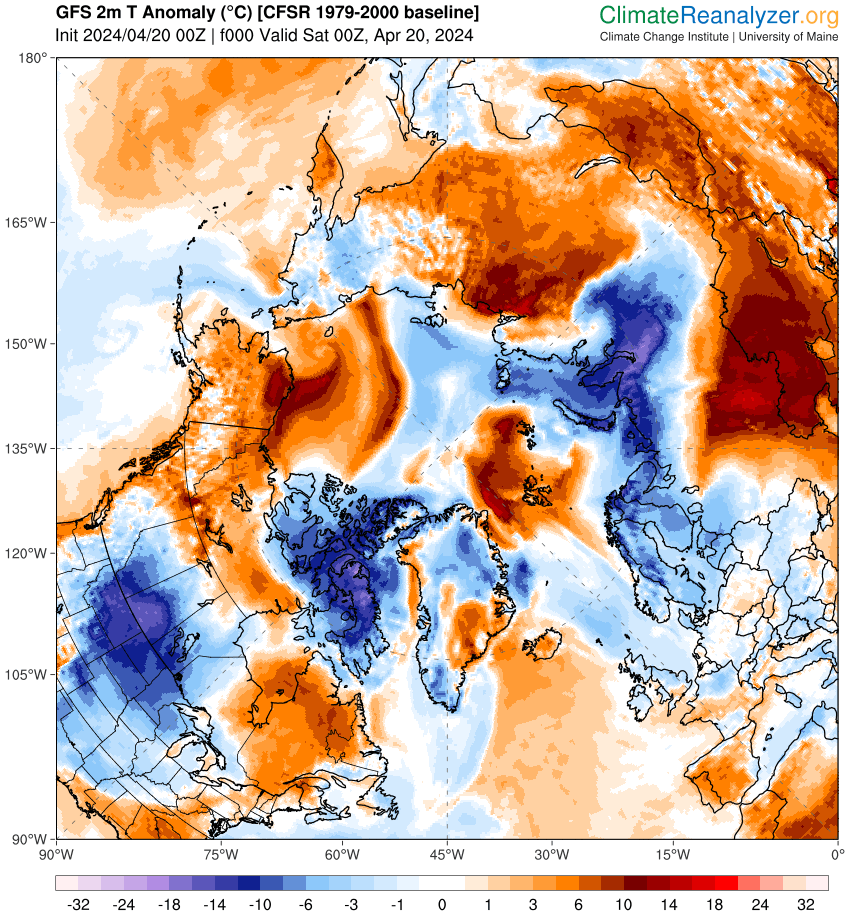
Climate Reanalyzer GFS Air Temperature
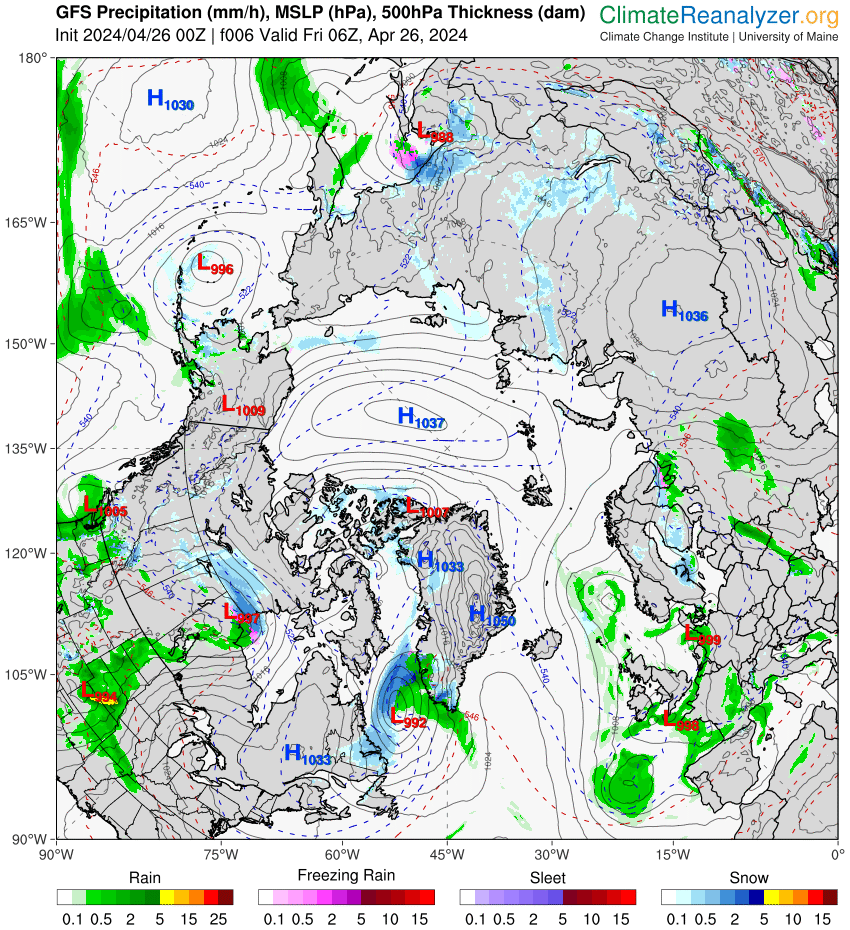
Climate Reanalyzer GFS Precipitable Water

See also our Arctic ice mass balance buoys overview page, our Arctic sea ice images page and our Arctic sea ice videos page.
Constructive technical criticism is welcome on the introductory blog post. For discussions about interpreting the information please comment on the “About Our Arctic Sea Ice Resources” page.