According to David Rose in the Mail on Sunday on September 8th:
An unbroken ice sheet more than half the size of Europe already stretches from the Canadian islands to Russia’s northern shores.
That’s not the way we see it. This is:
October 20th 2013:

From “The Balding Arctic Exposed”
October 9th 2013:
Russia’s Northern Shores – Here at Great White Con Ivory Towers we’ve received a couple of letters from The Daily Telegraph recently, both signed Robert Winnett, Head of News. Here’s an extract from one of them:
“In reply to your enquiry, the Telegraph’s policy is to correct clear inaccuracies once we are alerted to them – and in appropriate cases update articles on our website”.
This is yet another alert for you Robert. There was no “reputable evidence… to show an unbroken ice sheet more than half the size of Europe already stretches from the Canadian Islands to Russia’s northern shore” on September 8th 2013. This video discusses a variety of sources of both reputable and disreputable evidence!
The music is “The Hanging Cloud” by “Foales Arishes” who are based in Devon (as the name suggests!) from the charity compilation album “Water Connects Us”: http://Water-Connects-Us.org
Reputable evidence:
Original AMSR2 microwave images by the University of Hamburg: ftp://ftp-projects.zmaw.de/seaice/AMSR2/
Vilkitsky Strait video by Tara Expeditions: http://oceans.taraexpeditions.org/
Arctic sea ice extent video from NASA: http://www.nasa.gov
The OBuoy #7 webcam – http://obuoy.datatransport.org/monitor#buoy7/movie
Disreputable evidence:
The NASA video is also reproduced online by The Telegraph, where it is currently mistitled “Nasa animation shows Antarctic ice cap fluctuations”: http://www.telegraph.co.uk/earth/environment/climatechange/10339674/Climate-change-report-Nasa-animation-shows-Antarctic-ice-cap-fluctuations.html
September 29th 2013:
Santa’s Secret Summer Swim – Amongst other things an animation revealing how the Arctic sea ice concentration and extent changed between September 13th and September 27th 2013. The 2013 NSIDC minimum extent of 5.099 million km² occurred on September 13th.
As you can see, the sea ice in the Arctic has many holes and cracks in it, and lots of open water around it. It is not therefore an “unbroken sheet that already stretches from the Canadian islands to Russia’s northern shores”, as maintained by David Rose in the Mail on Sunday edition of September 8th. On the evening of September 28th the Mail Online published a “corrected” version of that article, replacing the ludicrous original numbers with those calculated by The Great White Con. However they contrived to continue The Con by blaming their error on an NSIDC “typo” – https://greatWhiteCon.info/2013/09/the-mail-makes-modest-amends/
Also discussed in the video is the recent IPCC AR5 Working Group 1 meeting in Stockholm – http://econnexus.org/ipcc-say-human-influence-on-the-climate-system-is-clear/
The Arctic Sea Ice Forum – http://forum.arctic-sea-ice.net/
The OBuoy #7 webcam – http://obuoy.datatransport.org/monitor#buoy7/camera
The voyage through the Northwest Passage of the MV Nordic Orion – http://econnexus.org/the-northwest-passage-is-open-for-business/
The Arctic circumnavigation by the yacht Tara – http://econnexus.org/tara-reaches-open-waters-of-lancaster-sound/
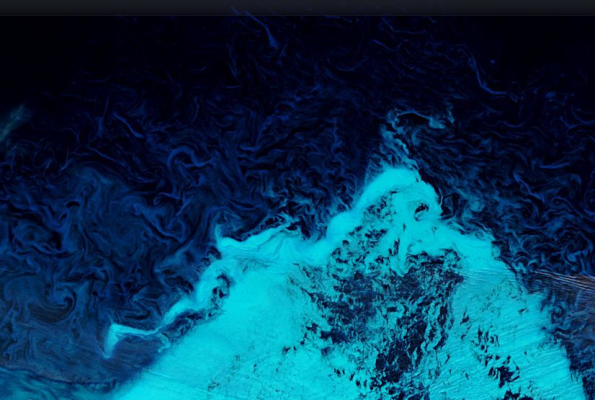
and finally some beautiful Central Arctic Art – https://greatwhitecon.info/2013/09/central-arctic-art/
The music is “Bruce Willis” by Bristol band “ICYFH” from the charity compilation album “Water Connects Us”: http://Water-Connects-Us.org
Original AMSR2 microwave images by the University of Bremen: http://www.iup.uni-bremen.de:8084/amsr2/
Arctic sea ice extent data from NSIDC: http://nsidc.org/arcticseaicenews/charctic-interactive-sea-ice-graph/
September 22nd 2013:

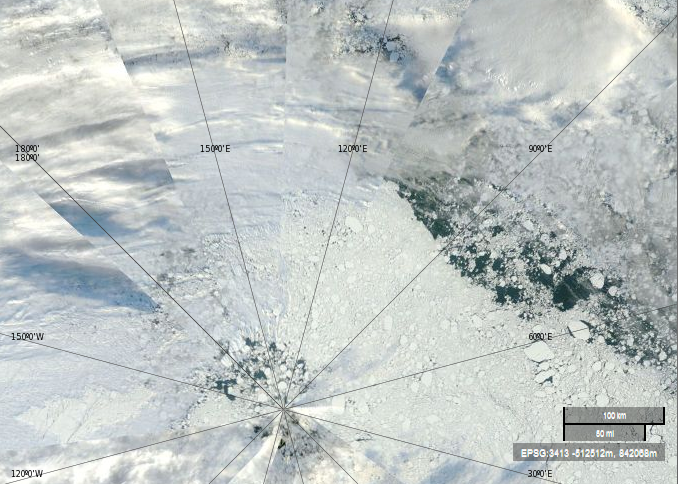
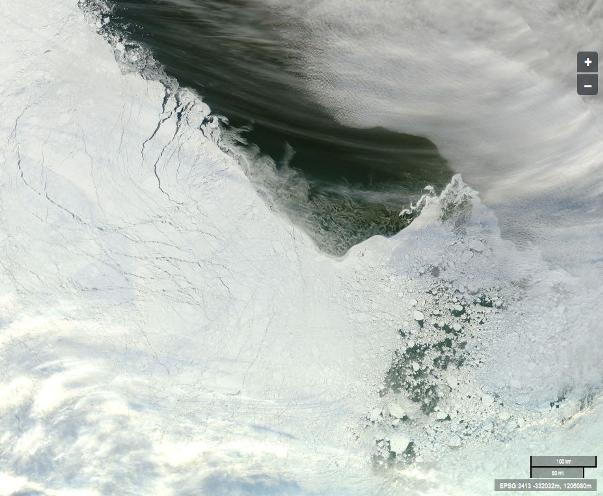
Notice the “Polar Polynya” conspicuous only by its absence from the graphics accompanying the article by David Rose published in the Mail on Sunday on that date. Notice also the wide band of blue ocean between the ice edge and “Russia’s northern shores”.
September 21st 2013:

Image courtesy NASA Worldview from the Aqua satellite.
September 20th 2013:

Image courtesy of NASA Worldview from from the Aqua satellite.
September 18th 2013:
The “Polar Polynya” Reappears! – An animation revealing how the Arctic sea ice changed between September 1st and September 18th 2013. The (preliminary) 2013 NSIDC minimum extent of 5.099 million km² occurred on September 13th.
By September 18th the “Polar Polynya” appears to be reopening, and moving ever closer to the North Pole.
As you can see, the sea ice in the Arctic has many holes and cracks in it, and lots of open water around it. It is not therefore an “unbroken sheet that already stretches from the Canadian islands to Russia’s northern shores”, as maintained by David Rose in the Mail on Sunday edition of September 8th.
The music is “Clean Song” by West Somerset duo “De Larje” from the charity compilation album “Water Connects Us”: http://Water-Connects-Us.org
Original AMSR2 microwave images by the University of Hamburg: ftp://ftp-projects.zmaw.de/seaice/AMSR2/
Arctic sea ice extent data from NSIDC: http://nsidc.org/arcticseaicenews/charctic-interactive-sea-ice-graph/
September 13th 2013:
An Unbroken Ice Sheet? – An animation revealing how the Arctic sea ice changed between August 15th and September 13th 2013, the date of the preliminary 2013 NSIDC minimum extent at 5.099 million km², 49% above the record 2012 minimum of 3.41 million km².
As you can see, the sea ice in the Arctic has many holes and cracks in it, and lots of open water around it. It is not therefore an “unbroken sheet that already stretches from the Canadian islands to Russia’s northern shores”, as maintained by David Rose in the Mail on Sunday September 8th 2013 edition .
The music is “World of Trouble” by Russian band “Void Void” from the charity compilation album “Water Connects Us”: http://Water-Connects-Us.org
Original AMSR2 microwave images by the University of Bremen:
http://www.iup.uni-bremen.de:8084/amsr2/
Arctic sea ice extent data from NSIDC: http://nsidc.org/arcticseaicenews/charctic-interactive-sea-ice-graph/
Thanks for this.
However, if you were to update the graphic showing extent of ice, would it be possible to provide more geographical indications, for those of us who are not used to seeing the world from the poles.
E.g. indicating degrees for the four major meridians, or providing locations names (Canada, Russia, Spitsbergen, etc)
Thanks, and appreciate your work.
Hi TB,
Thanks for your comment and your kind words. I take your point, and I’ll give it some thought. Hopefully the location of the North Pole is obvious at least!
If you zoom in on the summer ice not much land is visible at all. Zoom back out a bit, and a load of legible labels might easily obscure the information of interest. Some of the products use a “Greenwich down” orientation, but the ones we’ve displayed so far all use “Greenland down”. That means Canada and Alaska are to the the left, the Bering Strait is in the top left corner, Russia’s at the top, and Svalbard and the Fram Strait are in the bottom right corner.
The main point to note is that if you look at visualisations of ice concentration, rather than ice extent, you see a very different picture.
Thank you for taking the time to expose the media distortions and (lets’s be frank) outright lies.
Much appreciated.