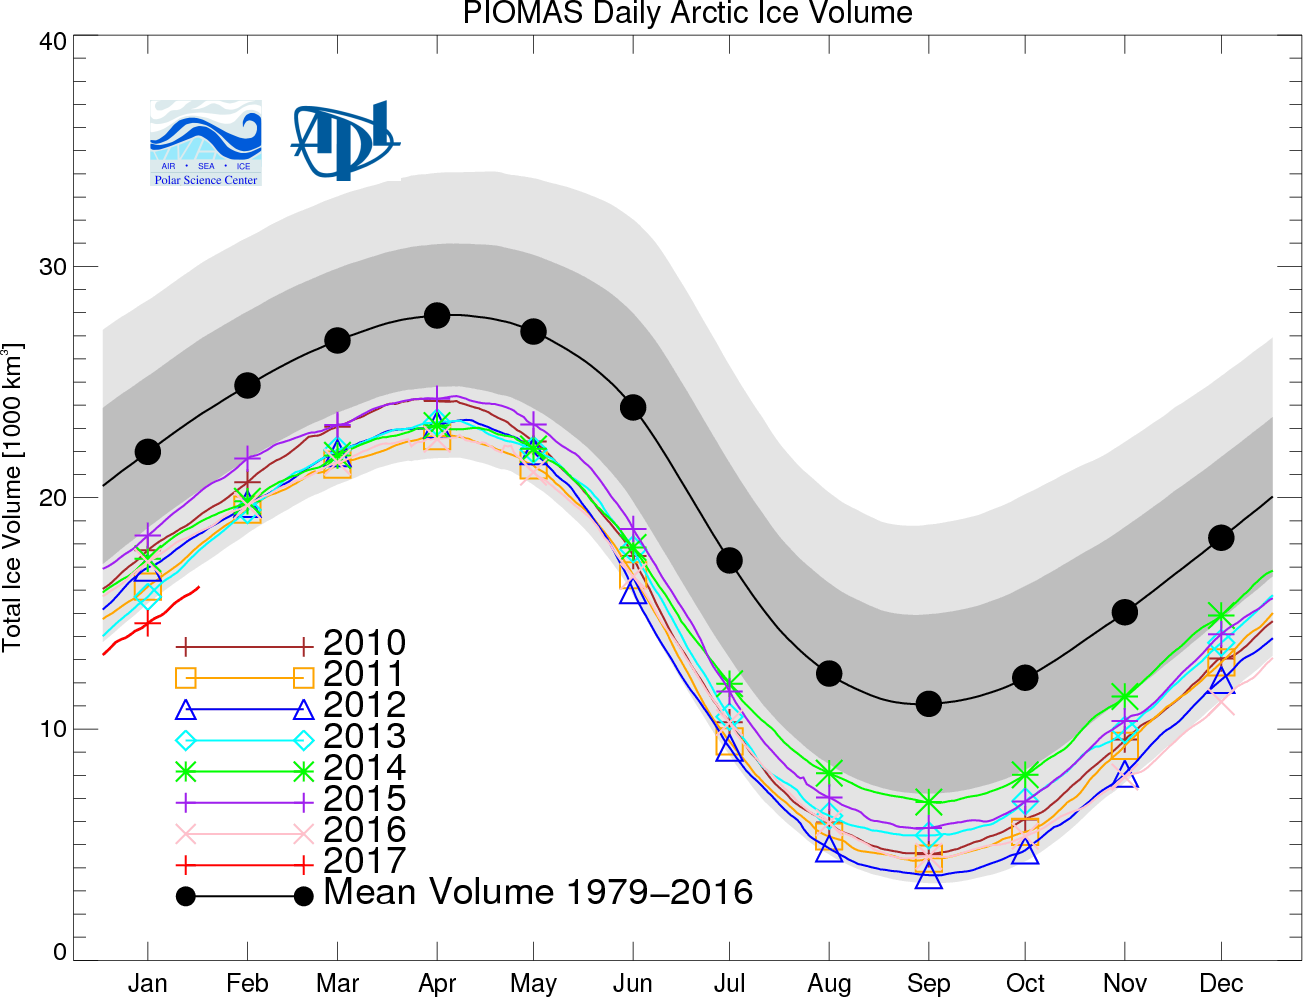
The PIOMAS Arctic sea ice volume numbers for January 2017 have just been published. Yet another new record low for the date:
Here’s the PIOMAS gridded thickness for January 31st, courtesy of Wipneus at the Arctic Sea Ice Forum:
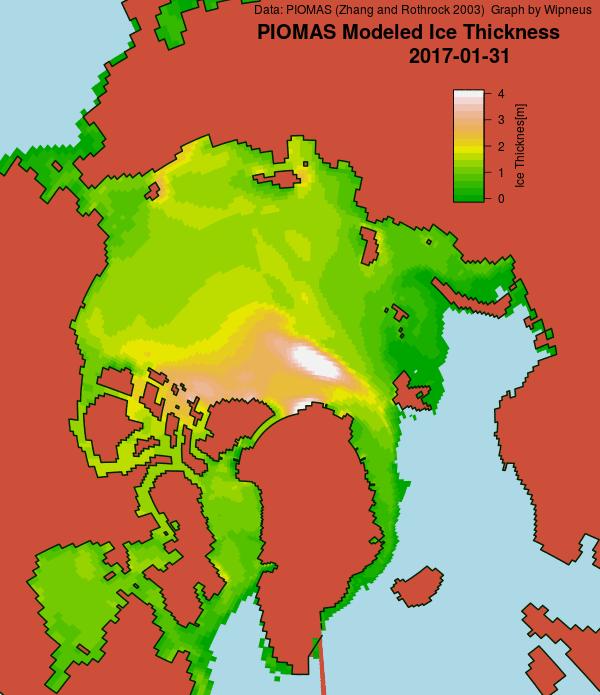
Somewhat anomalously it shows the thickest ice some distance away from the coast of Greenland and/or Ellesmere Island. Here too is Andy Lee Robinson‘s updated PIOMAS “Arctic death spiral”:

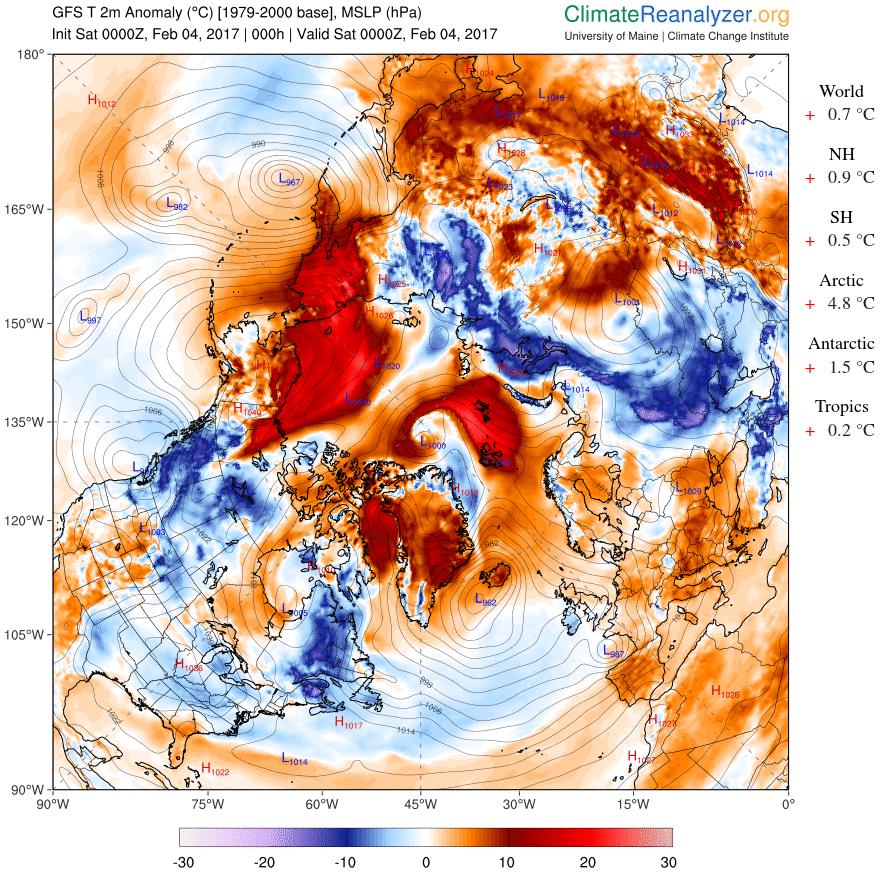
Meanwhile yet more anomalously warm air is entering the Arctic Basin from both the Pacific and Atlantic sides:
That sort of thing has happened quite a few times over the 2016/17 freezing season, as you can see from this graph of cumulative Freezing Degree Days (FDD for short):
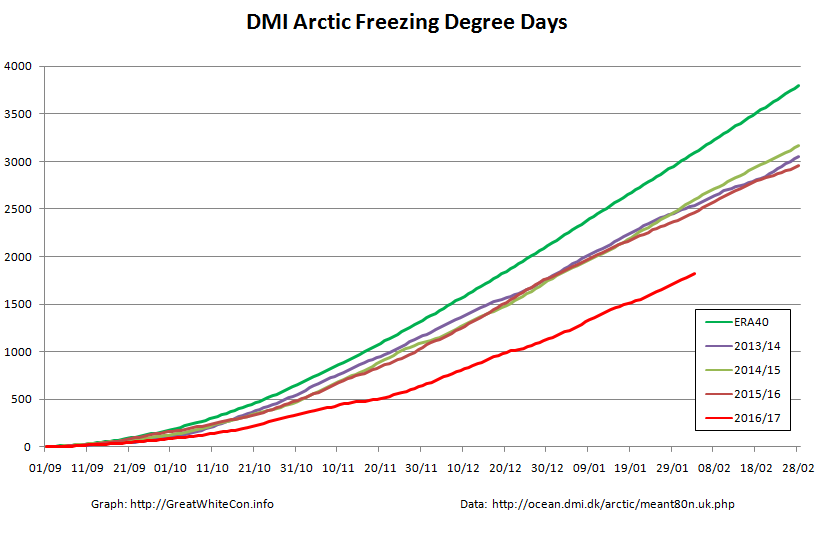
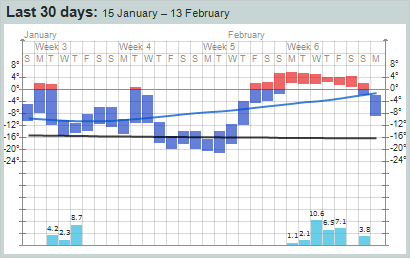
The FDD graph is based on the same data as the probably much more familiar DMI “Daily mean temperatures for the Arctic area north of the 80th northern parallel” graph:
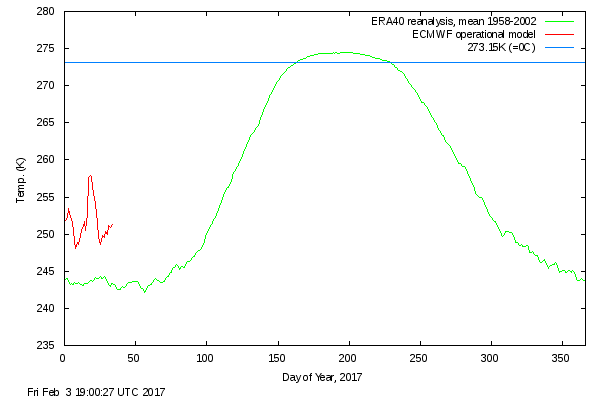
Things are warming up in the Arctic once again.
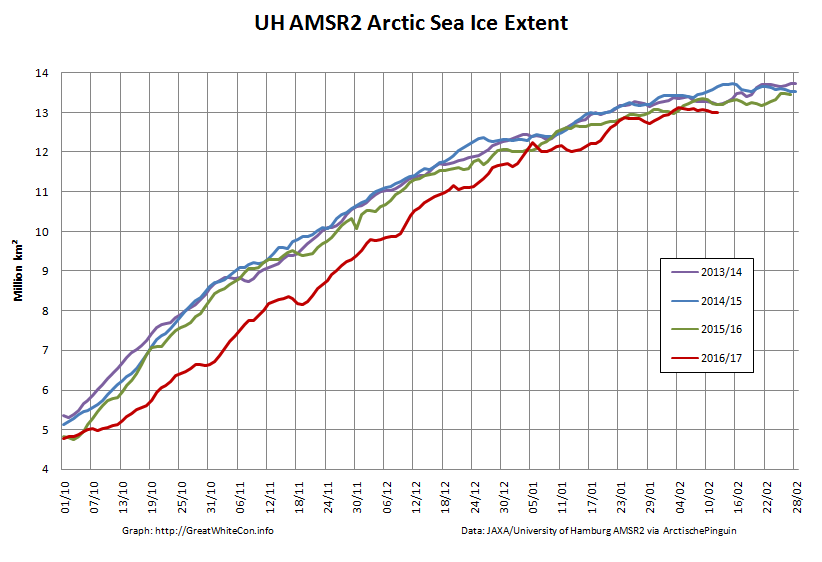
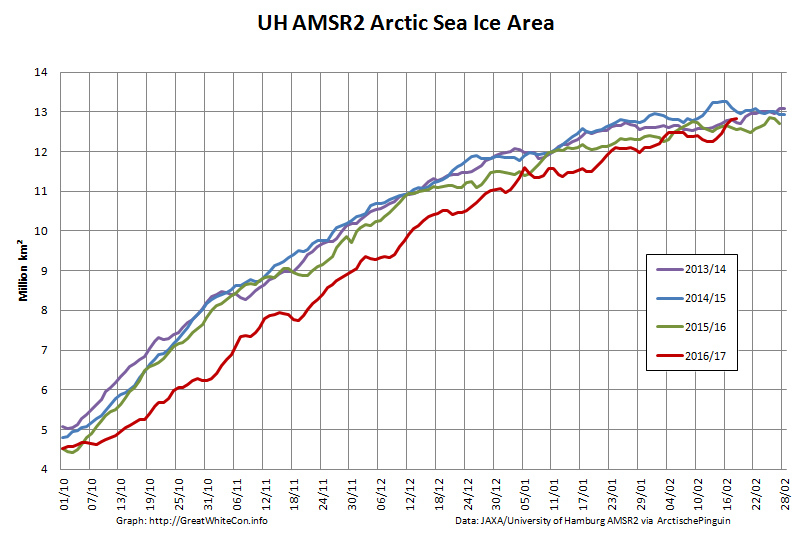
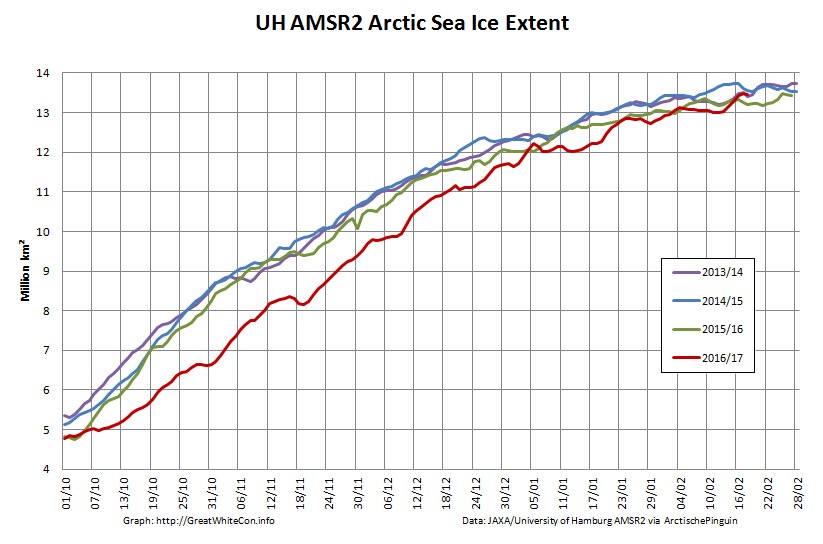
Whilst we await the arrival of the forecast anomalous warmth, how are some other metrics coming along? Here’s the high resolution AMSR2 area and extent:
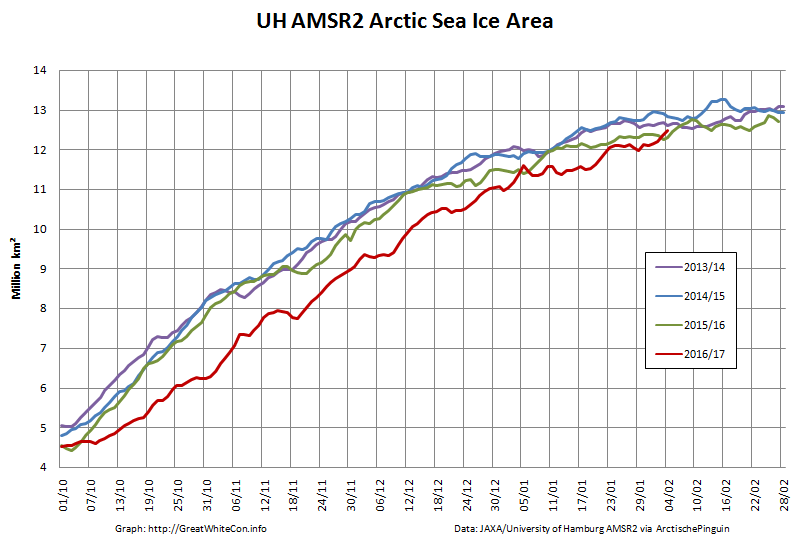
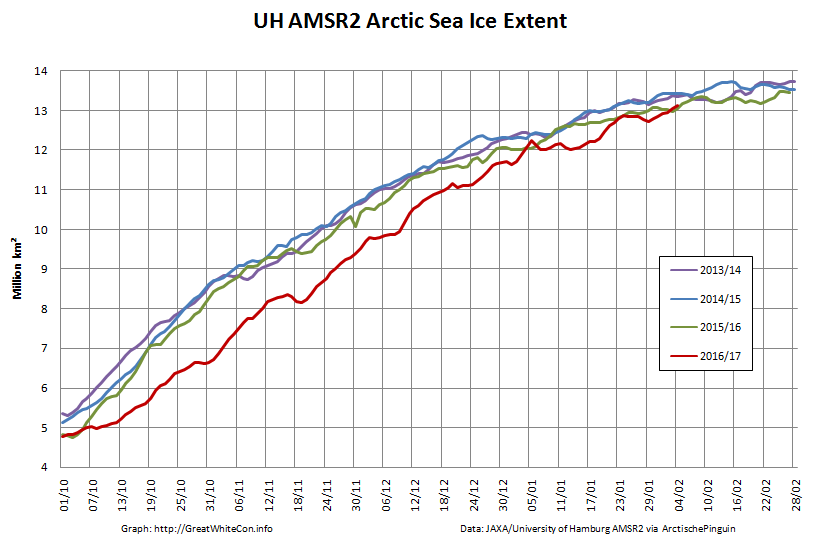
It looks like they’re back in the “normal” range for now, does it not?
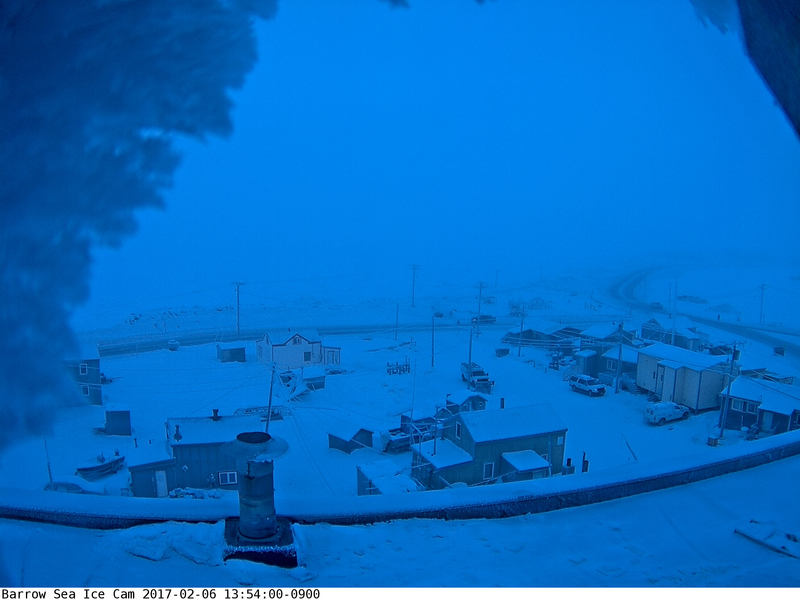
Things currently still look fairly frosty over on the Pacific side of the Arctic, as you can see from the webcam at Utqiagvik (Barrow as was):
However over on the Atlantic side (and especially for “Richard”!) melting can now be observed on Svalbard:
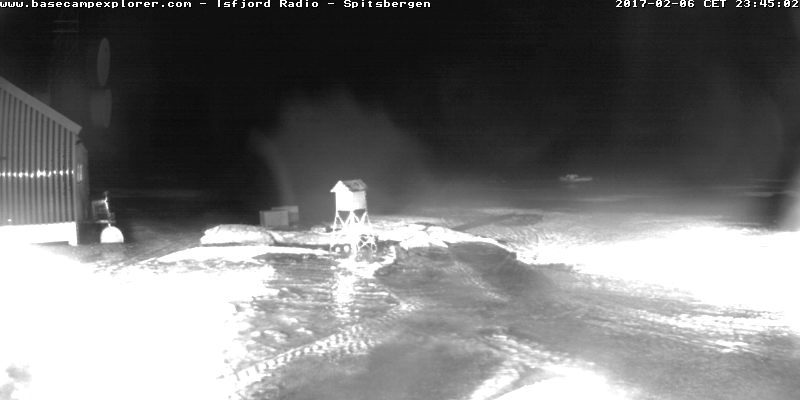
An extremely powerful cyclone off Greenland is pumping heat and moisture northwards:
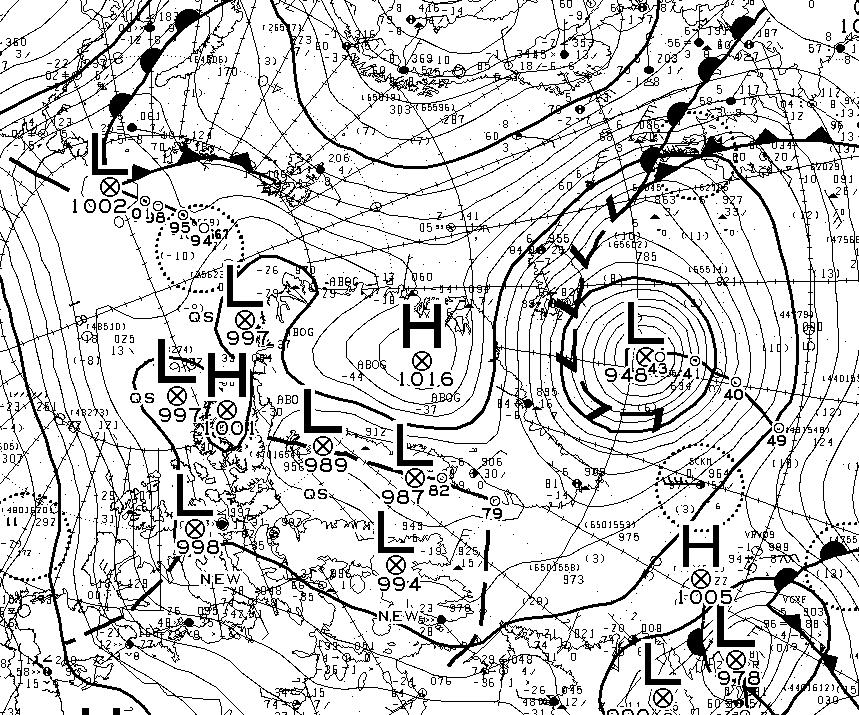
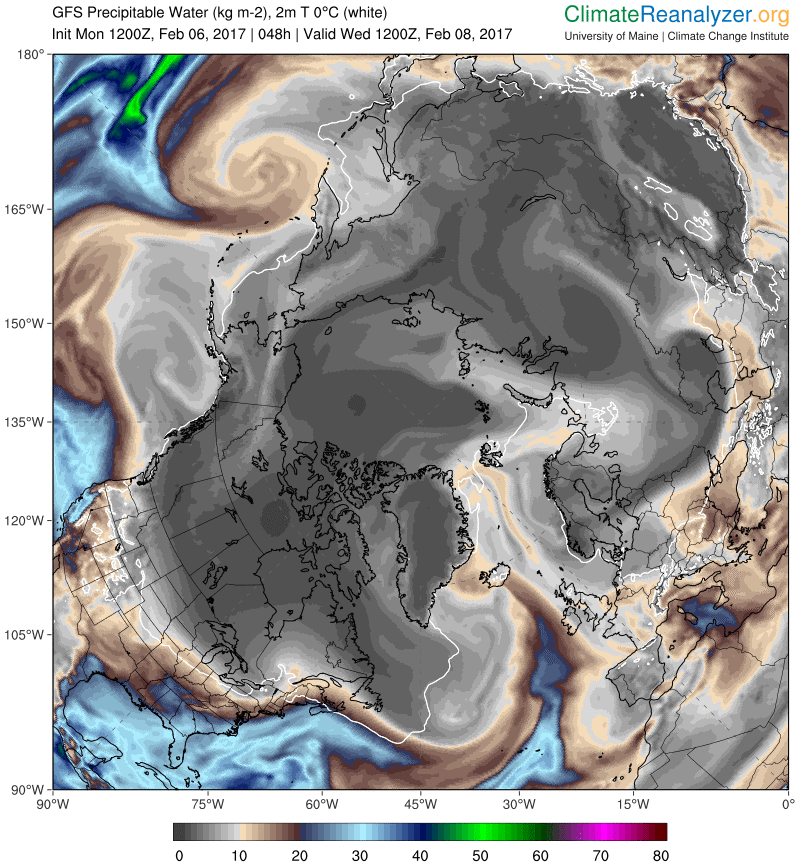
Note that the cyclone’s MSLP fell to 940 hPa earlier today. This is the GFS precipitable water forecast for Wednesday lunchtime:
Finally, for the moment at least, here’s the current weather forecast for Longyearbyen in Svalbard:
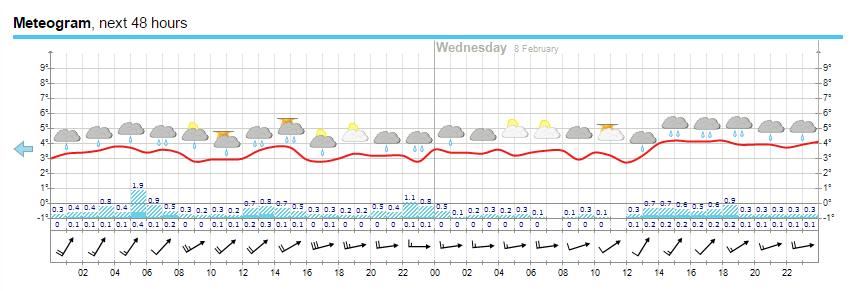
All in all there’s plenty more heat and moisture on the way.
The temperatures in Svalbard have now dropped back below freezing point:
As temperatures over parts of the Arctic Basin have reached zero degrees Celsius and above, Arctic sea ice extent has been declining:
Now take a look at area:

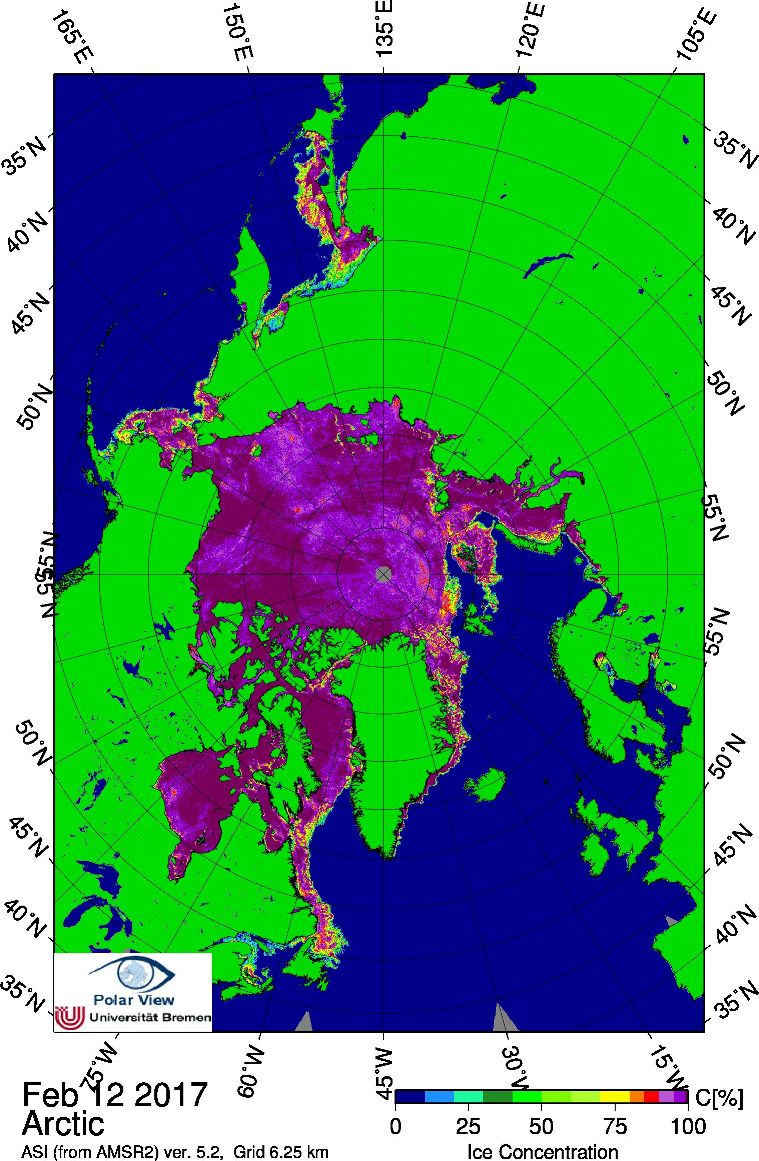
Area has declined a lot! That’s because sea ice concentration is now noticeably <100% across much of the Arctic:
There’s also been a discernable change in slope of the DMI freezing degree days graph:

There’s been a late spurt of growth in both area and extent, which are now back in the pack of previous years:
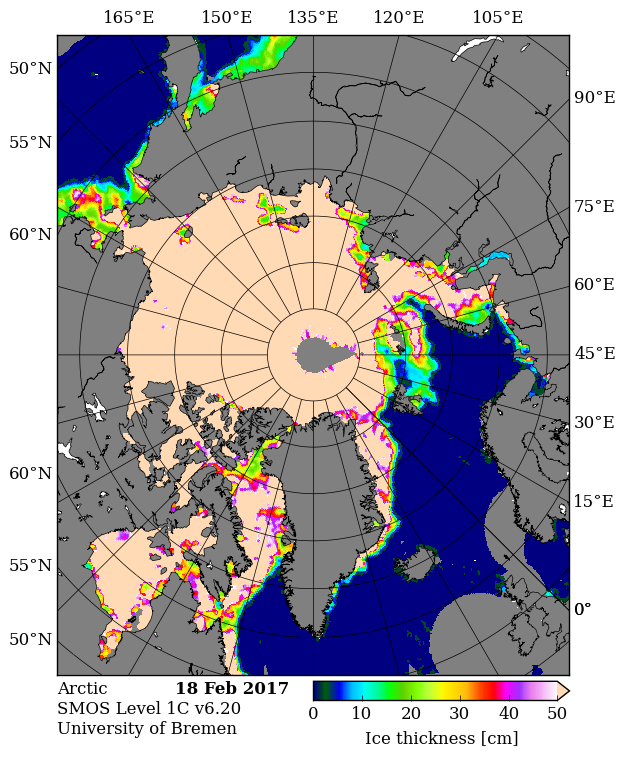
The newly frozen areas are currently still very thin:
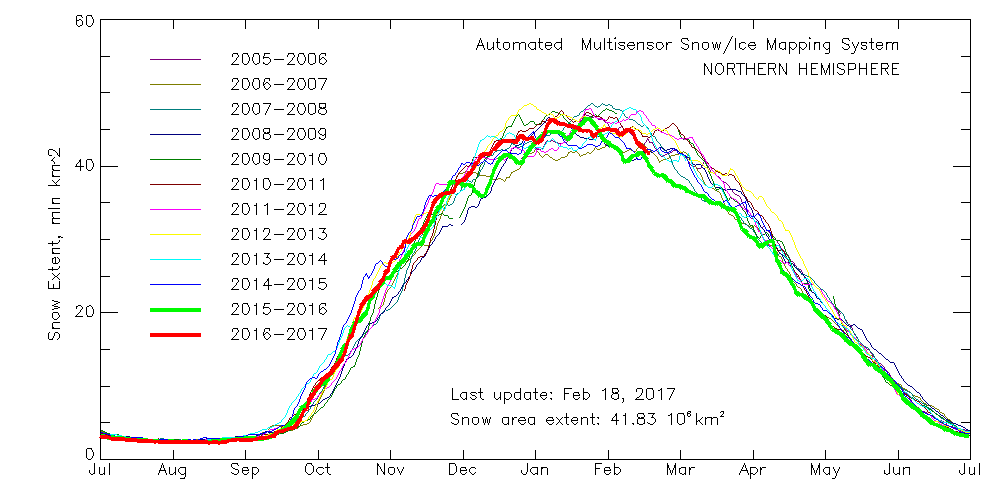
Meanwhile northern hemisphere snow cover has started to melt in earnest:
Watch this space!