 Perovich, D., J. Richter-Menge, B. Elder, T. Arbetter, K. Claffey, and C. Polashenski, Observing and understanding climate change: Monitoring the mass balance, motion, and thickness of Arctic sea ice, http://IMB.crrel.usace.army.mil, 2014.
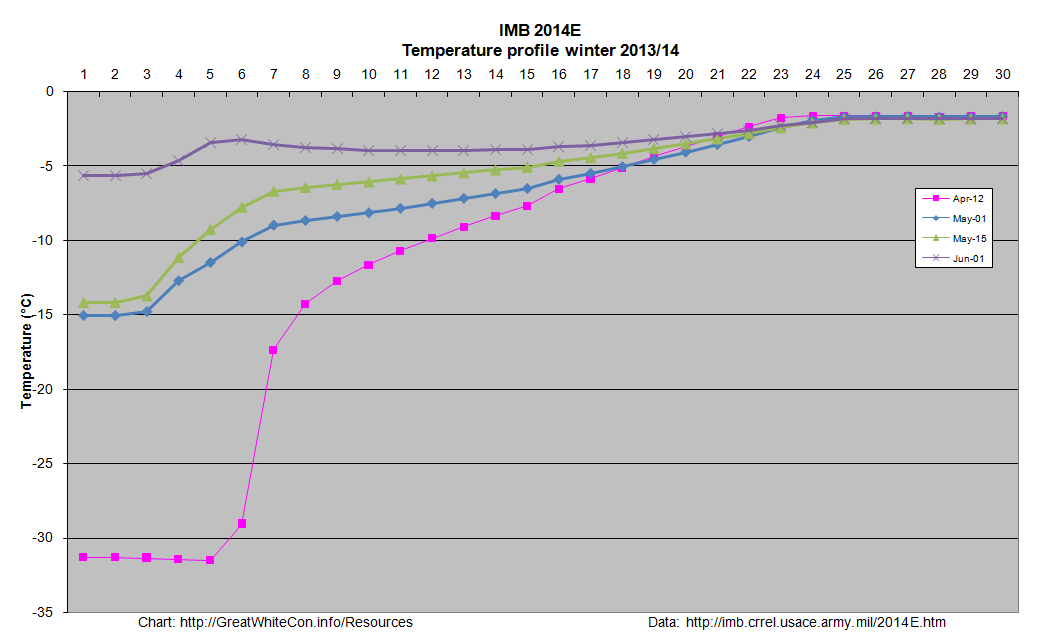
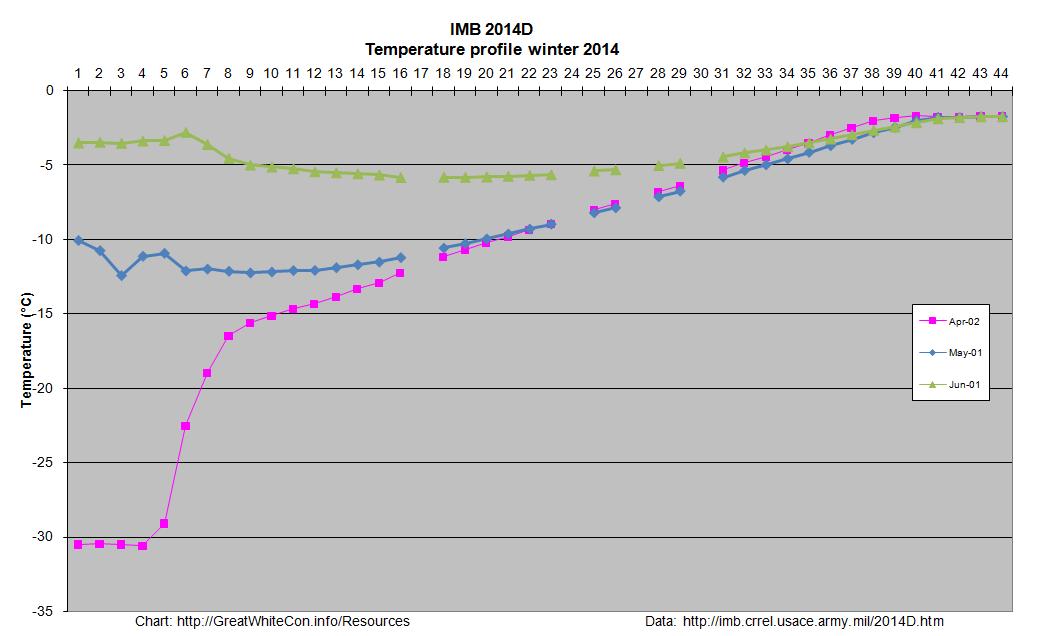
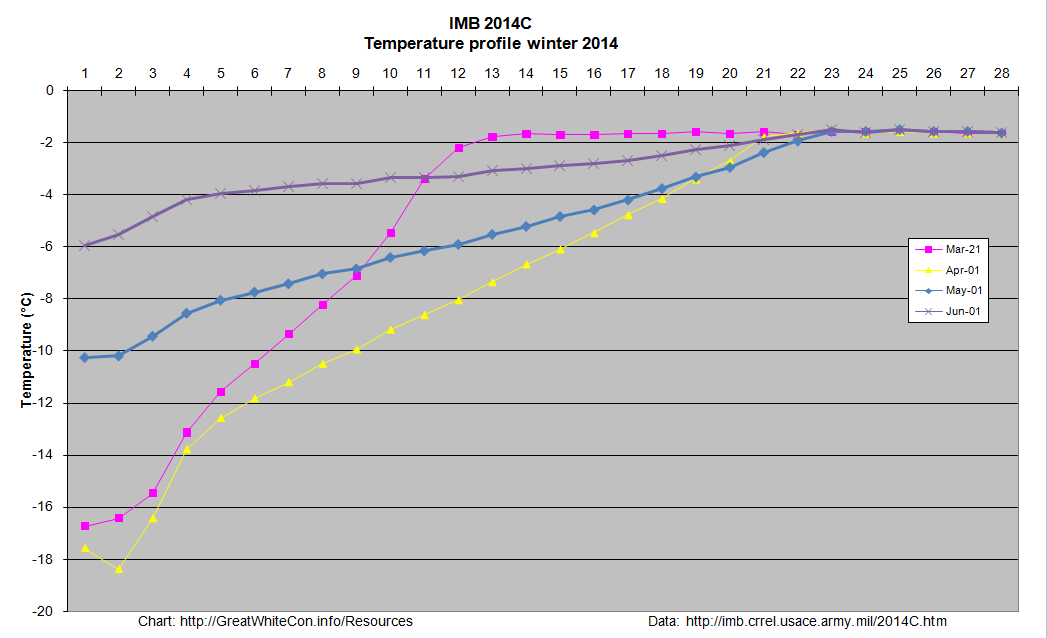
Google Maps/Earth format data and temperature profiles for all active ice mass balance buoys for the period October 1st 2013 to June 1st 2014. See the ice mass balance buoy introduction for an explanation of the graphs. Click the pushpins on the Google maps for additional information:
View IMB 2014E in a full screen map
View IMB 2014D in a full screen map
View IMB 2014C in a full screen map
View IMB 2014B in a full screen map

View IMB 2013I in a full screen map
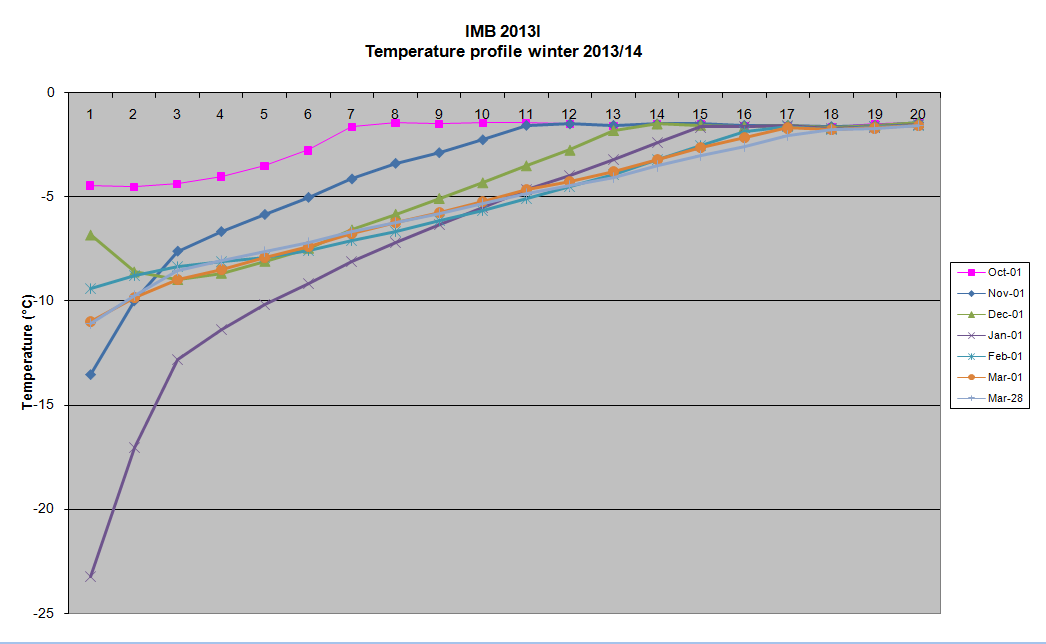 [Note that IMB 2013I thermistors became unreliable on March 29th 2014]
View IMB 2013H in a full screen map
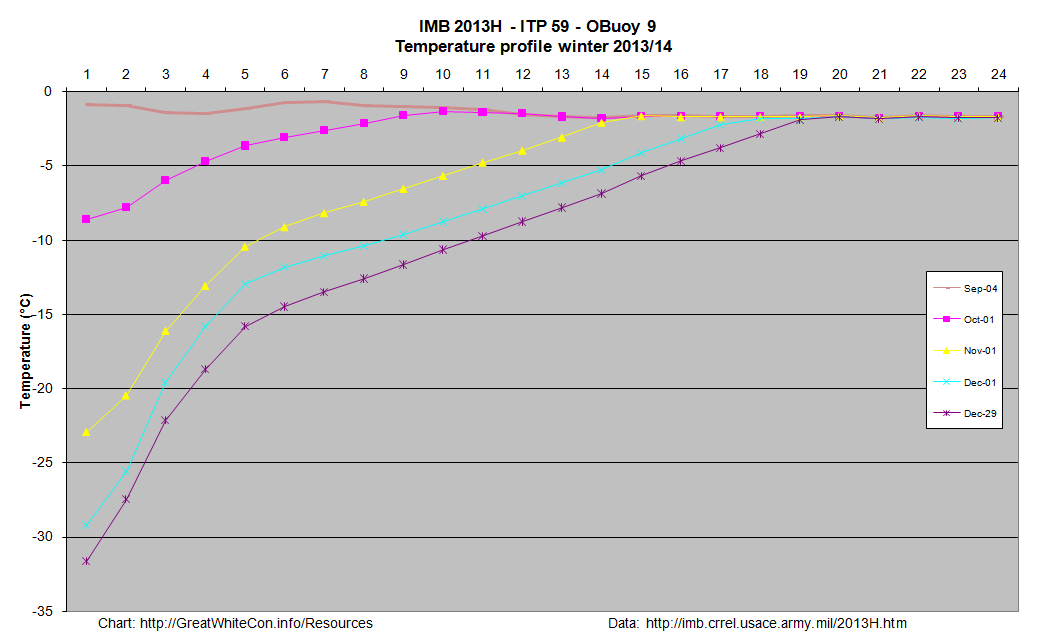 [Note that IMB 2013H stopped transmitting data on December 29th 2013]
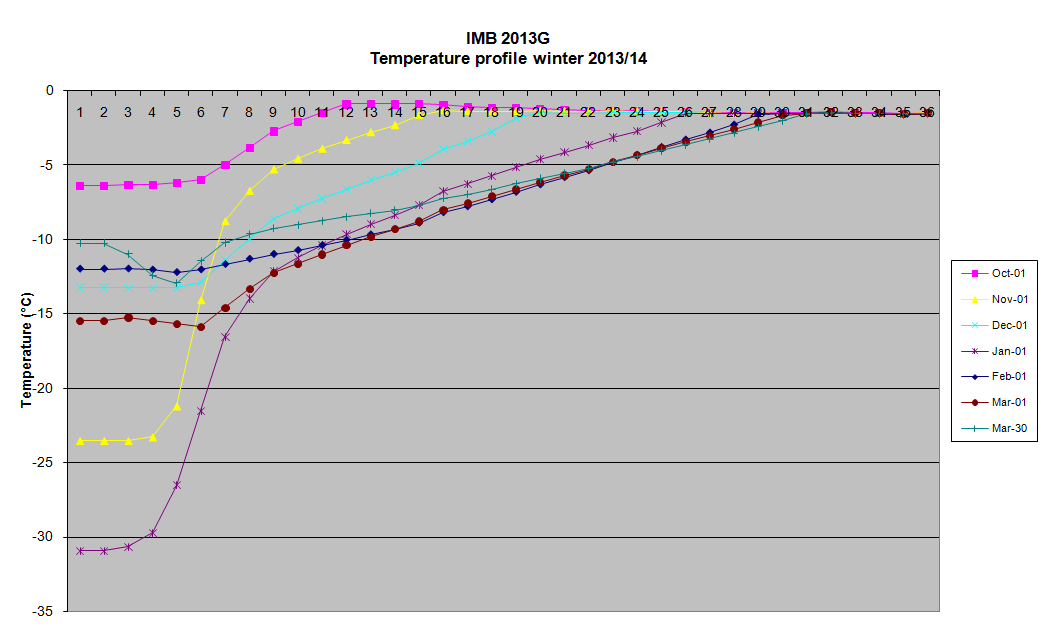
View IMB 2013G in a full screen map
View IMB 2013F in a full screen map

View IMB 2012G in a full screen map
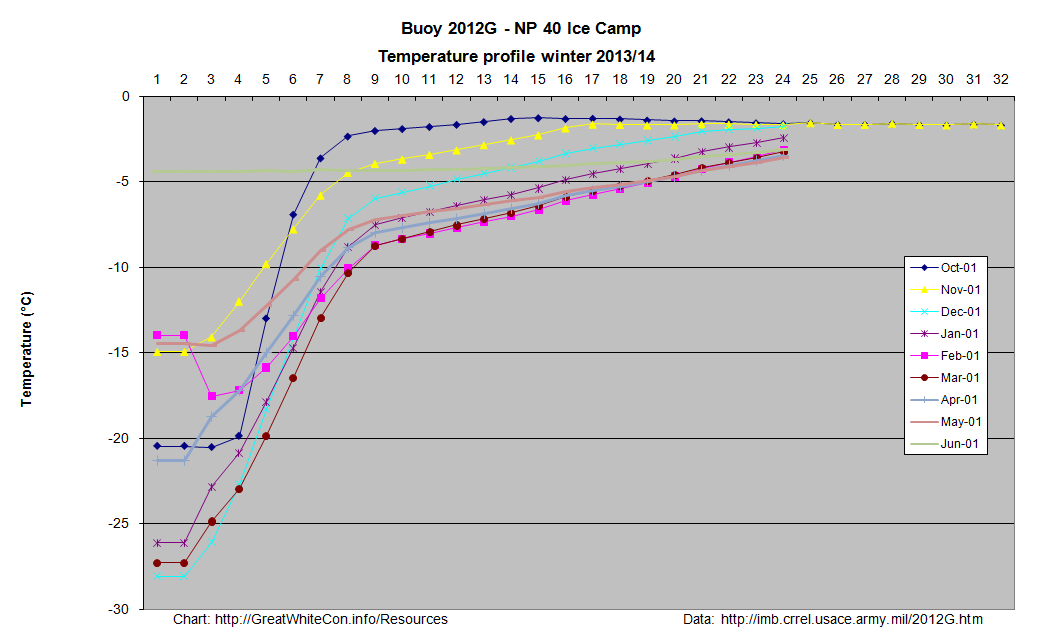 [Note that thermistors 25-45 failed on November 19th 2013]
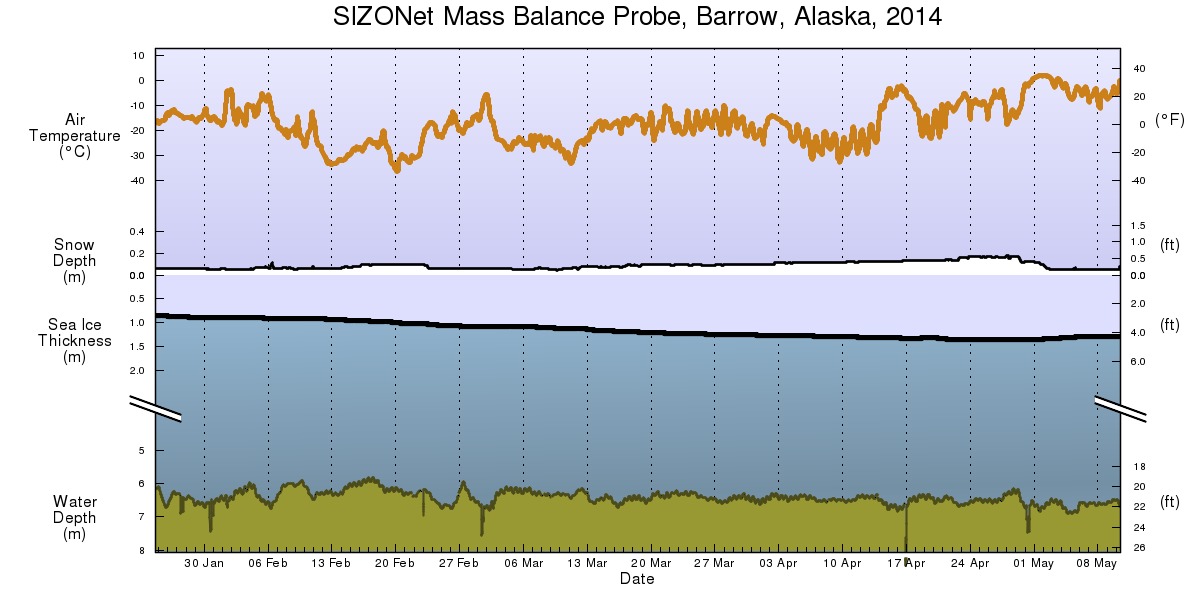
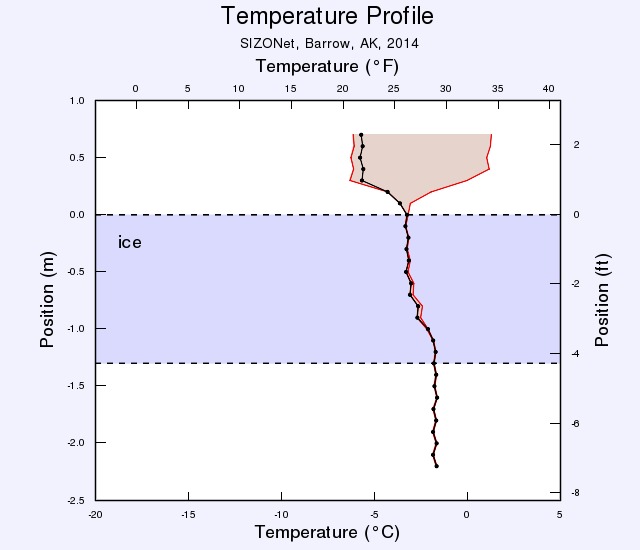
SIZONet mass balance buoy located on fast ice at Barrow, Alaska
See also our Arctic sea ice graphs overview page, our Arctic sea ice images page and our Arctic sea ice videos page.
Constructive technical criticism is welcome on the introductory blog post. For discussions about interpreting the information please comment on the “About Our Arctic Sea Ice Resources” page.