A selection of graphs, images and videos from the Beaufort Sea and Mackenzie River.
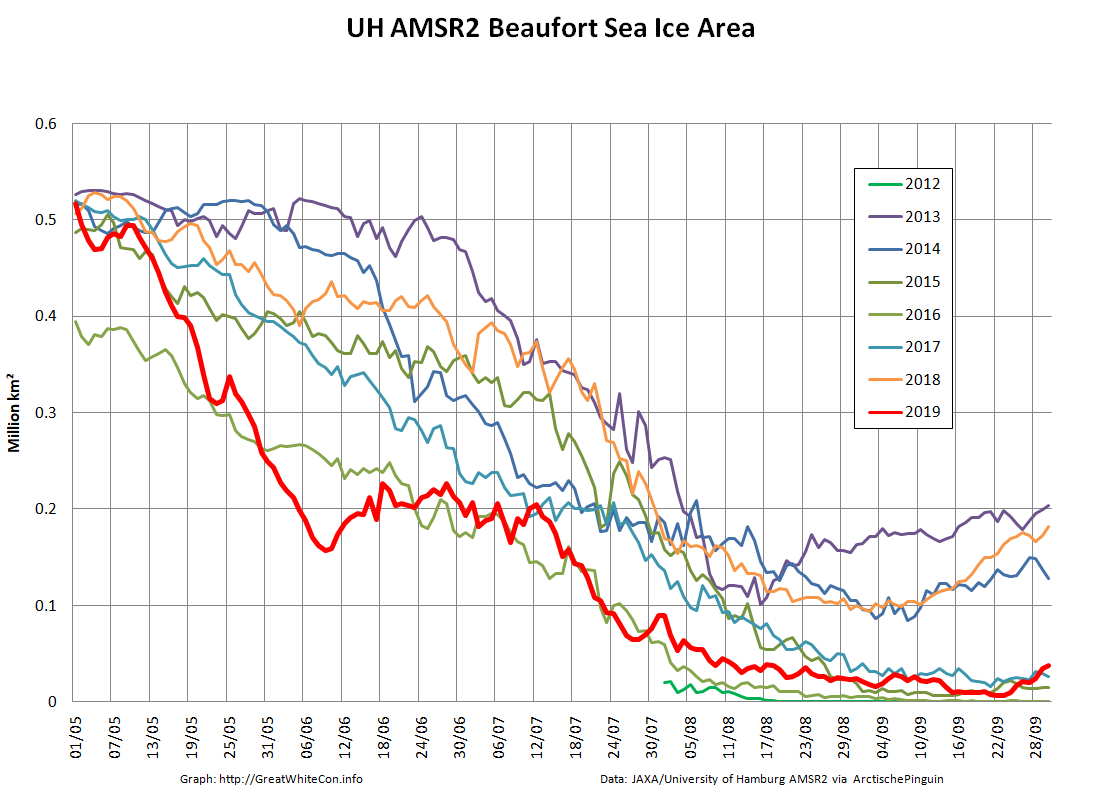
Beaufort Sea Ice Area
High Resolution Beaufort Sea Ice Area and Extent from Arctische Pinguin:
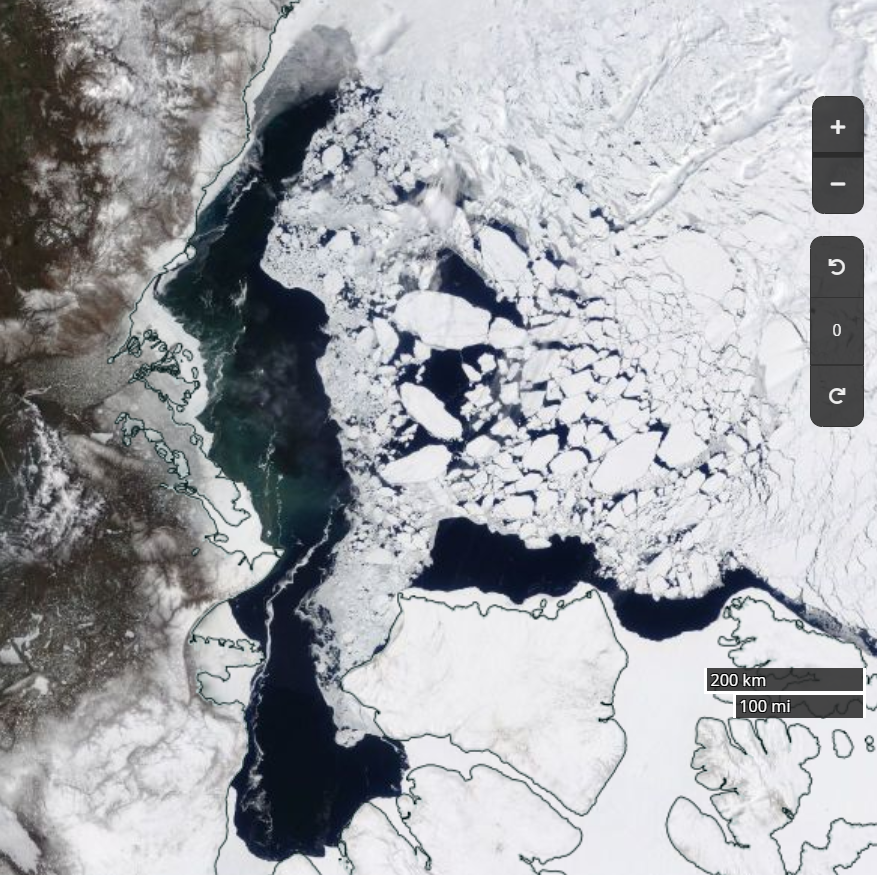
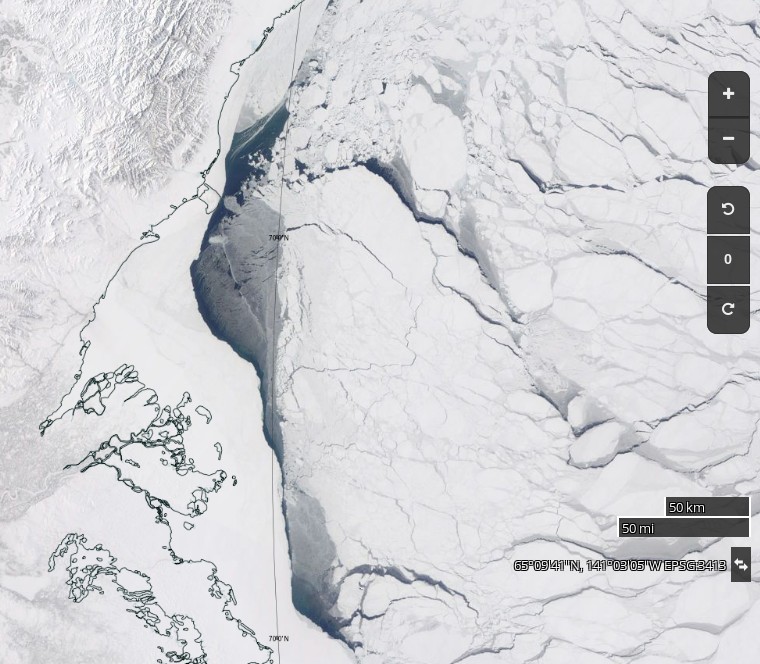
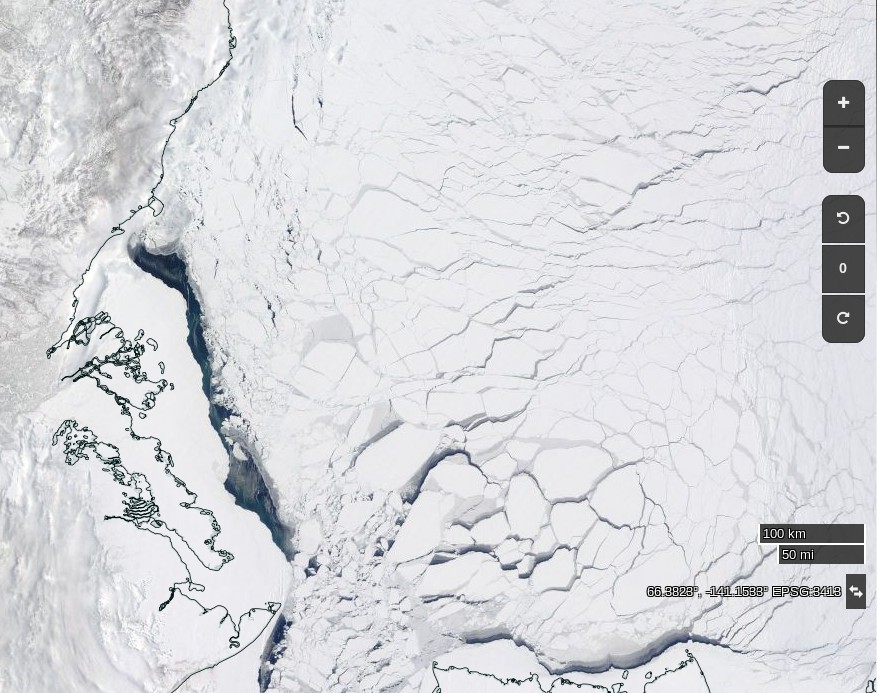
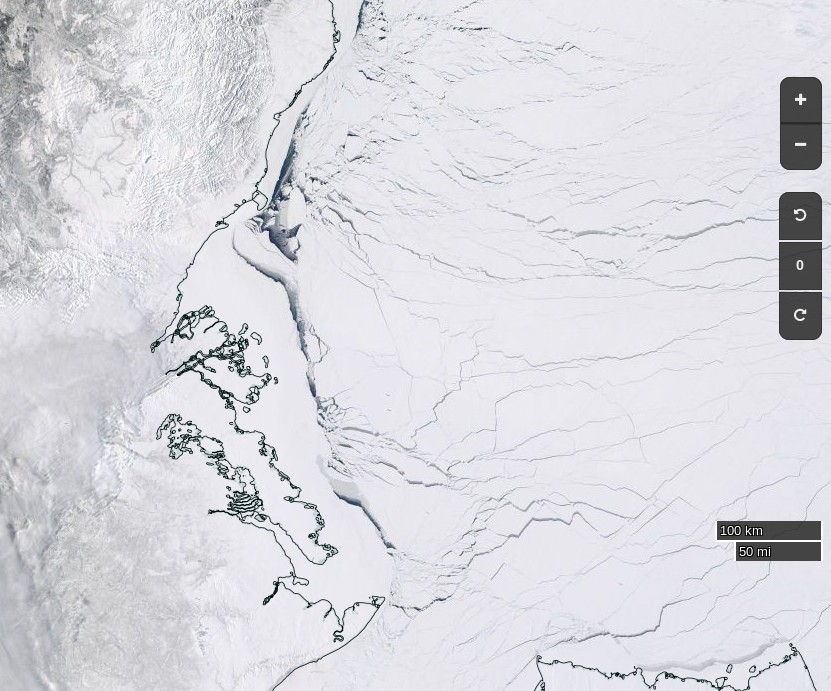
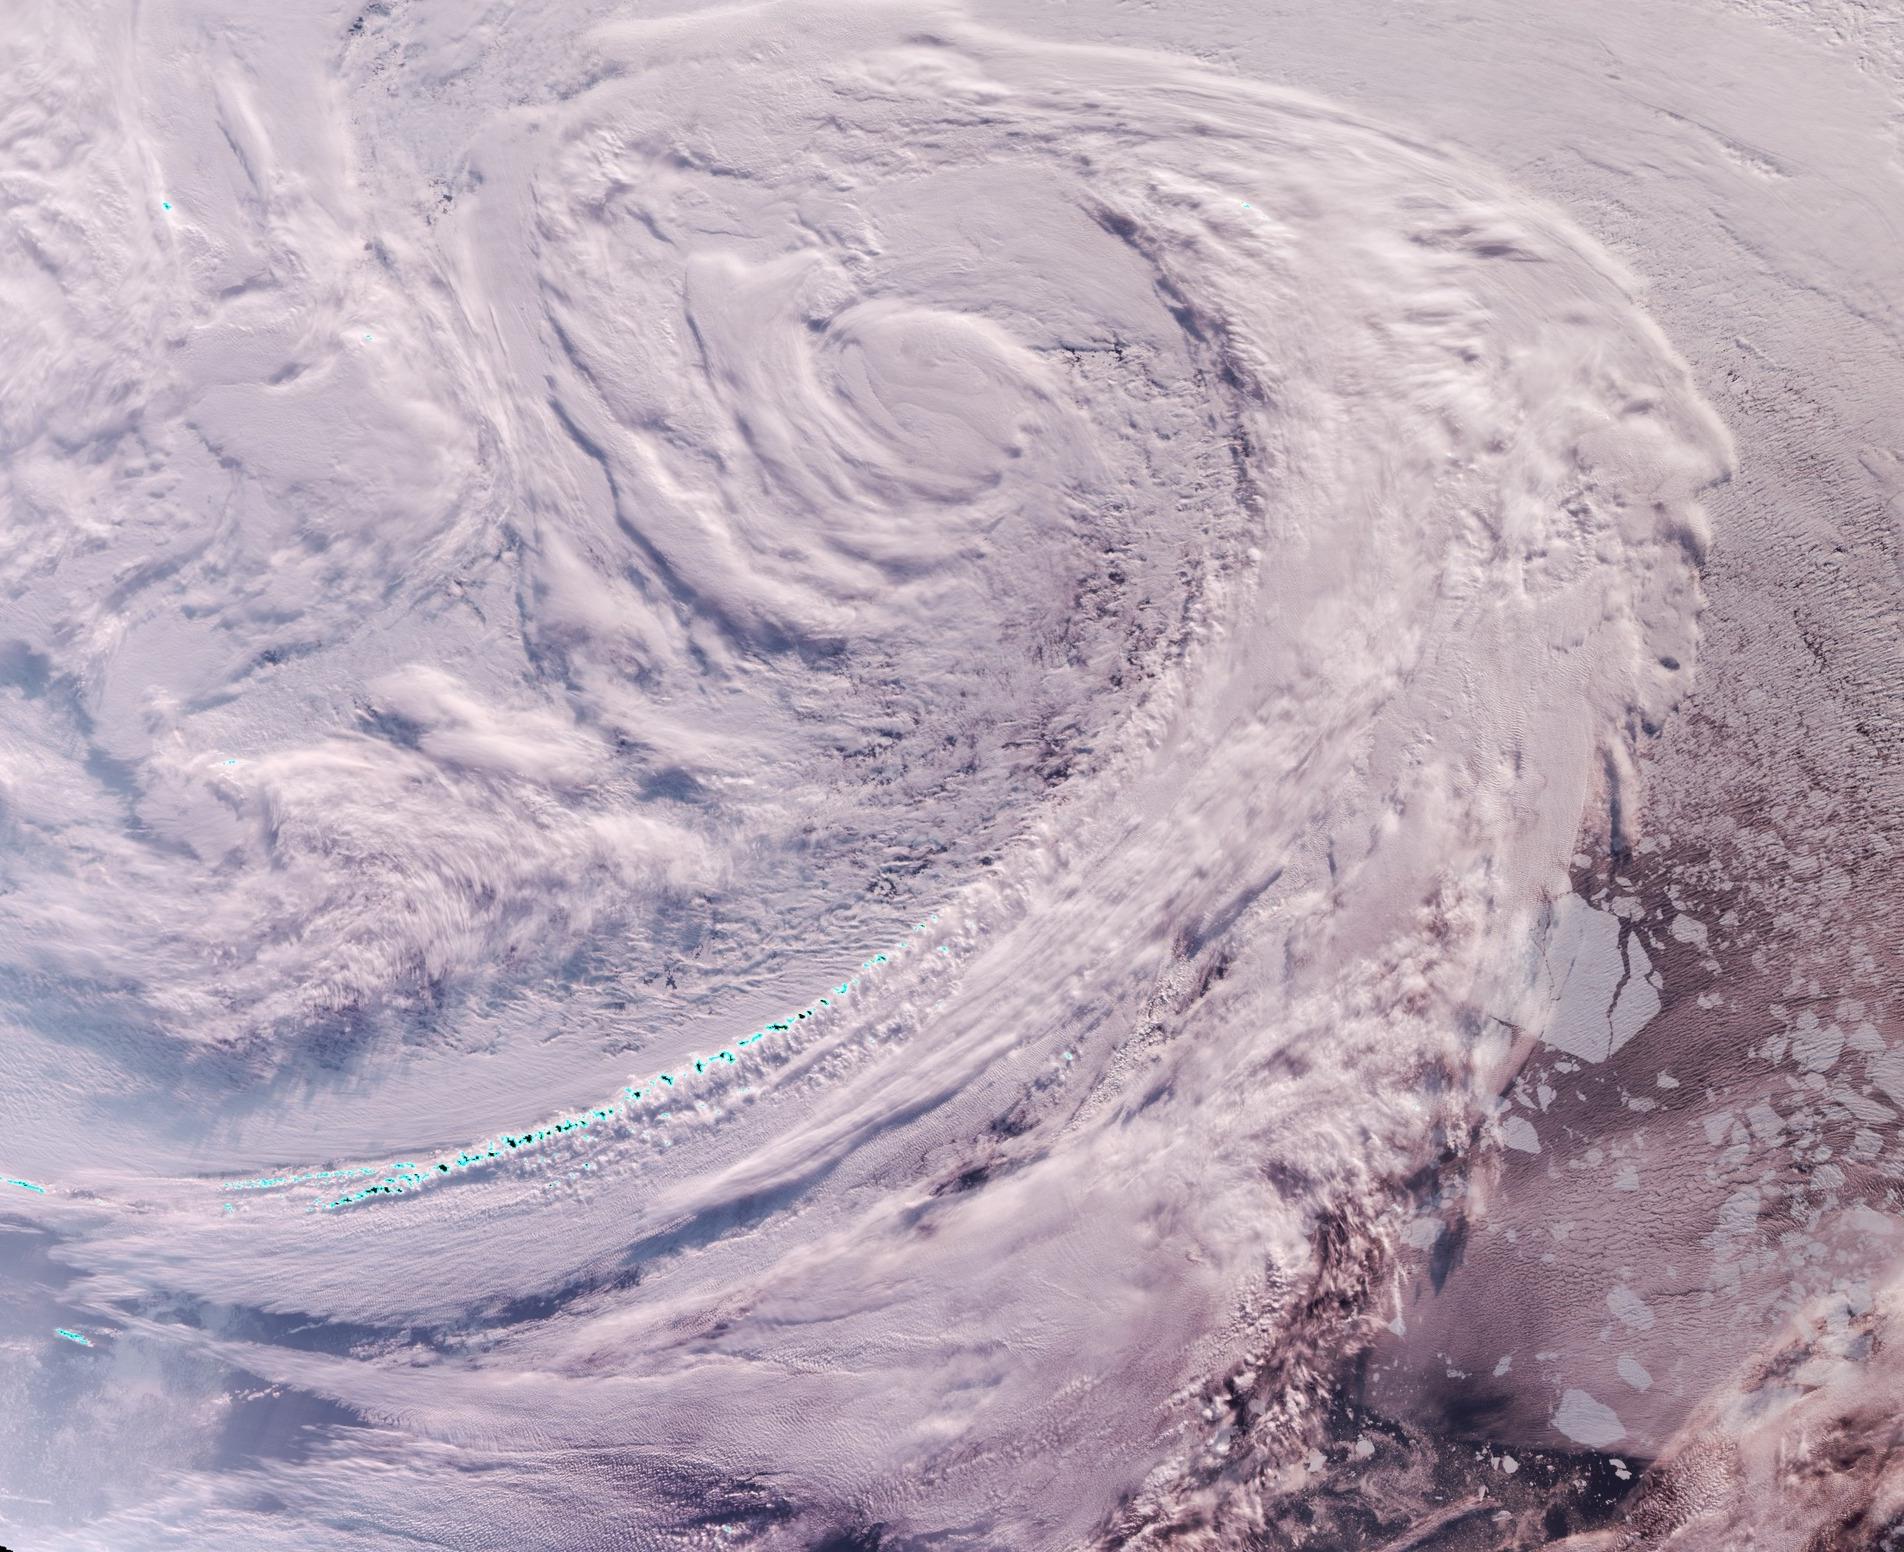
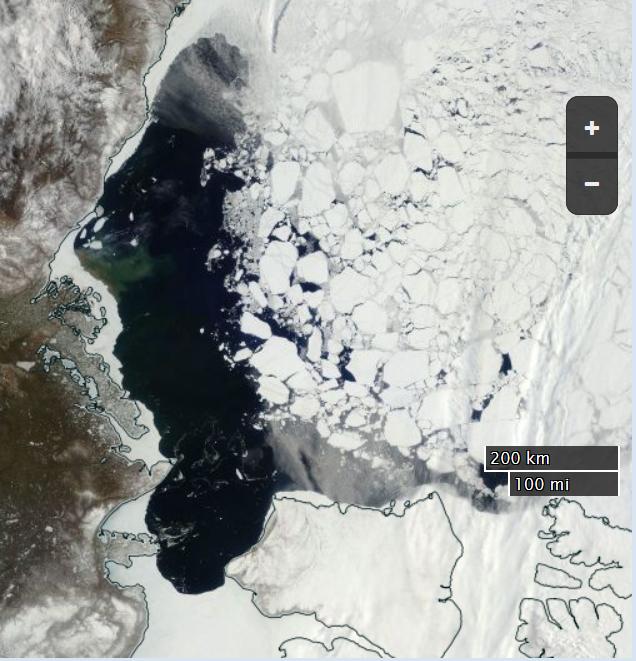
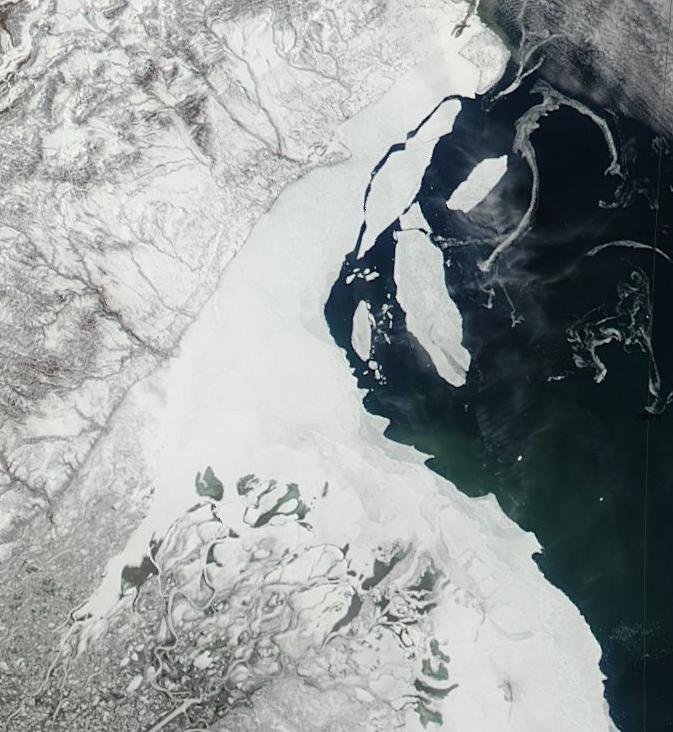
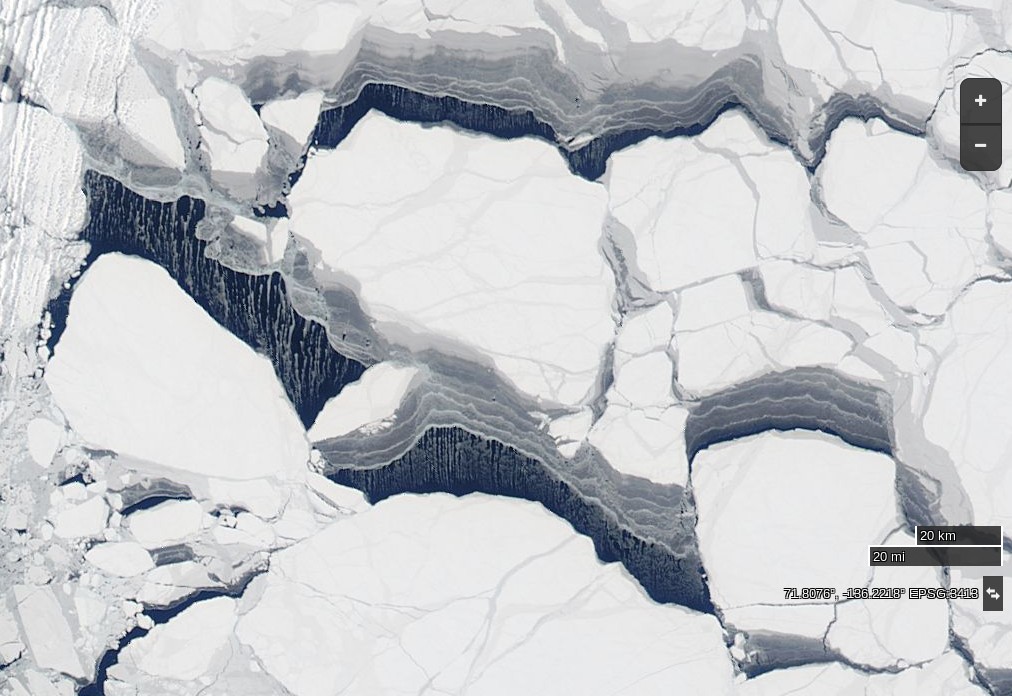
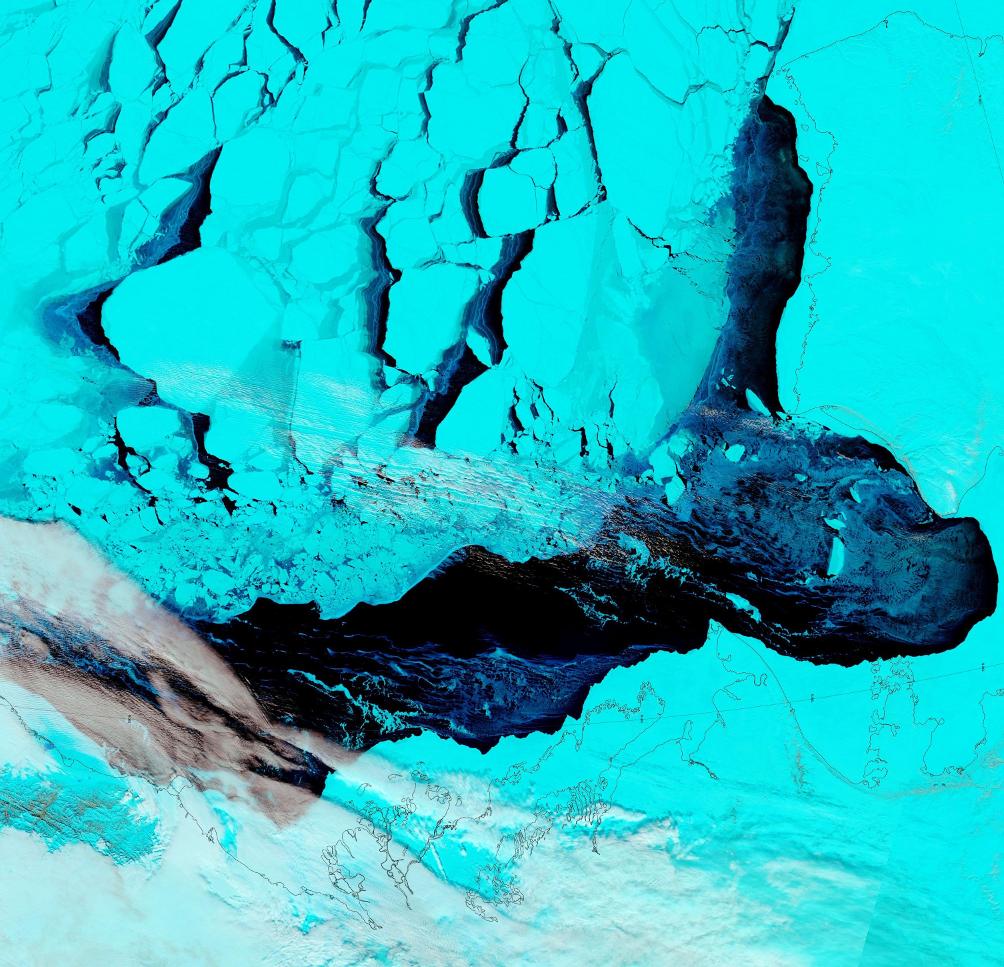
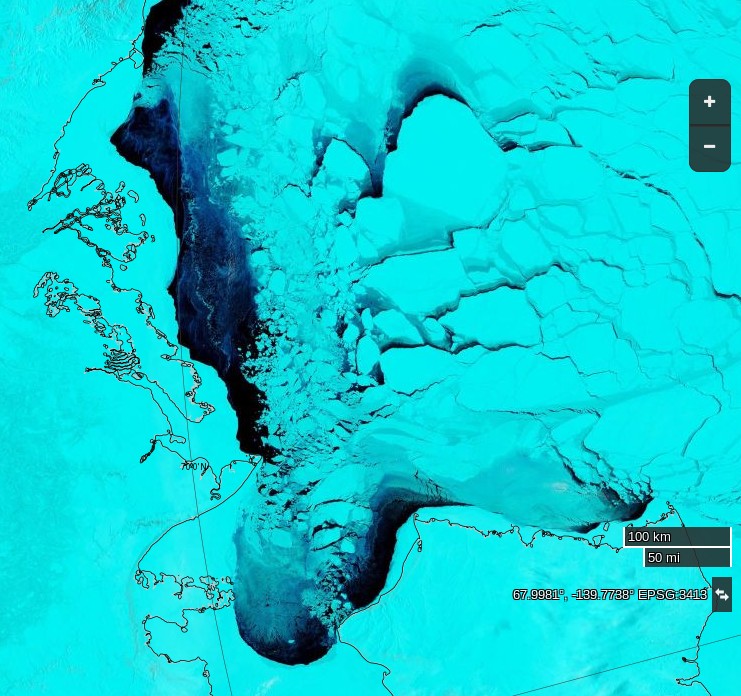
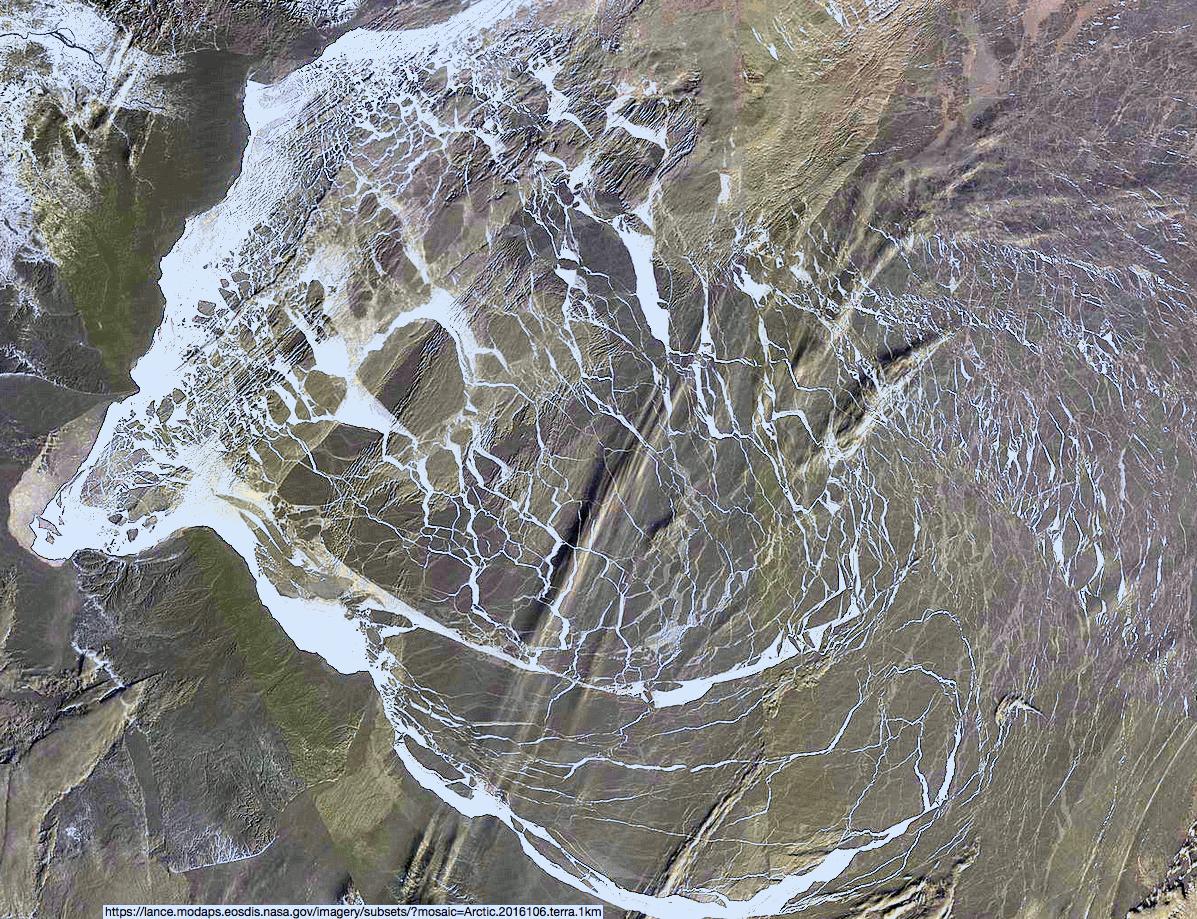
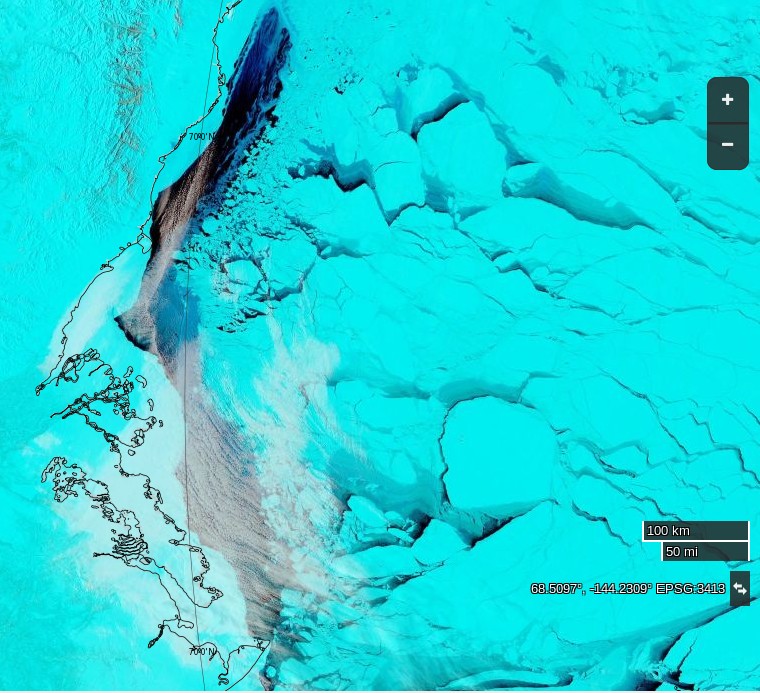
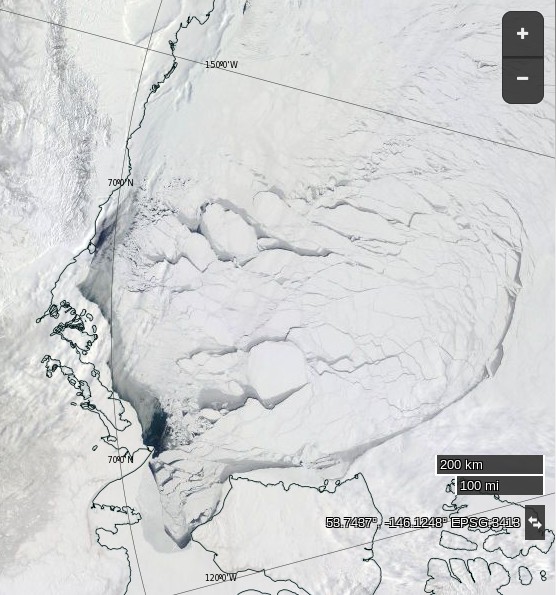
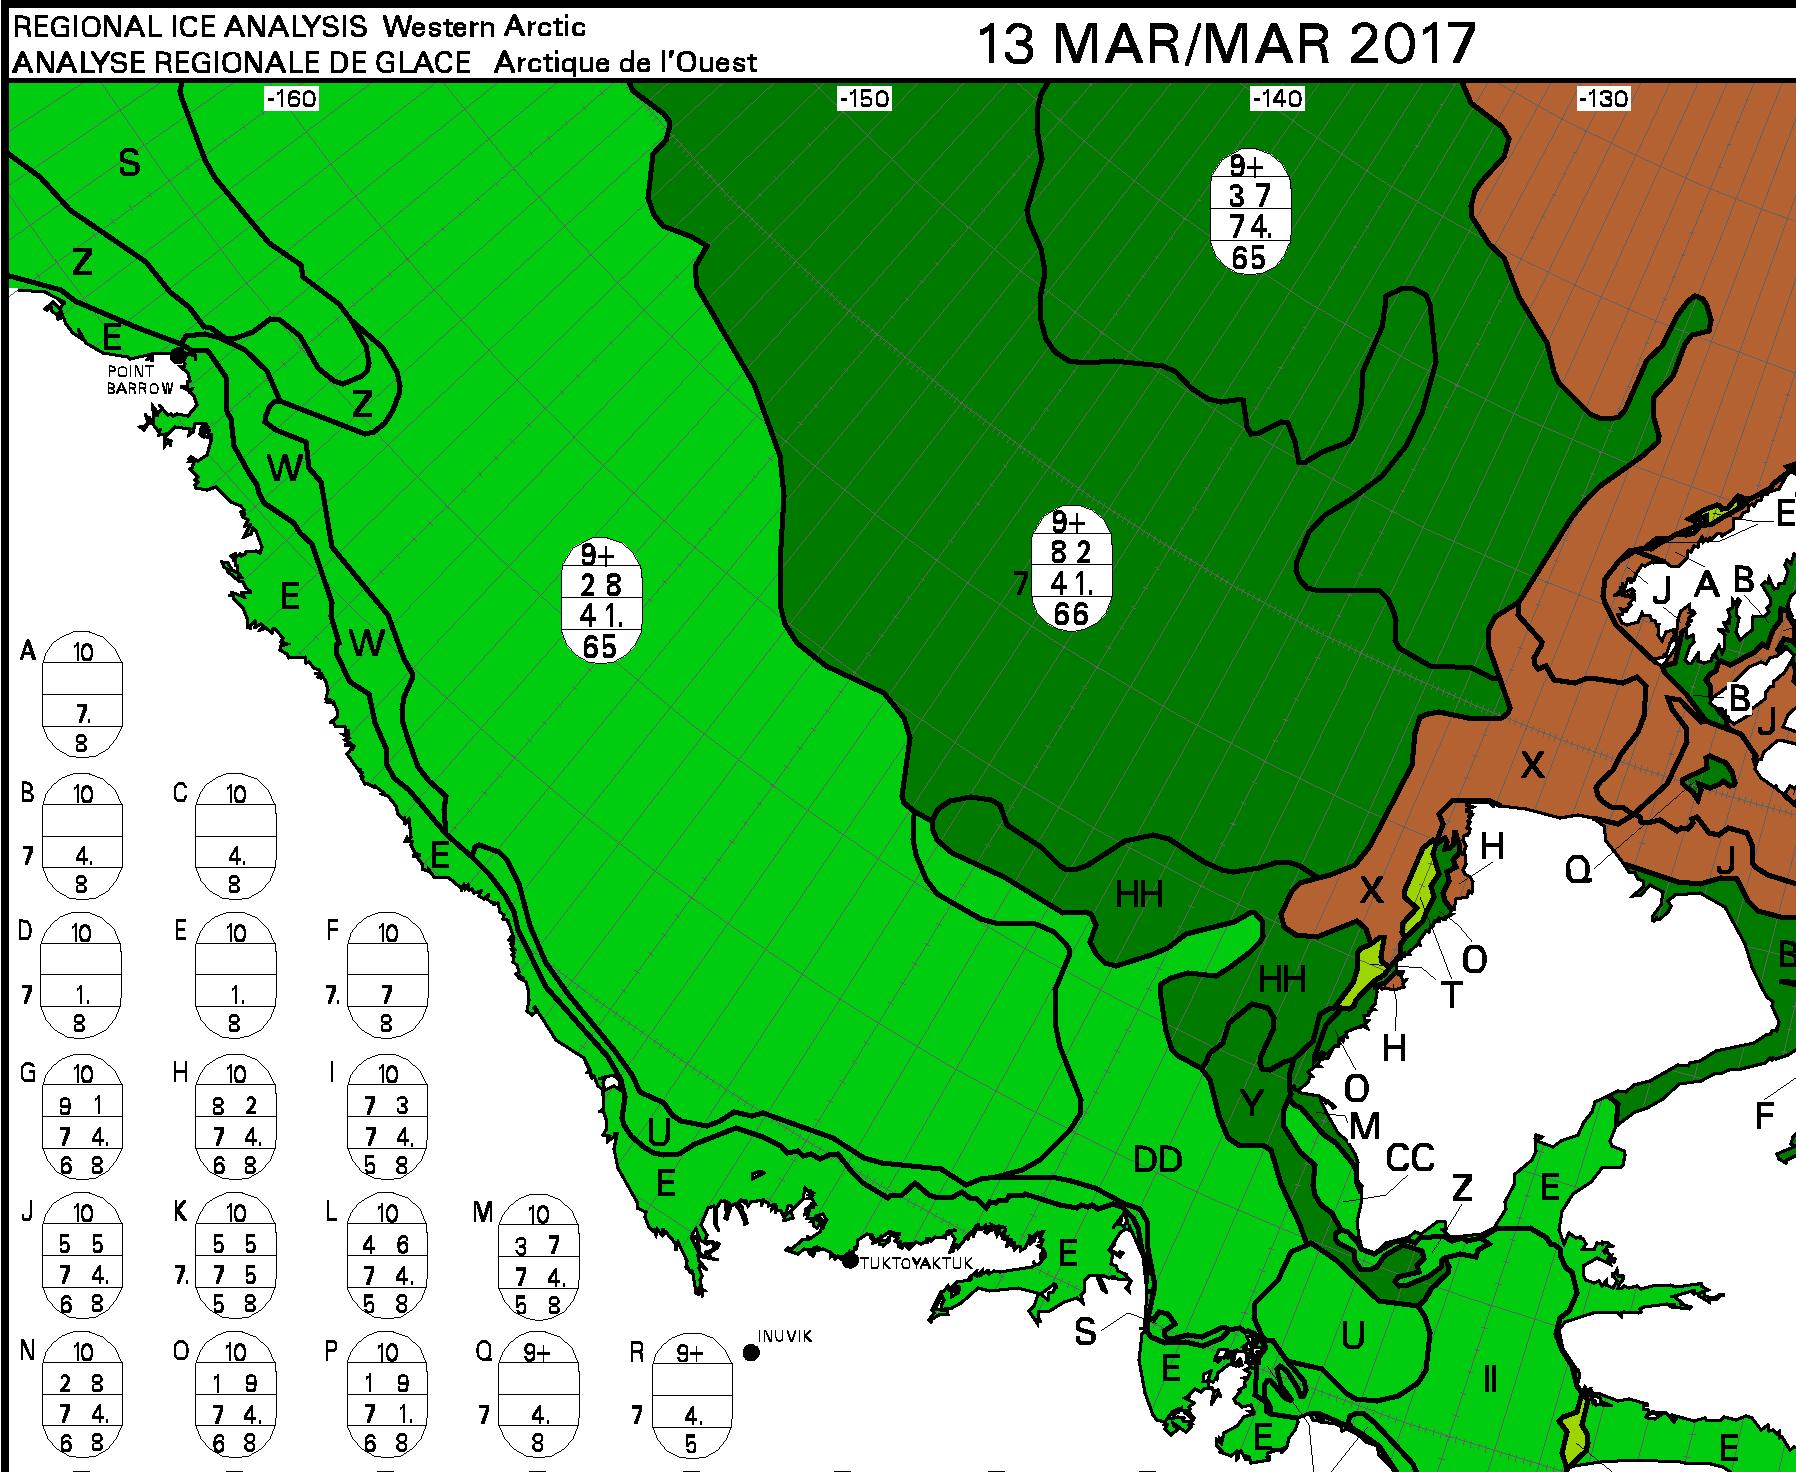
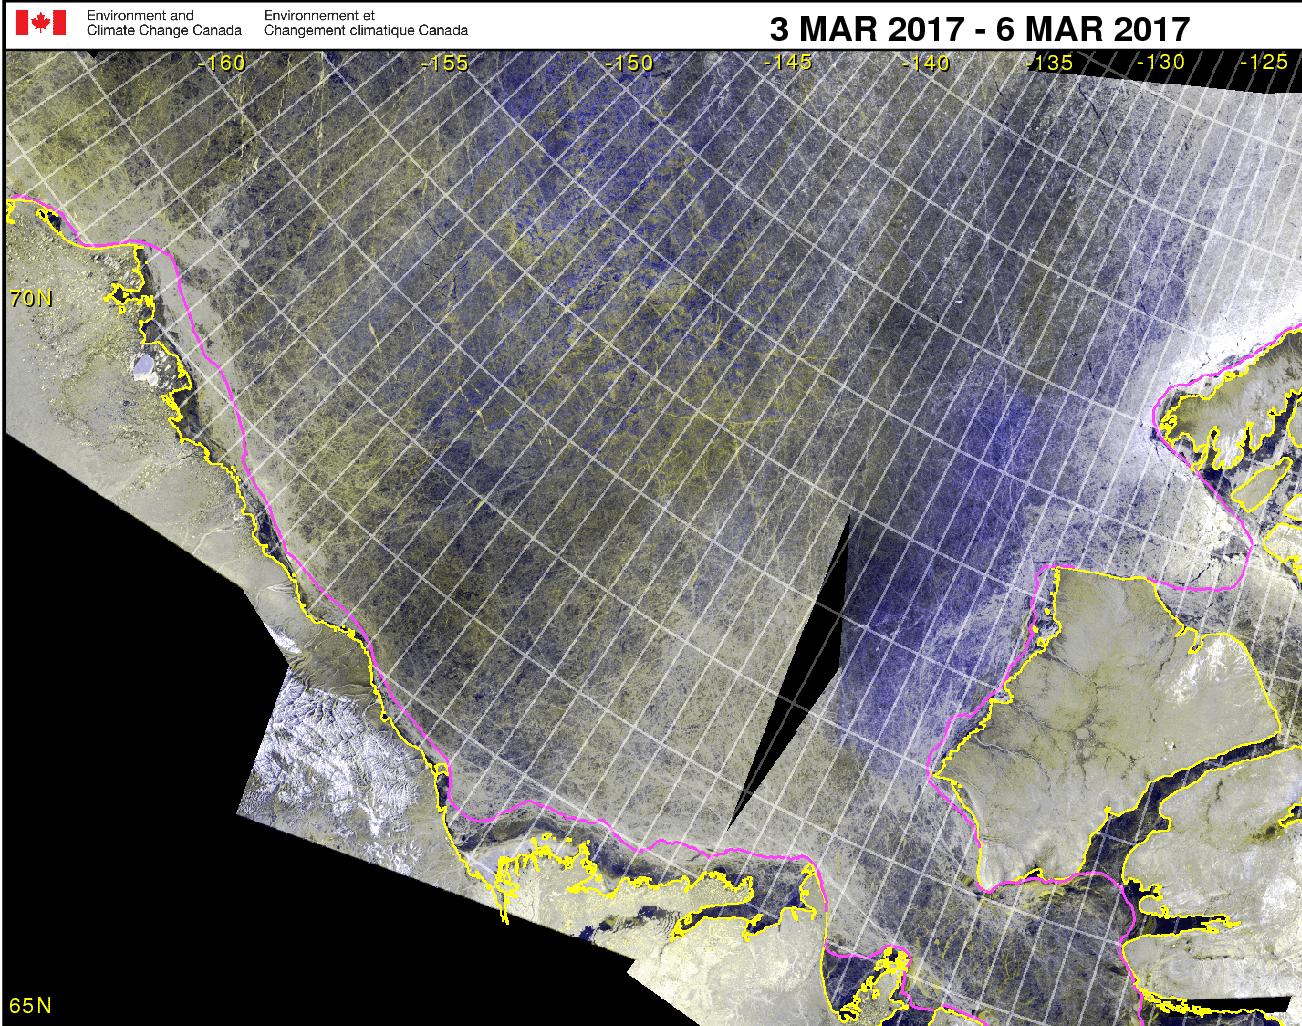
Recent satellite images from the Beaufort Sea
NASA Worldview “true-color” image of the Beaufort Sea on May 21st 2019, derived from the MODIS sensor on the Terra satelliteNASA Worldview “true-color” image of the Beaufort Sea on April 10th 2018, derived from the MODIS sensor on the Terra satelliteNASA Worldview “false-color” image of the Beaufort Sea on May 16th 2017, derived from the MODIS sensor on the Aqua satelliteNASA Worldview “true-color” image of the Beaufort Sea on May 2nd 2017, derived from the MODIS sensor on the Terra satelliteNASA Worldview “true-color” image of the Beaufort Sea on April 5th 2017, derived from the MODIS sensor on the Terra satelliteConfirmation from the Suomi satellite on July 16th 2016 that the “Big Block” multi-year ice floe north of Barrow has splitNASA Worldview “true-color” image of the Beaufort Sea on May 20th 2016, derived from the MODIS sensor on the Terra satelliteNASA Worldview “true-color” image of the Beaufort Sea off the Mackenzie Delta on May 12th 2016, derived from the MODIS sensor on the Aqua satelliteNASA Worldview “true-color” image of the Beaufort Sea on April 27th 2016, derived from the MODIS sensor on the Aqua satelliteNASA Worldview “false-color” image of the Beaufort Sea on April 26th 2016, derived from the MODIS sensor on the Terra satelliteNASA Worldview “false-color” image of the Beaufort Sea on April 21st 2016, derived from the MODIS sensor on the Terra satelliteAn image of the Beaufort Sea on April 16th 2016, derived from MODIS data by A-Team on the Arctic Sea Ice ForumNASA Worldview “false-color” image of the Beaufort Sea on April 12th 2016, derived from the MODIS sensor on the Terra satelliteNASA Worldview “true-color” image of the Beaufort Sea on April 9th 2016, derived from the MODIS sensor on the Terra satellite
This website uses cookies to improve your experience. We'll assume you're ok with this, but you can opt-out if you wish. Cookie settingsACCEPT
Privacy & Cookies Policy
Privacy Overview
This website uses cookies to improve your experience while you navigate through the website. Out of these, the cookies that are categorized as necessary are stored on your browser as they are essential for the working of basic functionalities of the website. We also use third-party cookies that help us analyze and understand how you use this website. These cookies will be stored in your browser only with your consent. You also have the option to opt-out of these cookies. But opting out of some of these cookies may affect your browsing experience.
Necessary cookies are absolutely essential for the website to function properly. This category only includes cookies that ensures basic functionalities and security features of the website. These cookies do not store any personal information.
Any cookies that may not be particularly necessary for the website to function and is used specifically to collect user personal data via analytics, ads, other embedded contents are termed as non-necessary cookies. It is mandatory to procure user consent prior to running these cookies on your website.