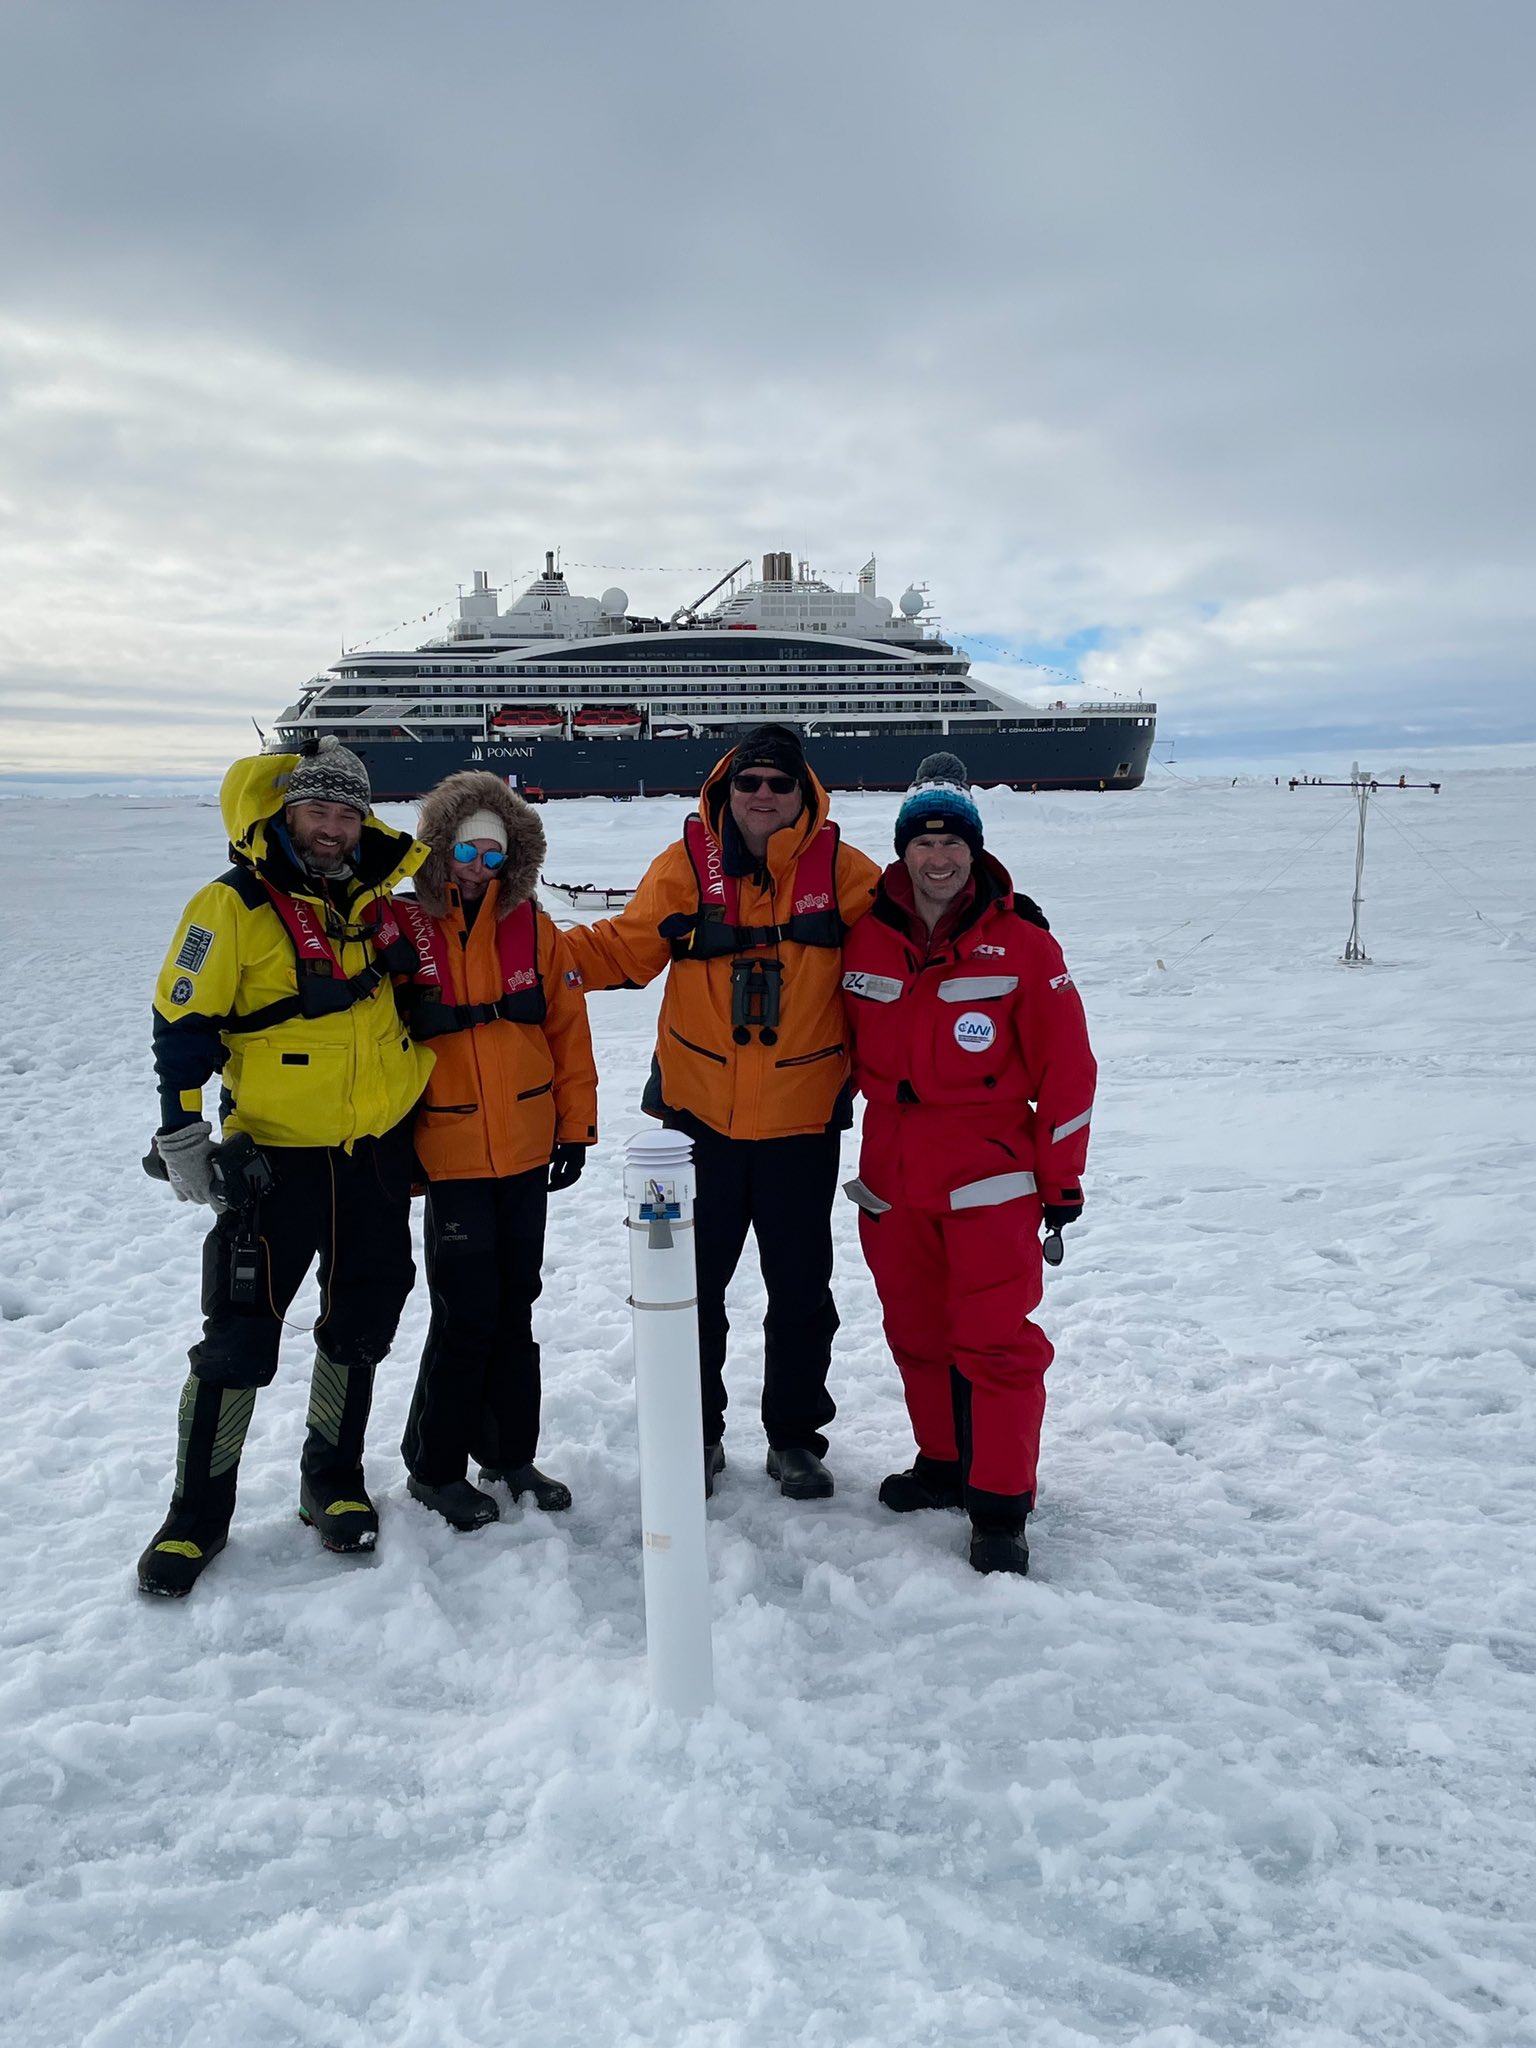
After a long hiatus courtesy of the demise of the annual Barneo ice camp and the Covid-19 pandemic we are pleased to be able to report that an ice mass balance buoy has once again been installed on a floe in the vicinity of the North Pole. Here’s the evidence:
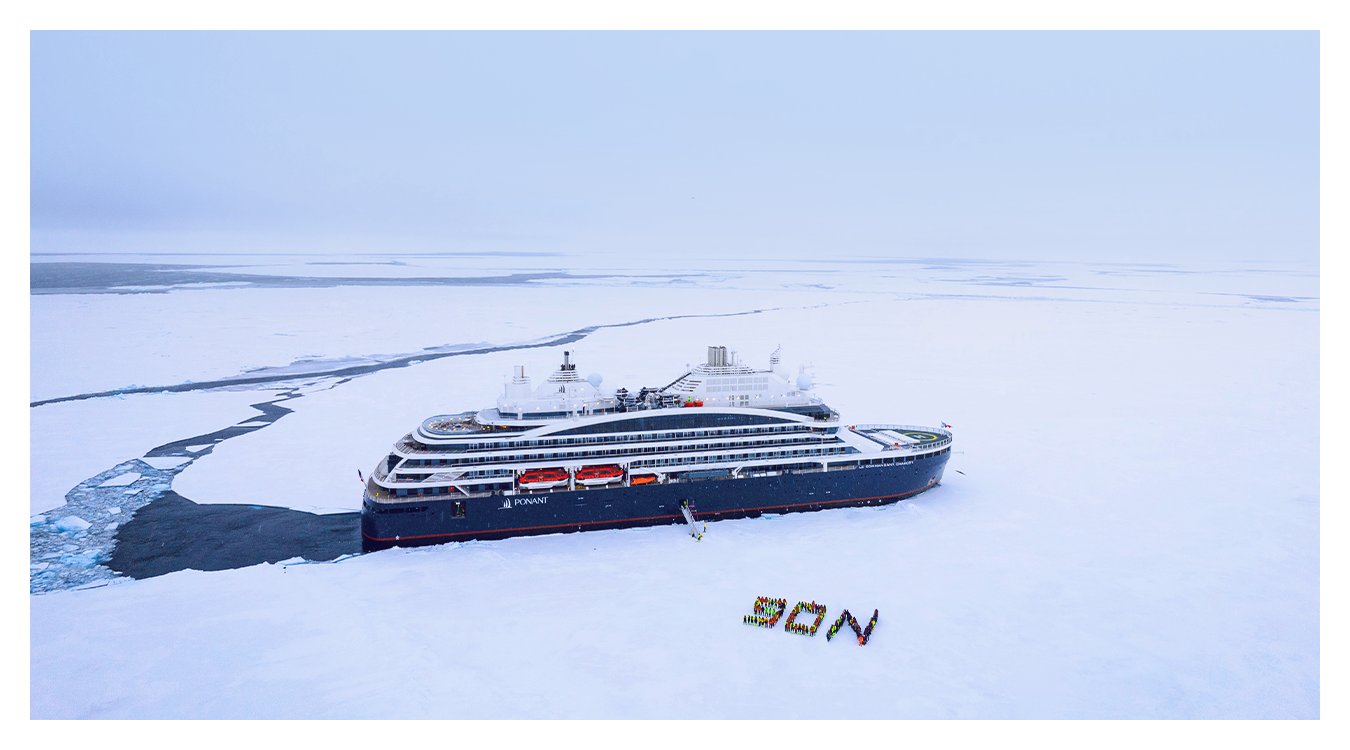
The ship in the background is not a traditional research icebreaker. It is Ponant Cruises’ Le Commandant Charcot, one of a number of new ice hardened cruise ships voyaging across the Arctic Ocean and adjacent seas. Le Commandant Charcot reached 90N on July 13th:
In a press release last week the Alfred Wegener Institute announced that:
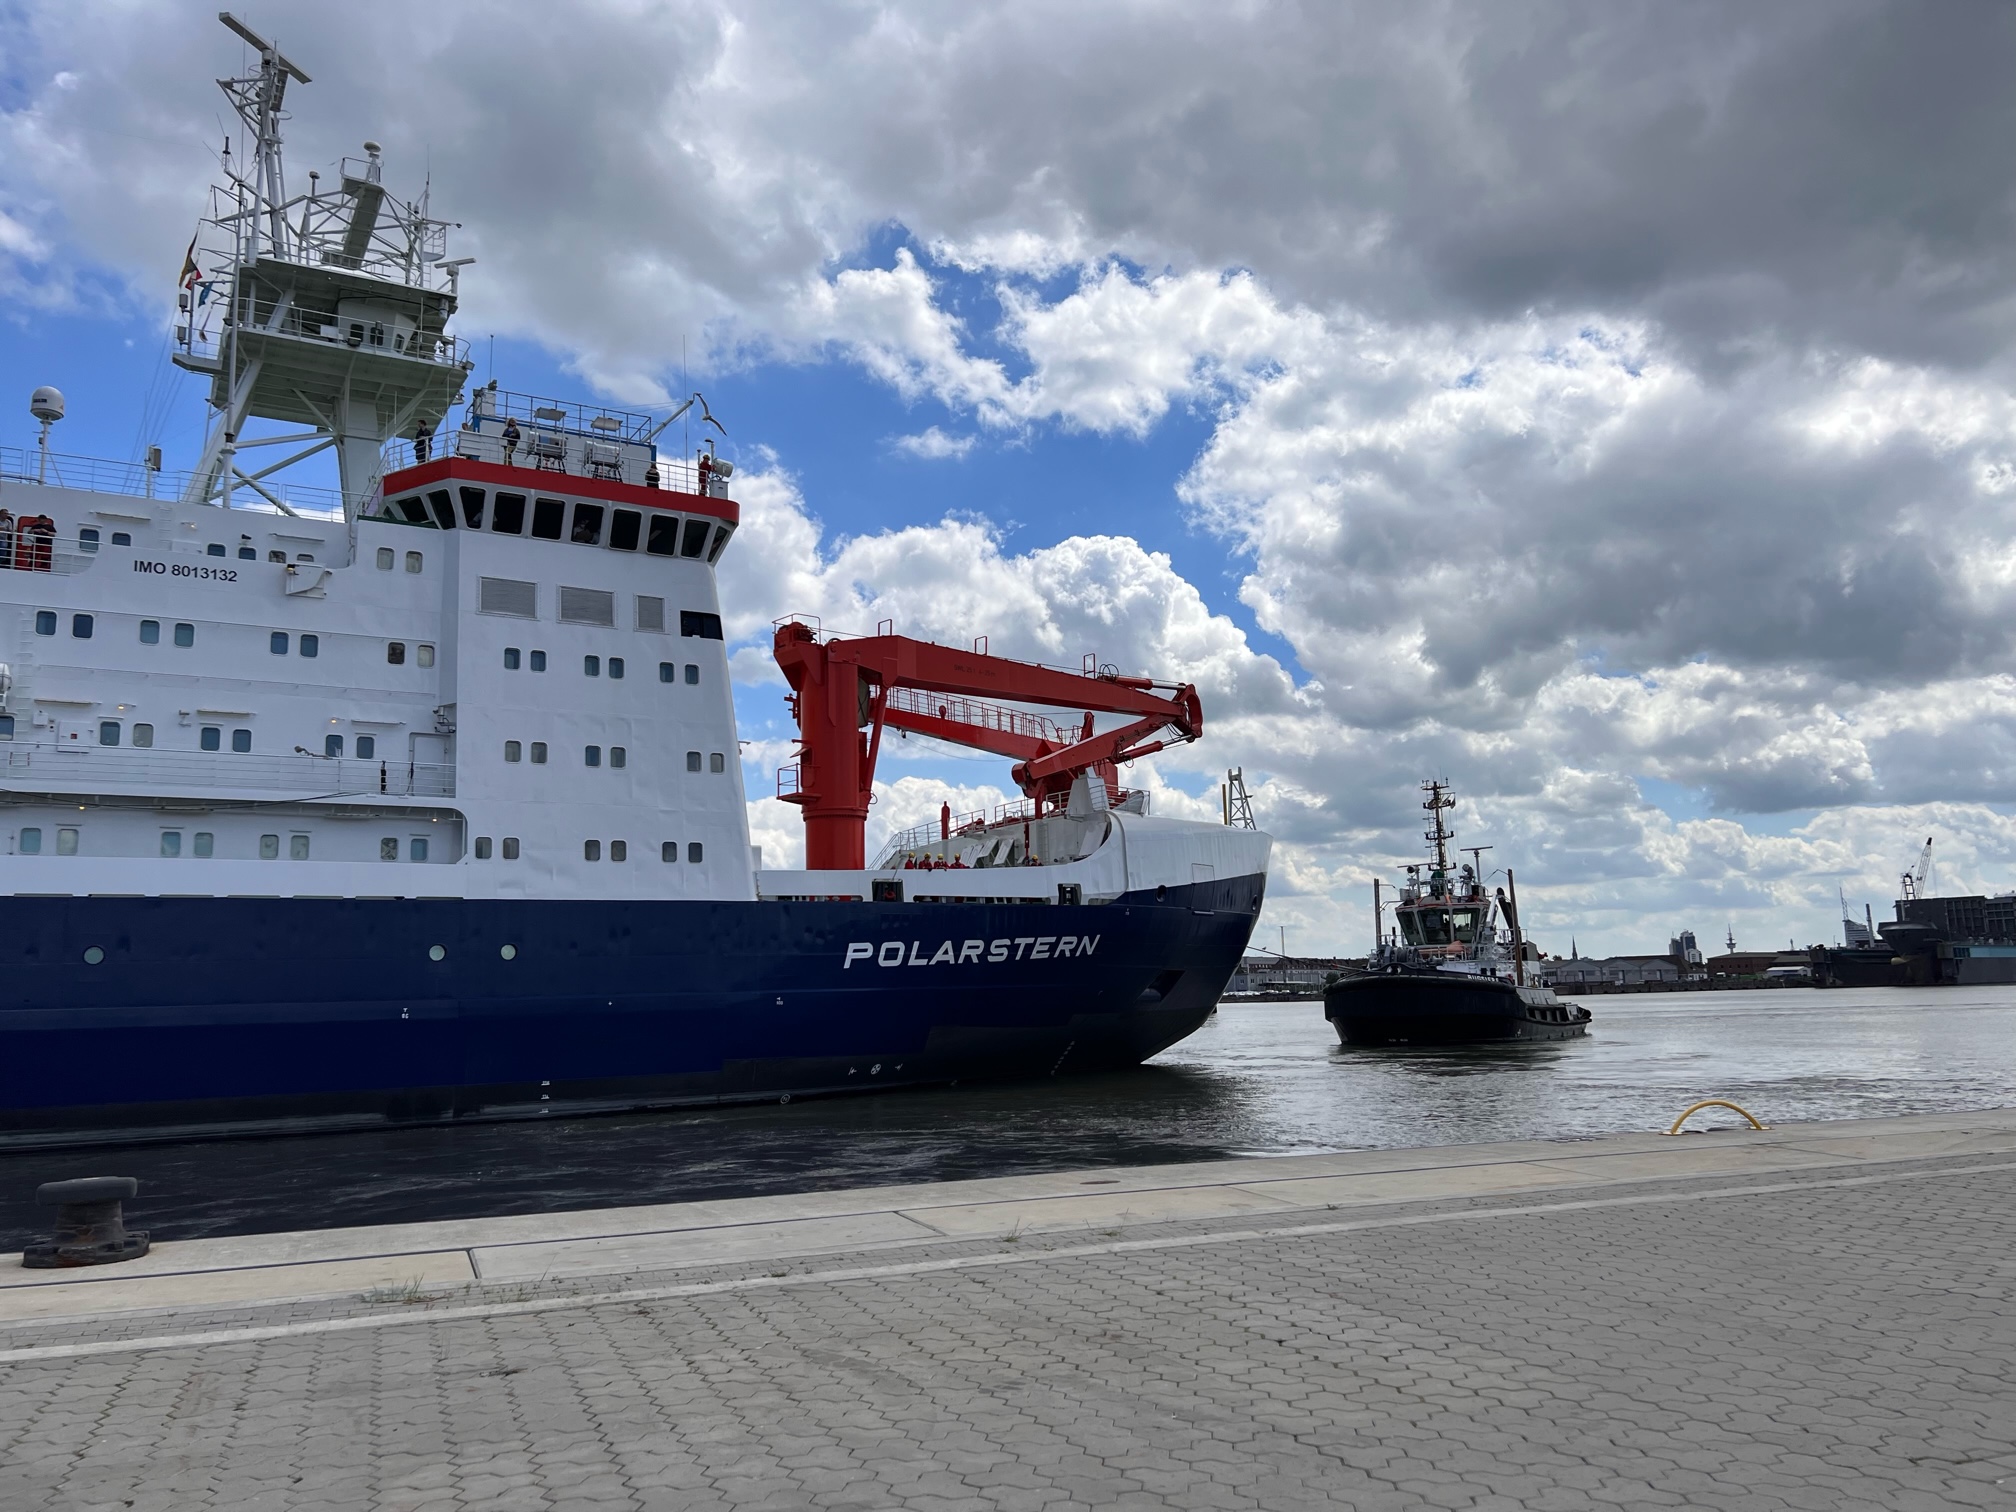
From her home port in Bremerhaven, the Polarstern will set course for Fram Strait and the marginal ice zone north of Svalbard, where warm, nutrient-rich Atlantic Water flows into the Arctic Ocean.
The Polarstern starts its voyage to the Arctic from its home port of Bremerhaven. Photo: Nina Machner
Closely monitoring energy and material flows in the marginal ice zone from the ship and from on ice floes is the goal of the team led by Prof Torsten Kanzow, expedition leader and a physical oceanographer at the Alfred Wegener Institute, Helmholtz Centre for Polar and Marine Research (AWI). “We will make transects from the open water into the dense sea ice and back. Along the way, we will gather a variety of physical, chemical and biological measurements in the marginal ice zone, which is especially productive and therefore especially interesting,” explains Kanzow.
“The team will also venture onto the ice to take a closer look at the thickness and characteristics of the sea ice and measure ocean currents and eddies away from the ship. We’ll also deploy so-called gliders in the ocean, buoys on the ice and moorings on the seafloor, all of which will record valuable data for the next several years. Lastly, we’ll extend our research radius with helicopter flights, during which we’ll observe, for instance, the melt ponds on the ice.”
Following the work in the MIZ north of Svalbard Polarstern will be heading for Northeast Greenland:
The two glaciers there (79 N Glacier and Zachariae Isstrom) are both characterised by ocean-driven ice loss and accelerated ice flows, making them contributors to sea-level rise. “We plan to install moorings in order to gauge the sensitivity of ocean-driven glacier melting to changing environmental conditions,” says Kanzow, who’s been pursuing research in the region since 2016. Accompanying geodetic-glaciological studies will be conducted on Greenland. On the one hand, they will assess how the solid ground is rising on extremely small scales, because it is still rebounding from the past weight of ice masses that melted after the last glacial maximum. On the other, they will explore temporal variations in supraglacial lakes; their drainage out to sea can have considerable effects on glacier flow speeds and glacier melting.
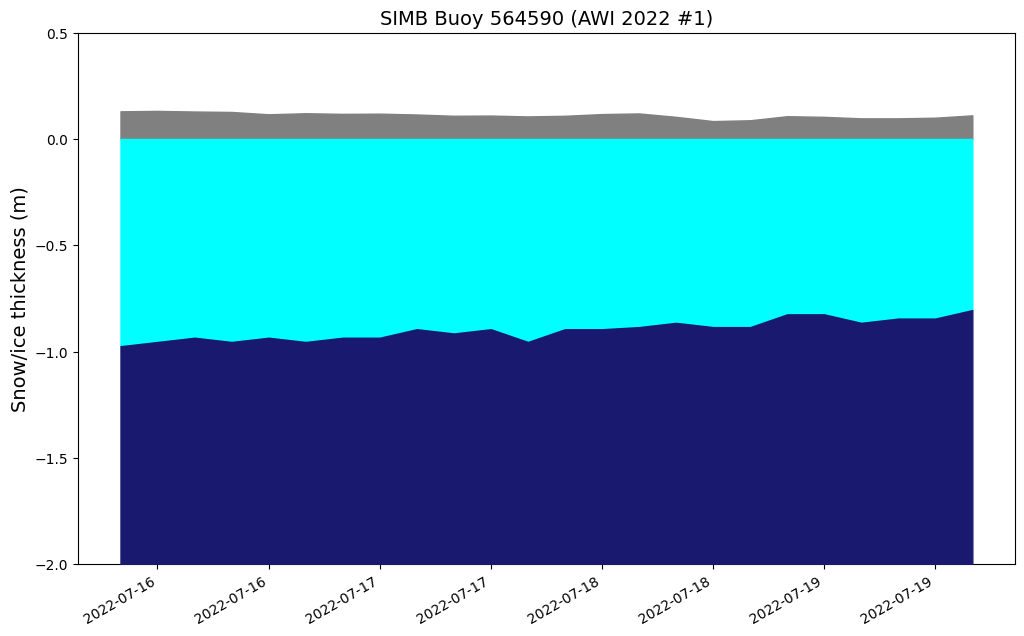
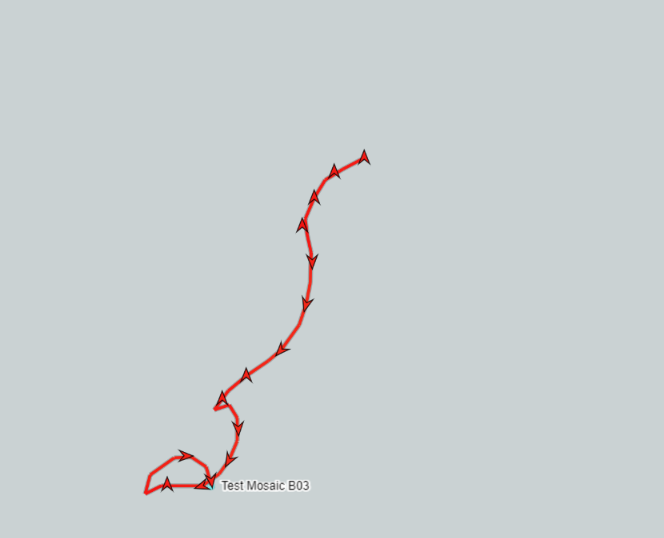
The AWI team have installed three seasonal ice mass balance buoys in the MIZ, without the usual thermistor string but with a new conductivity, temperature, depth (CTD) sensor fitted to measure salinity instead. Less colourful than usual sea ice thickness graphs can be viewed on the 2022 ice mass balance buoy page. Here’s one example:
[Edit – July 25th]
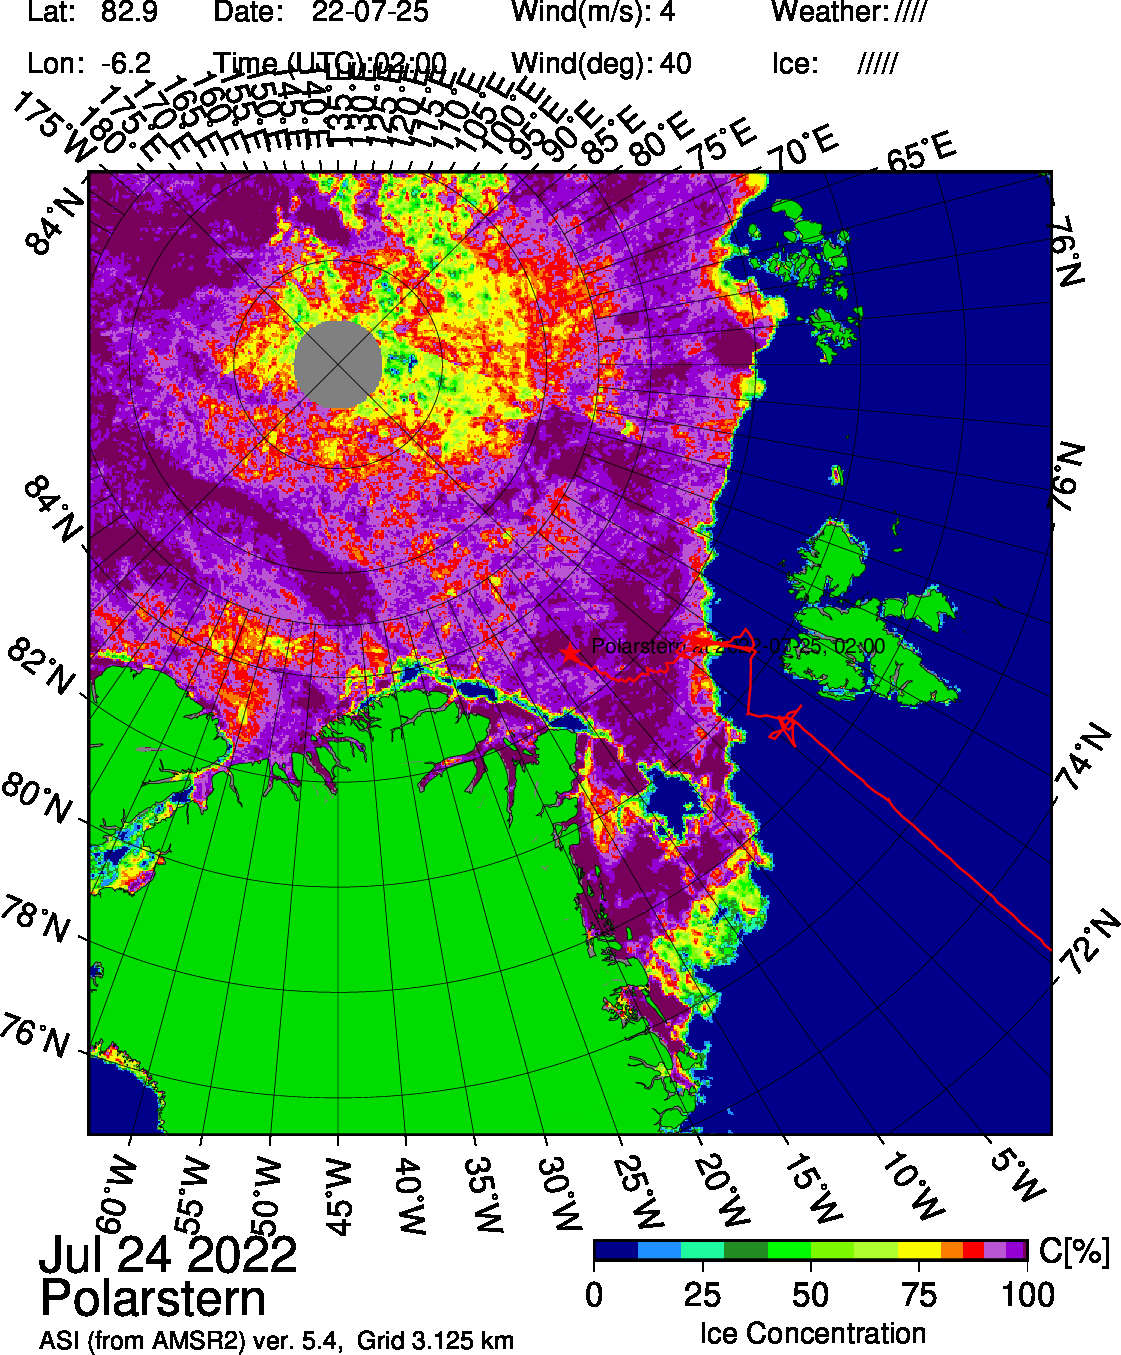
The image above updates on a daily basis, but today’s version is worth preserving for posterity:
There is currently a large area of low concentration sea ice around the North Pole, and Polarstern has left its station in the marginal ice zone and is currently heading north of Greenland rather than in the direction of the 79N/ZI glaciers.
Polarstern has been heading even further north to the Aurora Vent field (about 130 nautical miles northwest). As part of an extensive lithospheric study, ocean bottom seismometers will be deployed at depths of more than 4000 meters to record seismological activity as well as the physical properties of the hydrothermal plume.
Polarstern north east of Greenland – Photo: Christian R. Rohleder
Polarstern is now heading south again, where a team from the Technical University of Dresden will be deploying a modified surfboard on supra-glacial lakes! Here’s a test run in a melt pond:
Photo: Erik Loebel[Edit – July 29th]
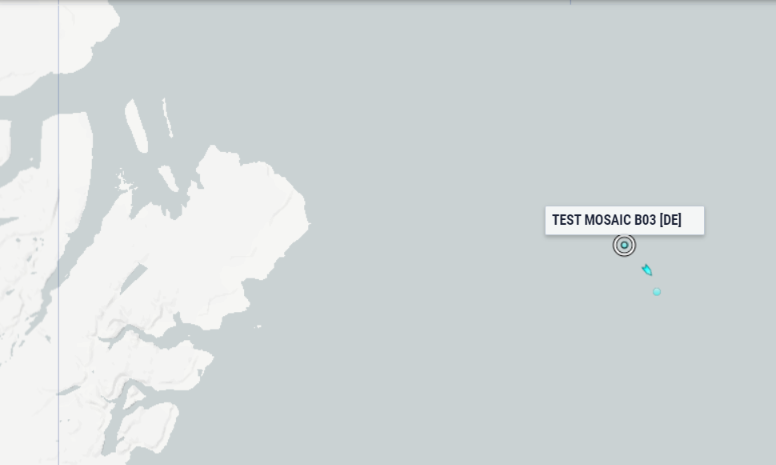
I discovered something rather interesting whilst browsing the Marine Traffic ship tracking web site this morning:
It appears as if the AWI have recently installed two buoys that support AIS position reporting, as indeed does Polarstern itself:
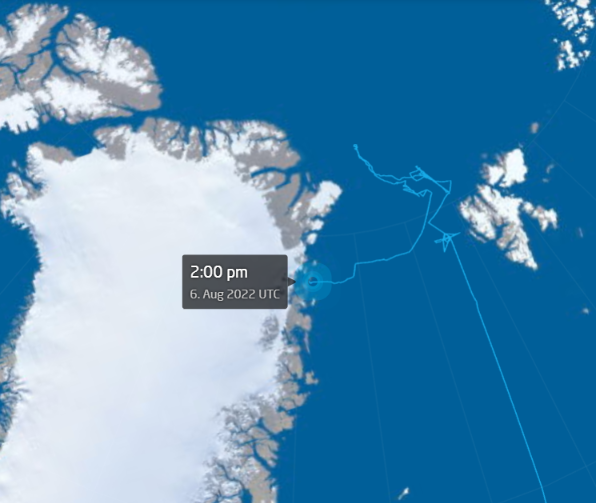
[Edit – August 6th]
Polarstern is now approaching the 79 N and Zachariae Isstrom glaciers:
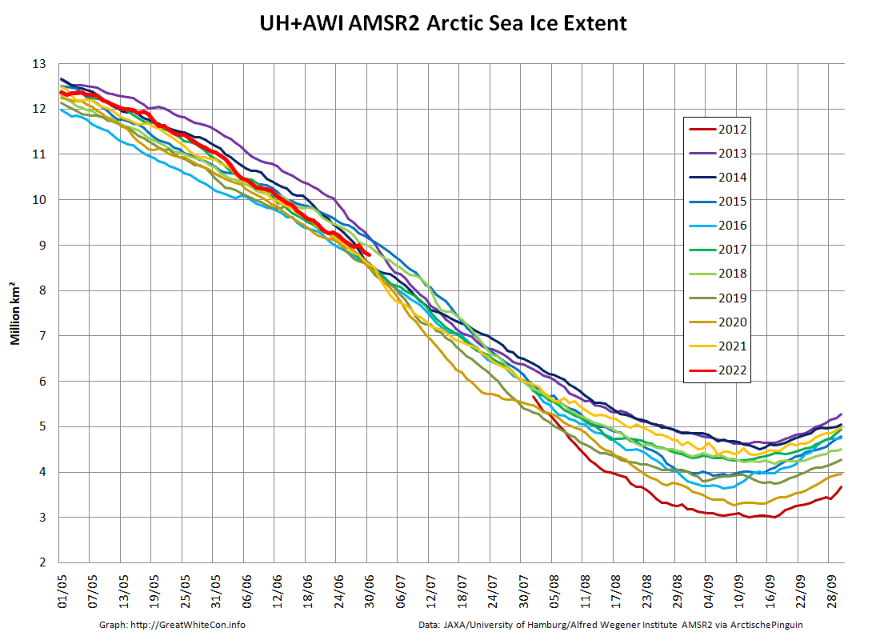
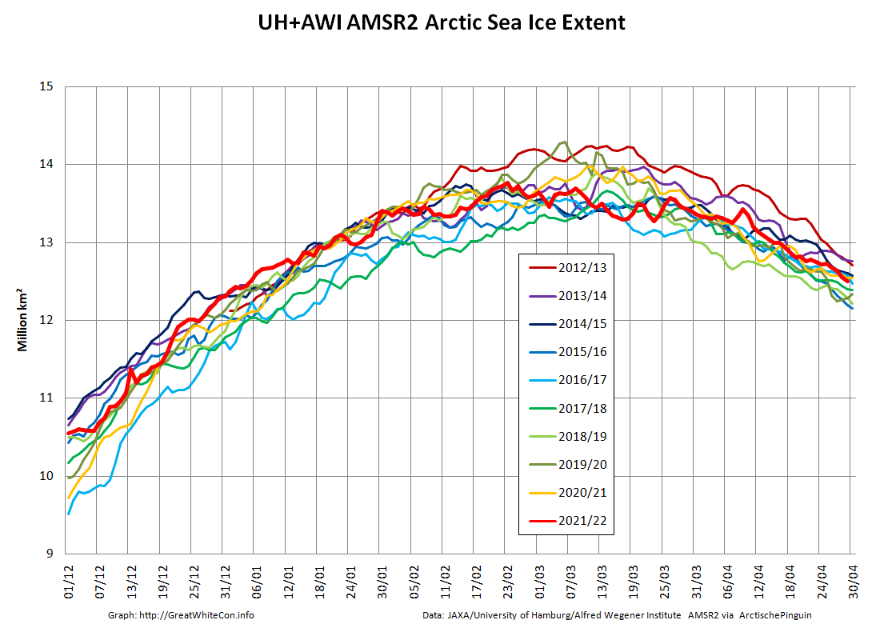
After a relatively rapid decline at the beginning of June Arctic sea extent is now very close to the 2010s average:
Both 2020 and 2021 began relatively rapid declines of their own at the beginning of July, so it will be interesting to see if 2022 follows suit.
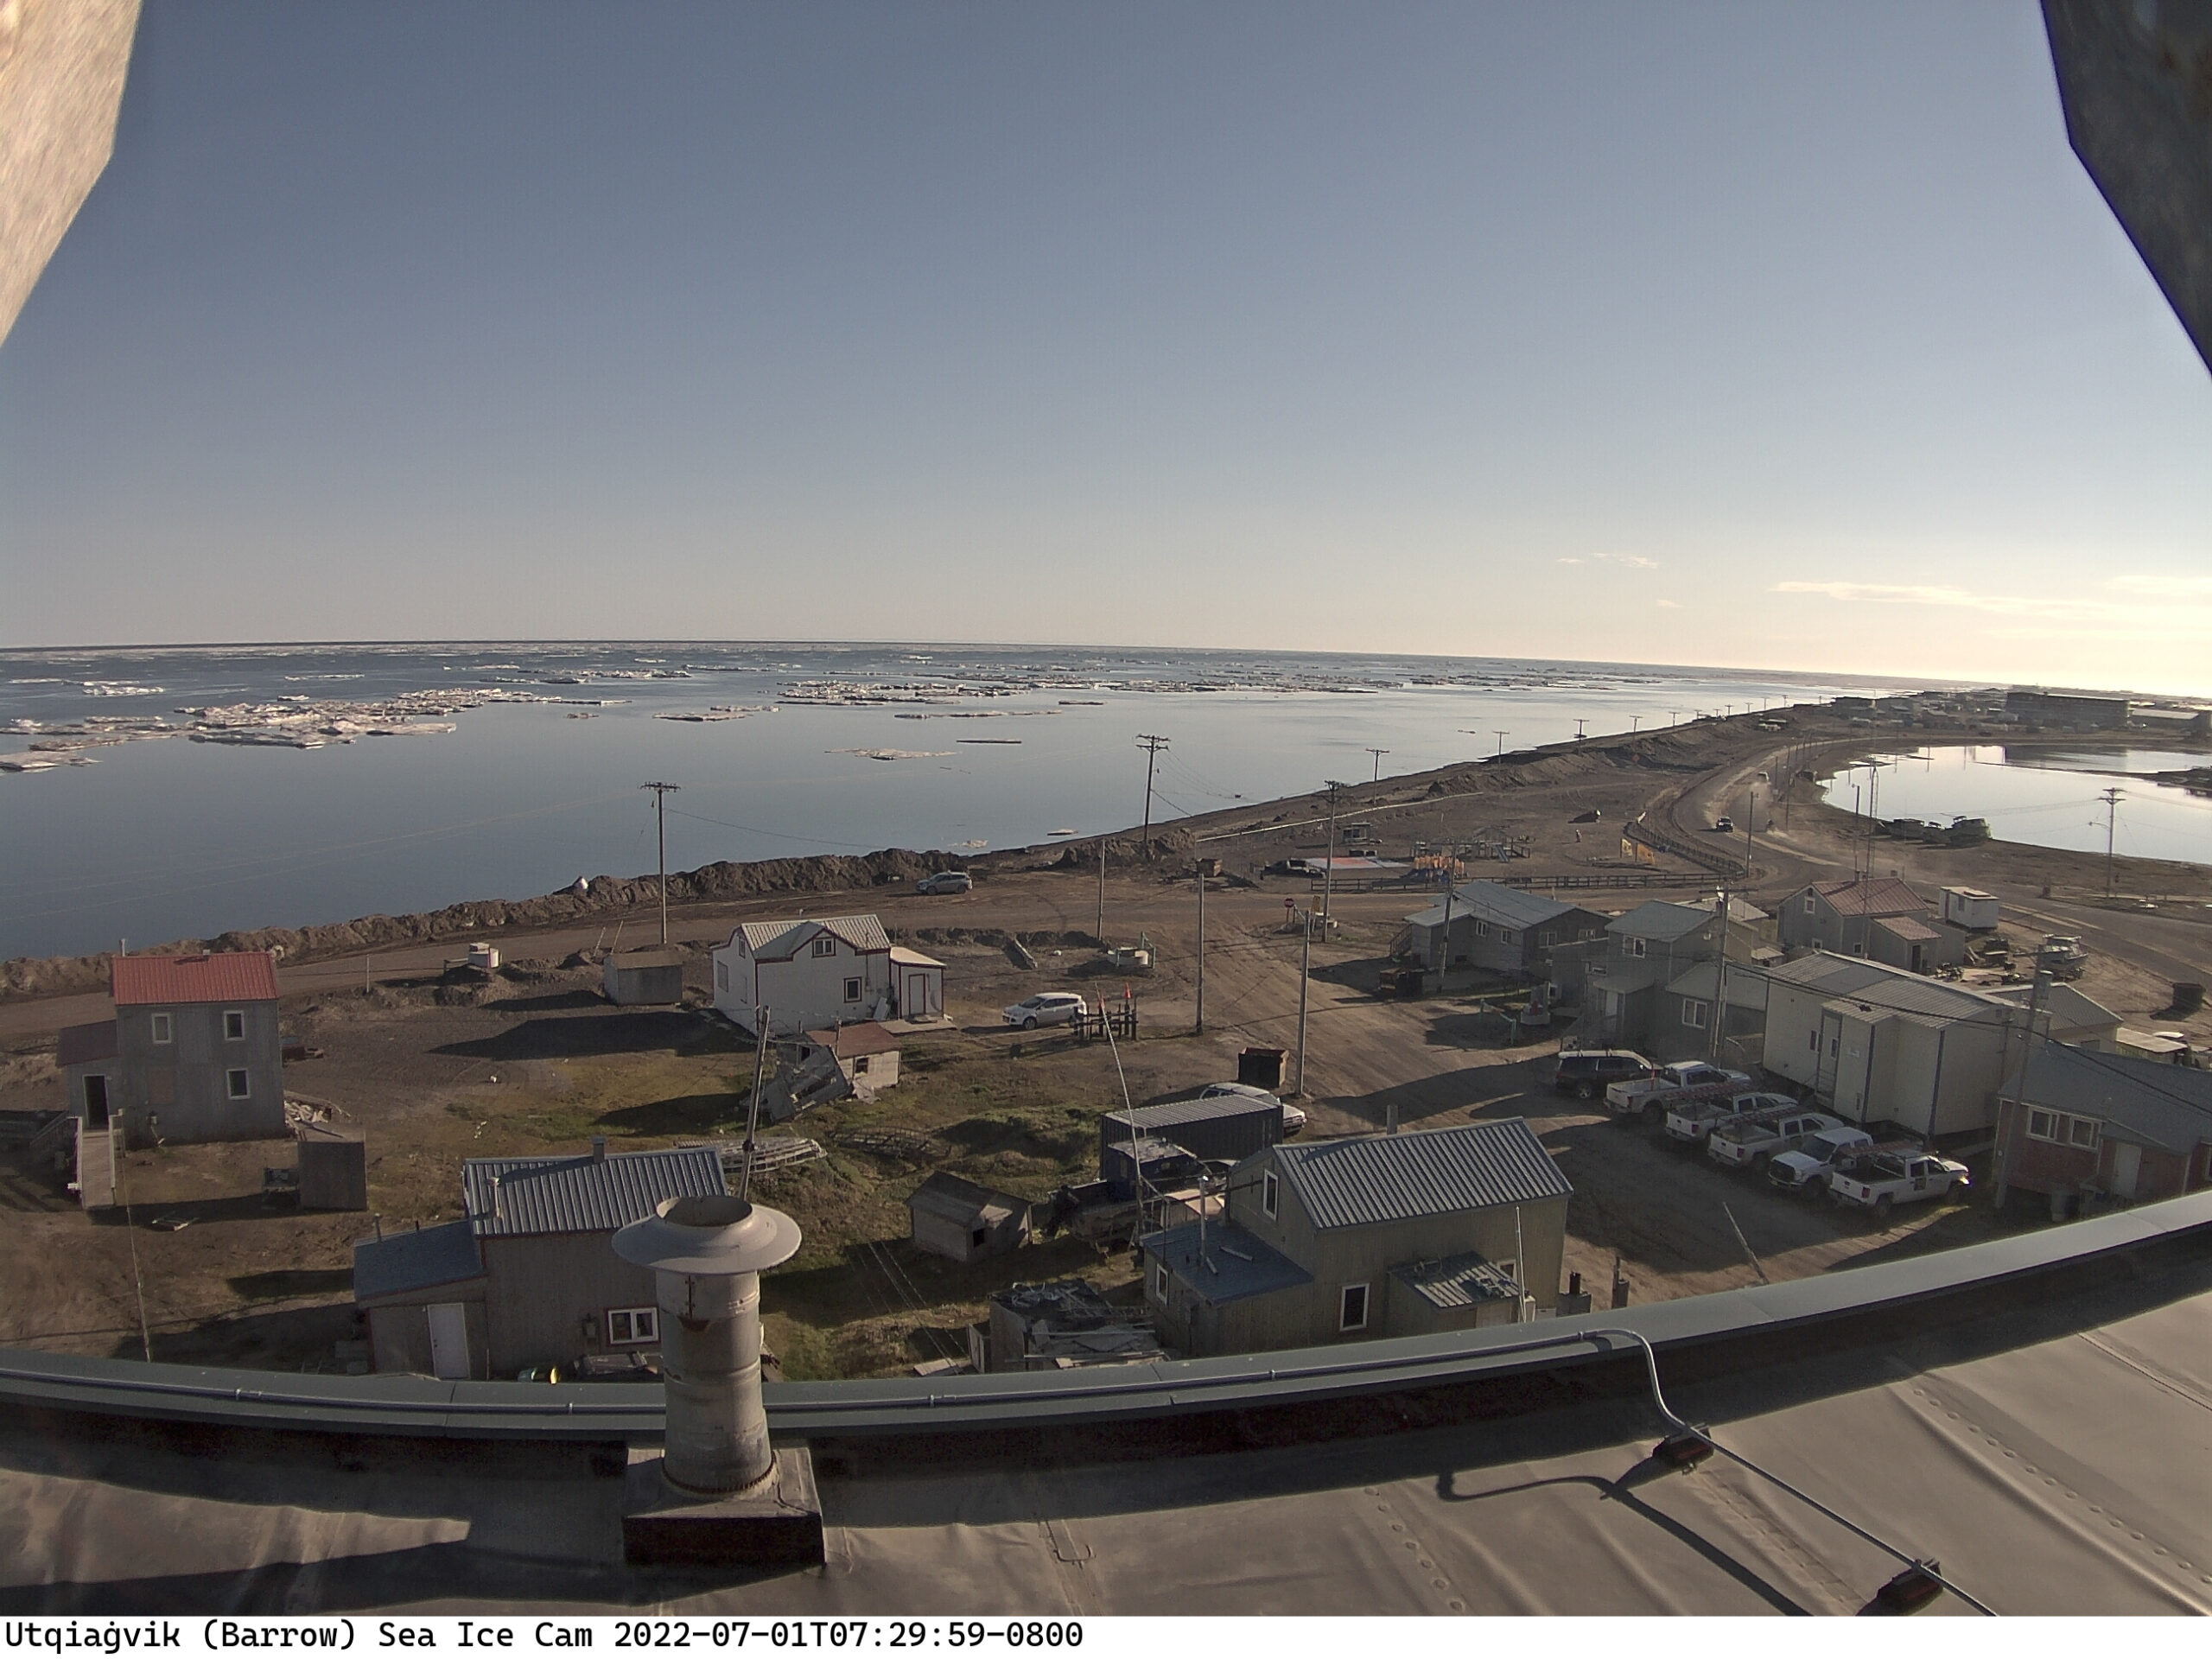
Most of the fast ice off Utqiaġvik has recently disappeared:
Meanwhile further out into the Chukchi Sea the sea ice looks to be in poor shape at the moment, with surface melting apparent across the entire region:
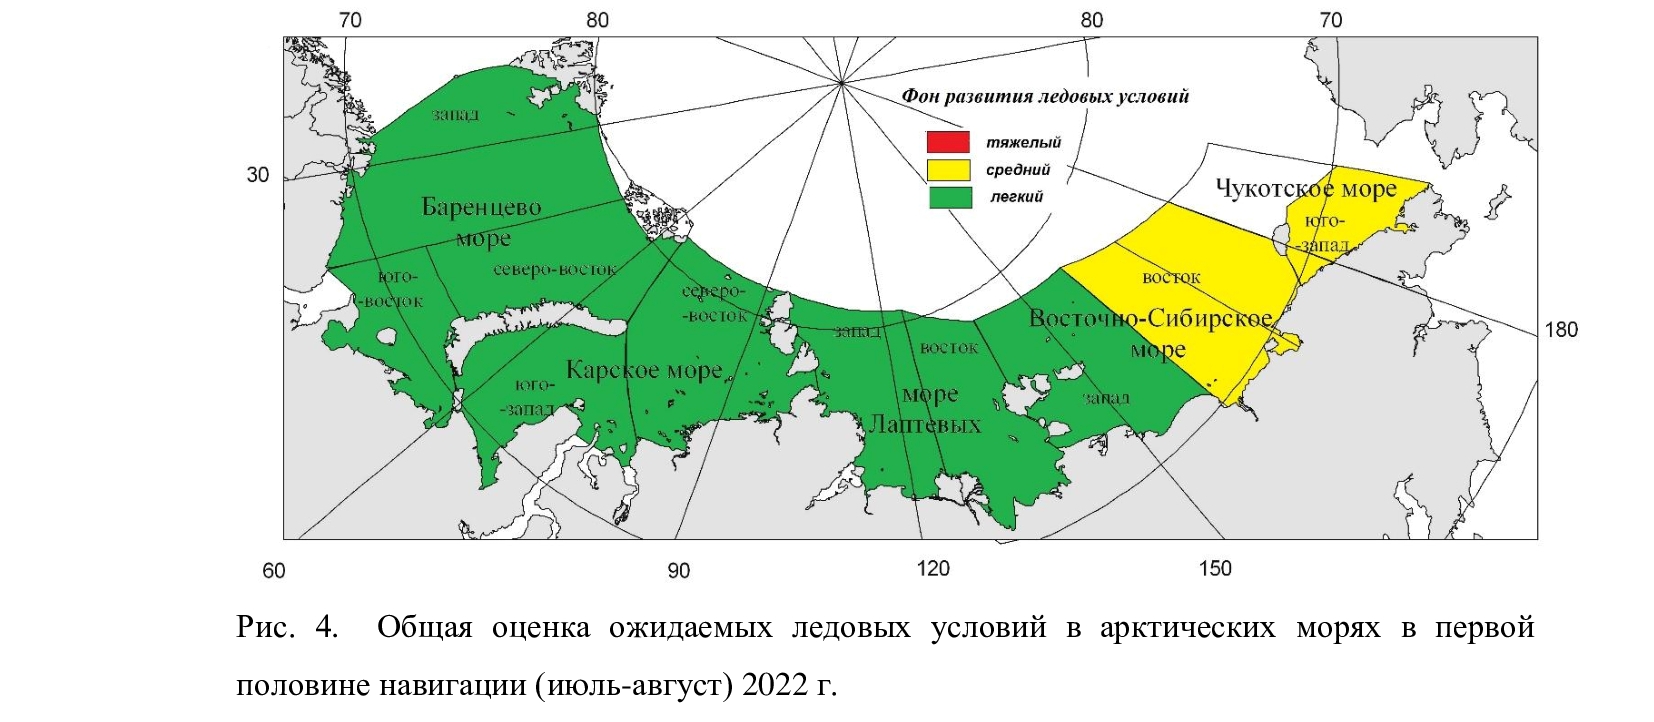
On June 17th the Northern Sea Route Administration published the Arctic and Antarctic Research Institute forecast of ice conditions for June to August 2022. Here’s the summary:
“Favorable” conditions in most areas, but “average” in the eastern East Siberian Sea and south west Chukchi Sea.
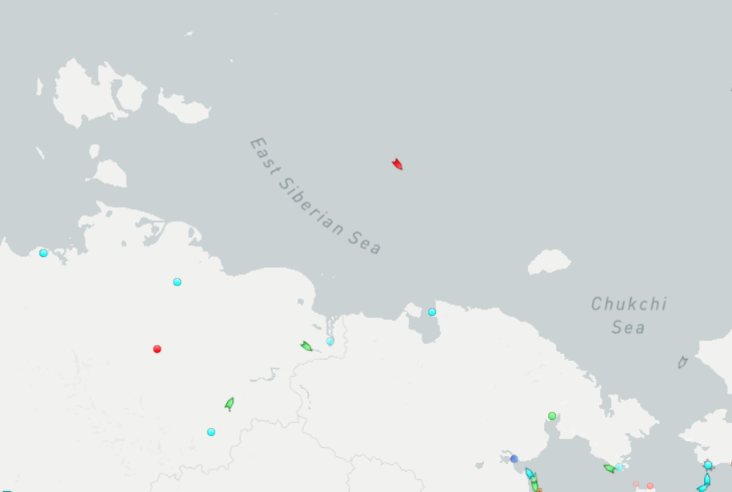
Traffic along the main Northern Sea Route has already begun. Marine Traffic reveals that the liquified natural gas carrier Nikolay Yevgenov is heading for the Bering Strait and has already sailed north of the New Siberian Islands. He is now entering the “average” ice area in the eastern ESS:
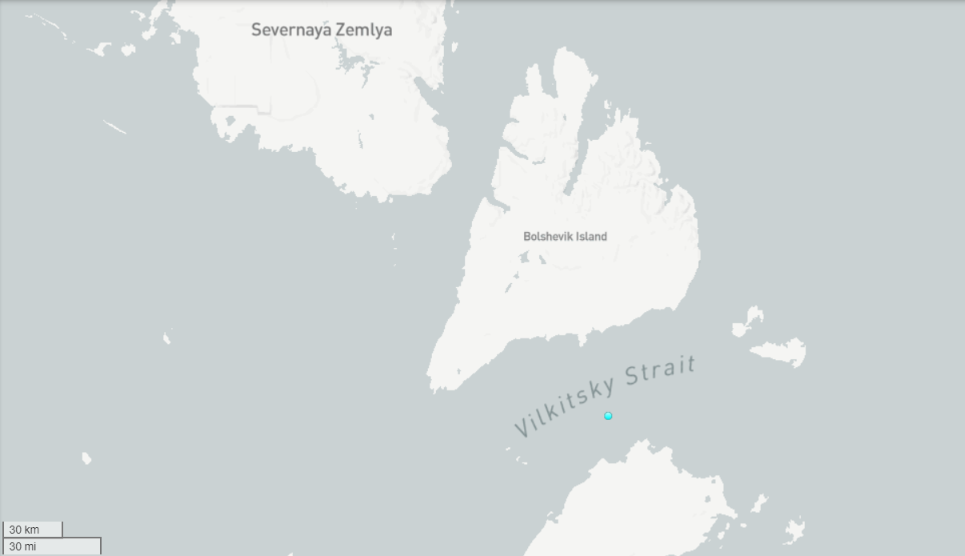
Meanwhile the recently commissioned nuclear powered icebreaker Sibir is patiently waiting in the Vilkitsky Strait:
The Northern Sea Route is evidently already “open” for ice hardened LNG tankers, but not yet for more conventional vessels. Here is the current AMSR2 sea ice concentration map:
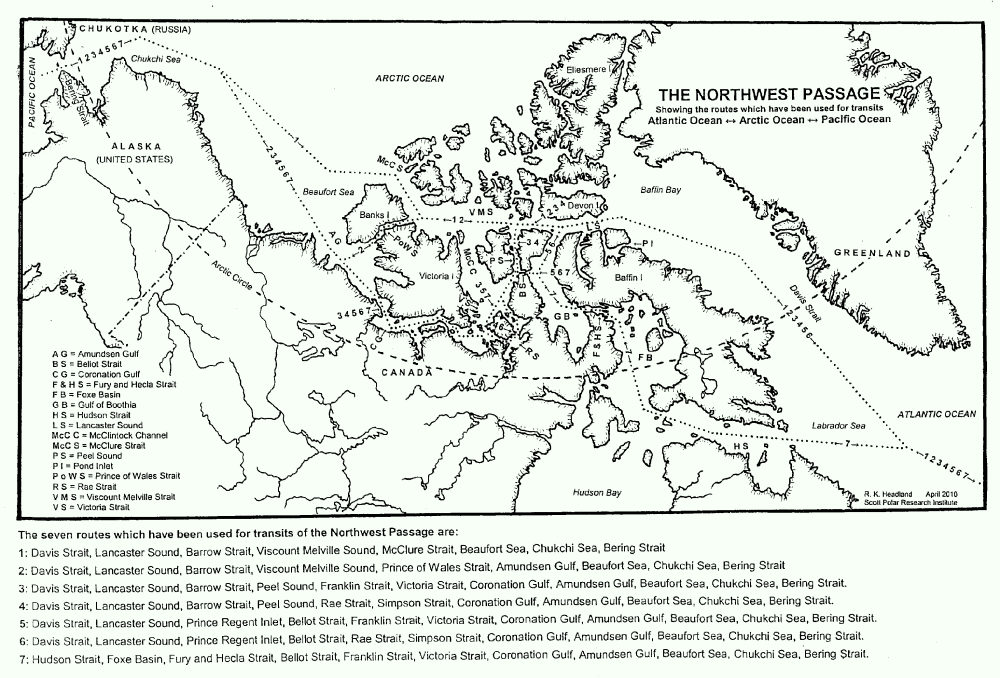
After a quiet couple of years due to the Covid-19 pandemic there are numerous cruises through the Northwest Passage planned for the summer of 2022. Some (very!) small vessels are also currently scheduled to attempt that perilous journey. First of all let’s take a look at a map of the assorted routes through the Canadian Arctic Archipelago:
plus another map which includes a few more place names:
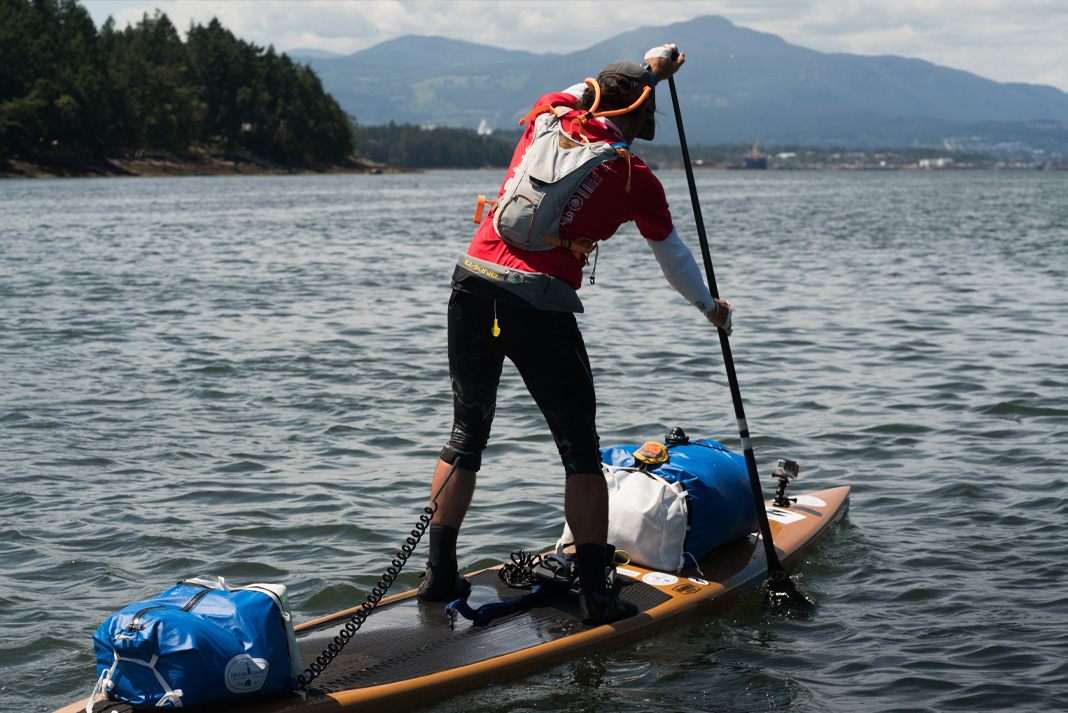
Next comes news of the expeditions planned by a variety of intrepid adventurers. According to Karl Kruger’s web site :
In 2022, Karl will attempt to become the first human to paddle 1,900 miles of the Northwest Passage on a standup paddleboard.
The article at the link is undated, but suggests that Karl initially intended to set off for Pond Inlet from Tuktoyaktuk in July 2019, but postponed the trip until the summer of 2020. By then Covid restrictions were in place, so next month provides the first opportunity for him to attempt the journey once again.
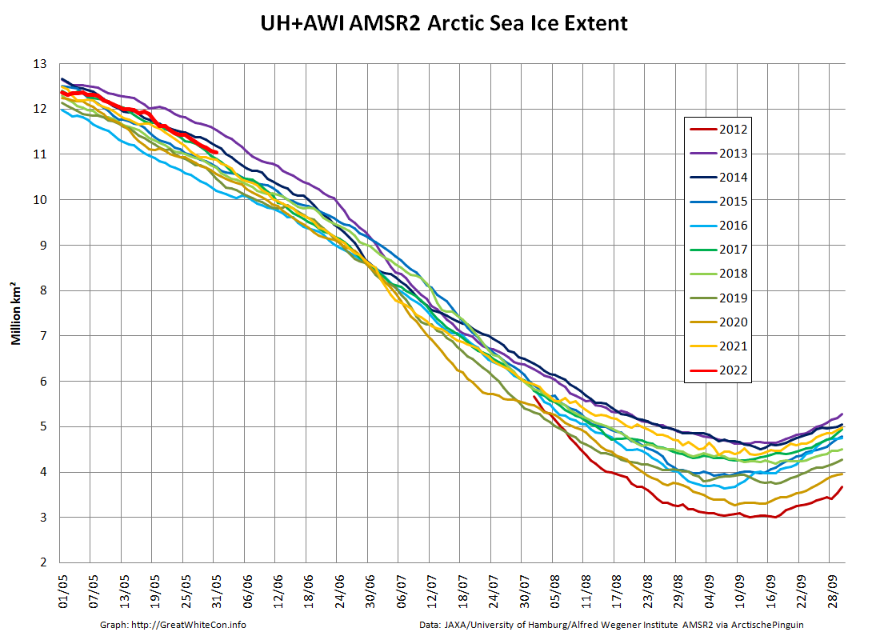
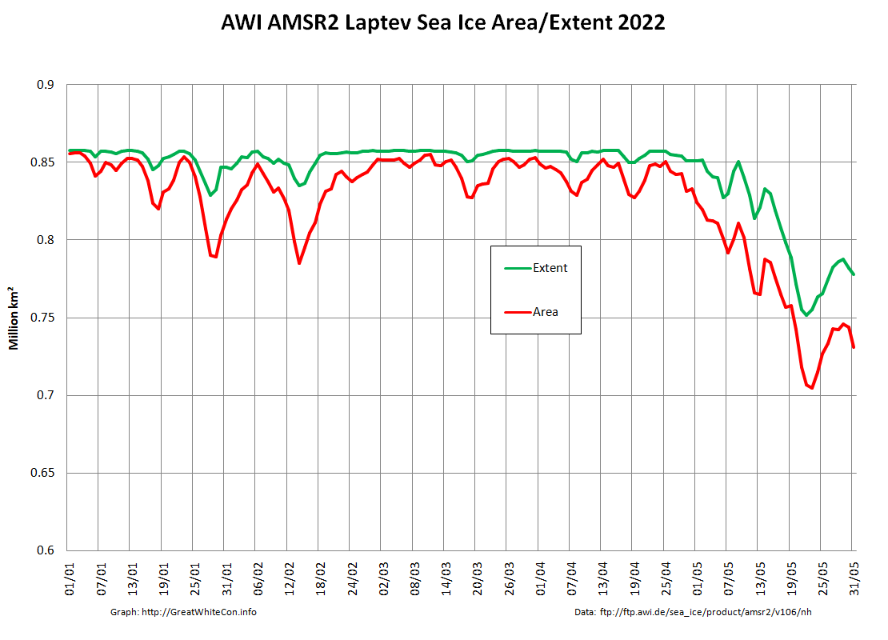
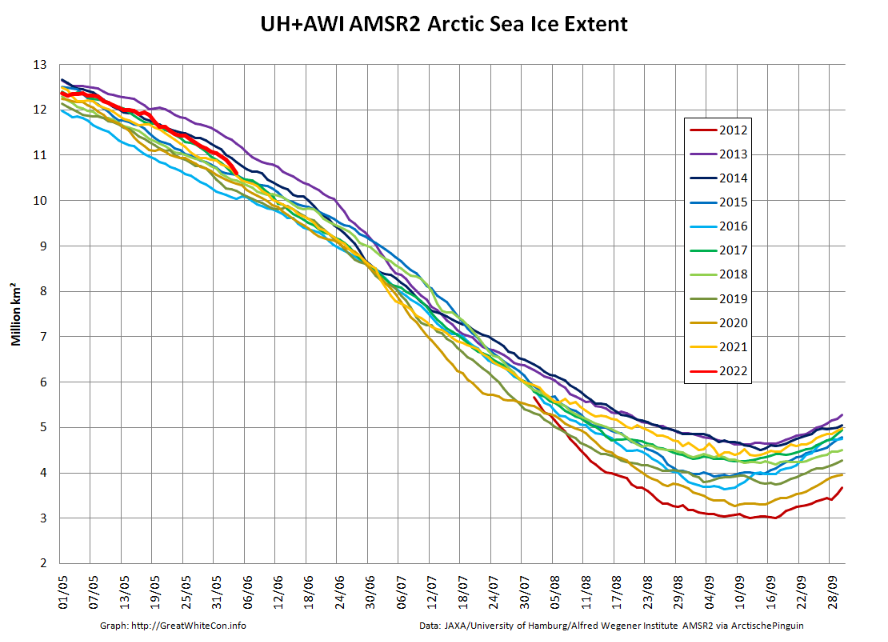
May 2022 proved to be fairly uneventful in the Arctic. High resolution AMSR2 Arctic sea ice extent has remained towards the top of the recent pack:
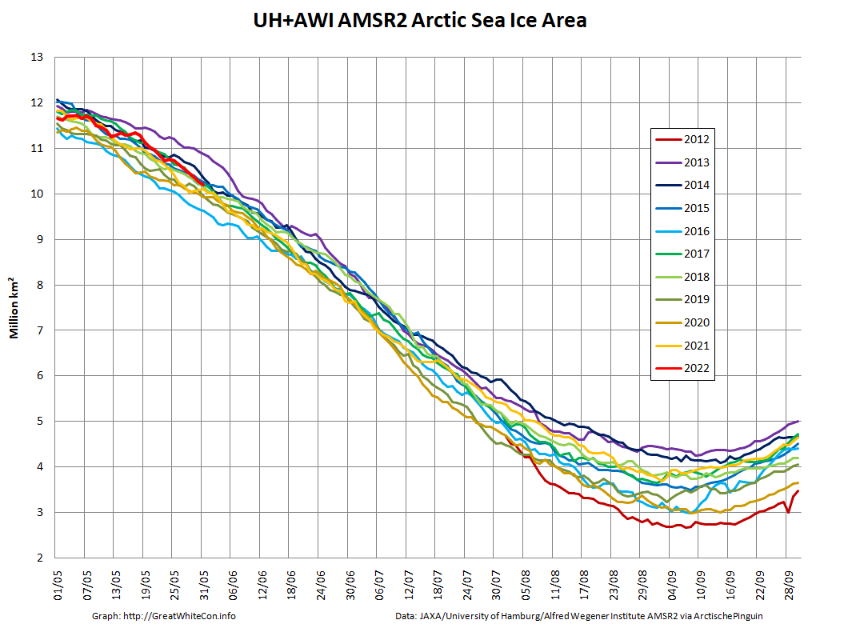
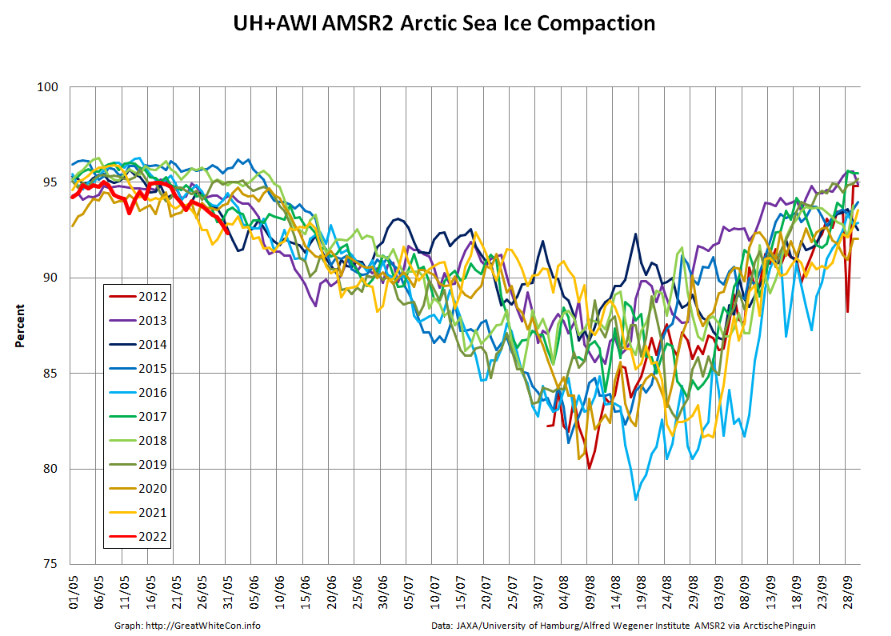
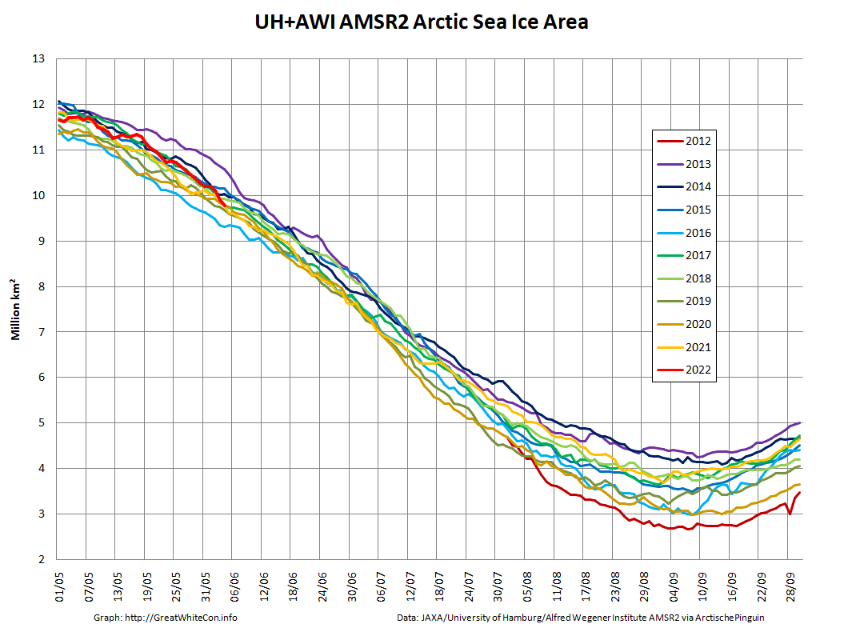
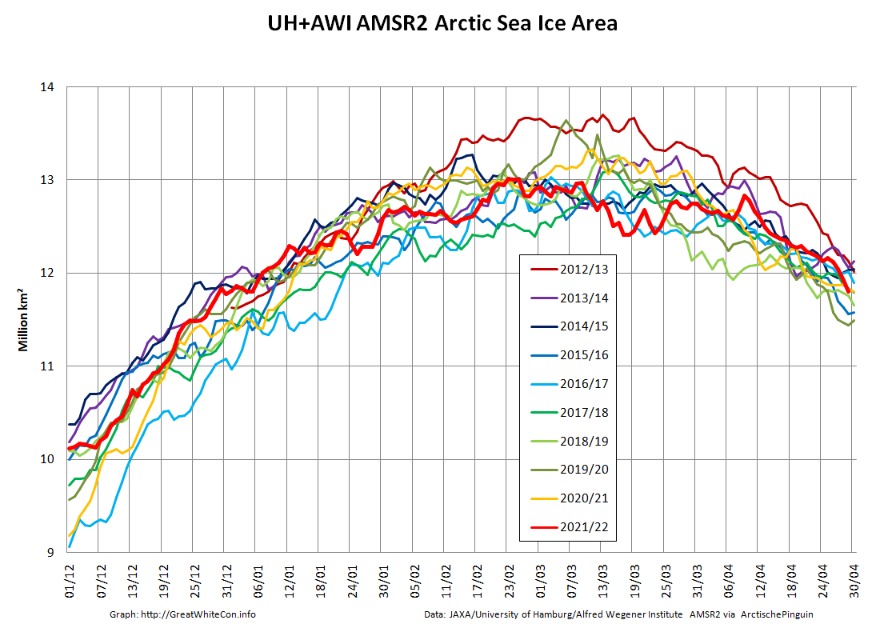
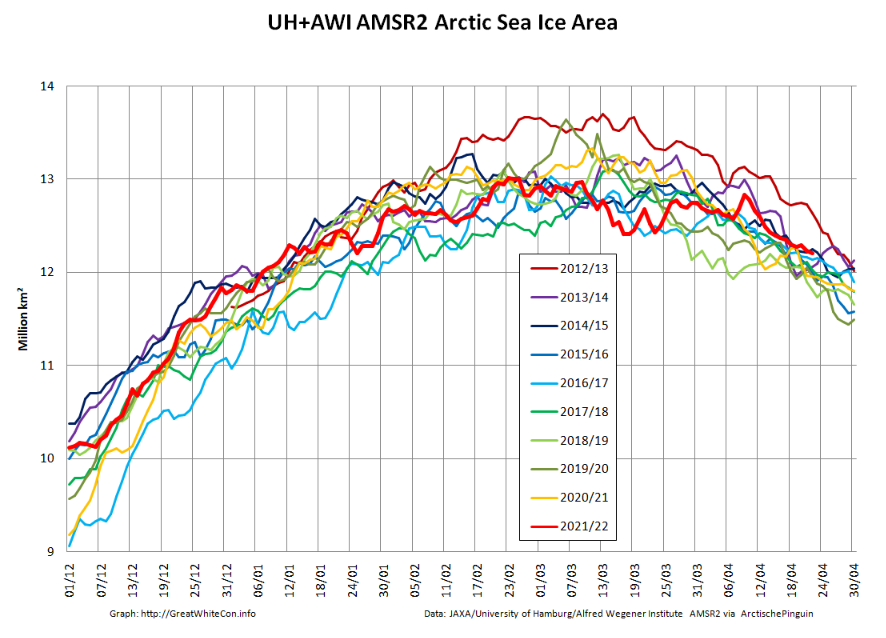
However Arctic sea ice area has been declining more quickly recently, and compaction is now lowest for the date in the AMSR2 record:
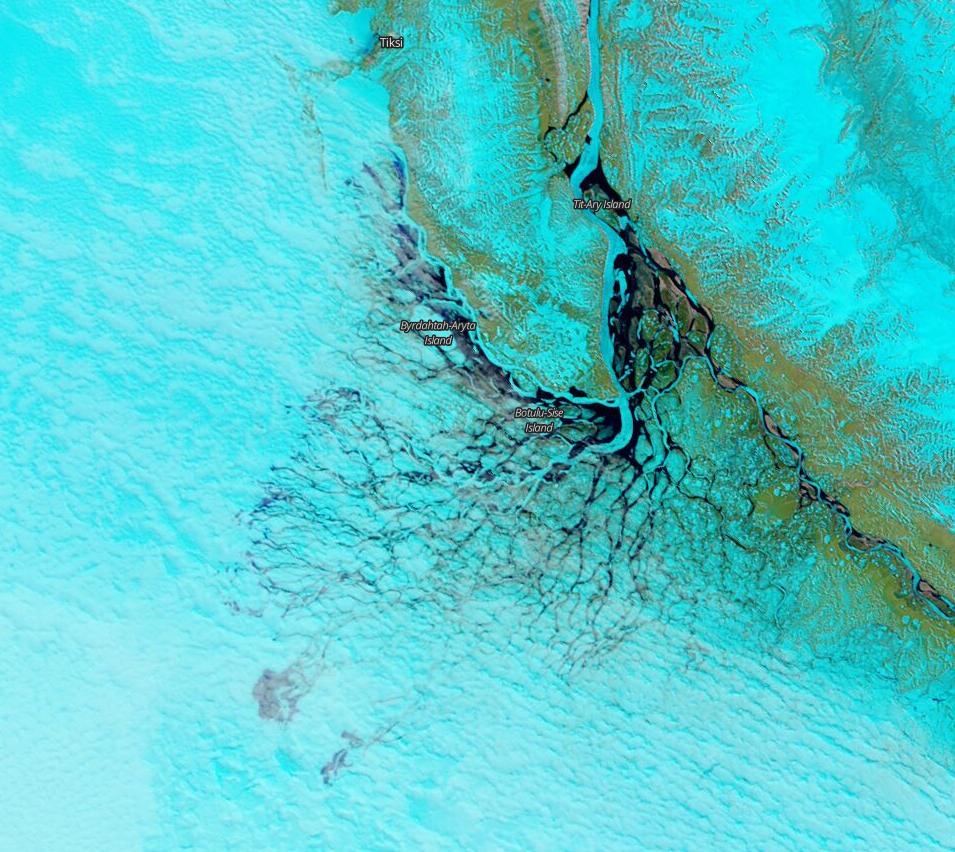
The clouds over the Lena Delta have thinned, to reveal melt water beginning to spread across the fast ice in the Laptev Sea:
“False colour” image of the Lena Delta on June 2nd from the MODIS instrument on the Terra satellite
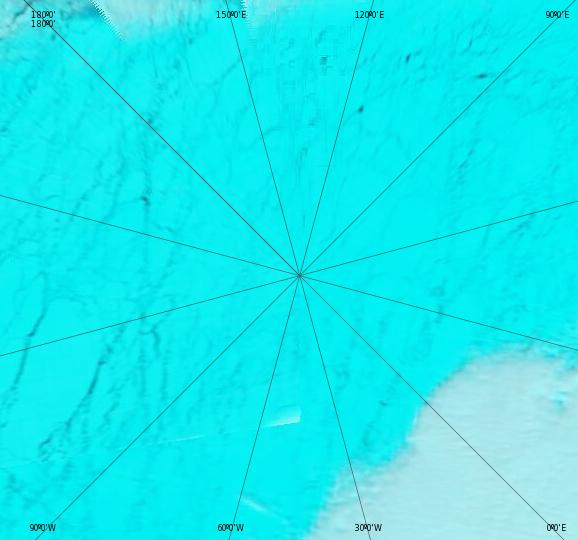
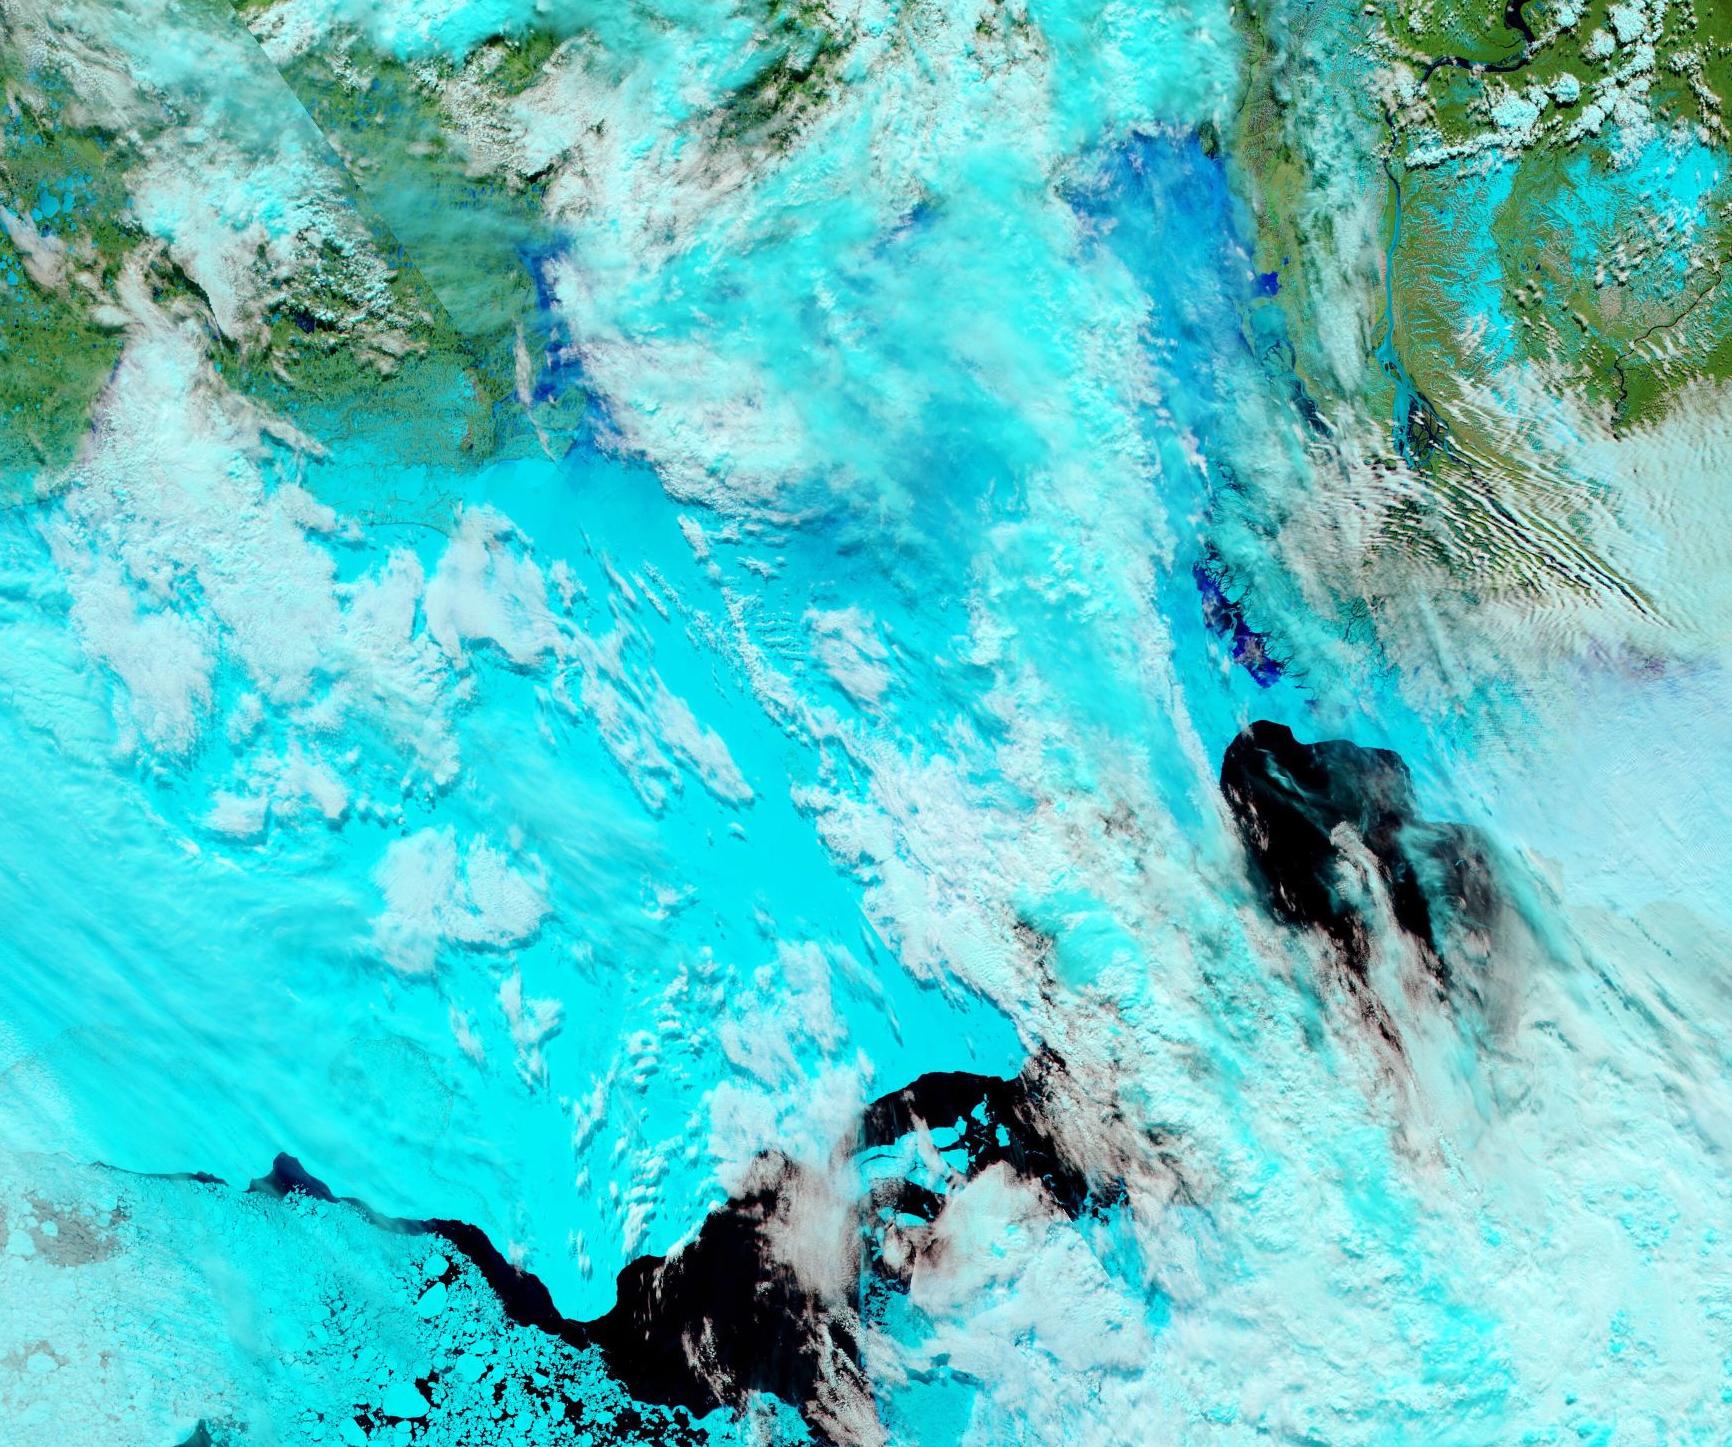
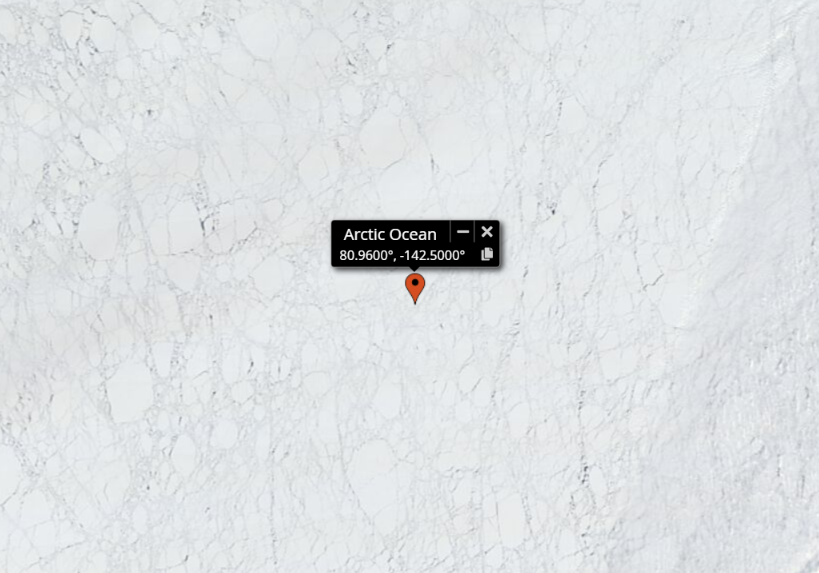
The clouds have also cleared over the North Pole, to reveal a network of leads:
“False colour” image of the North Pole on June 2nd from the MODIS instrument on the Terra satellite
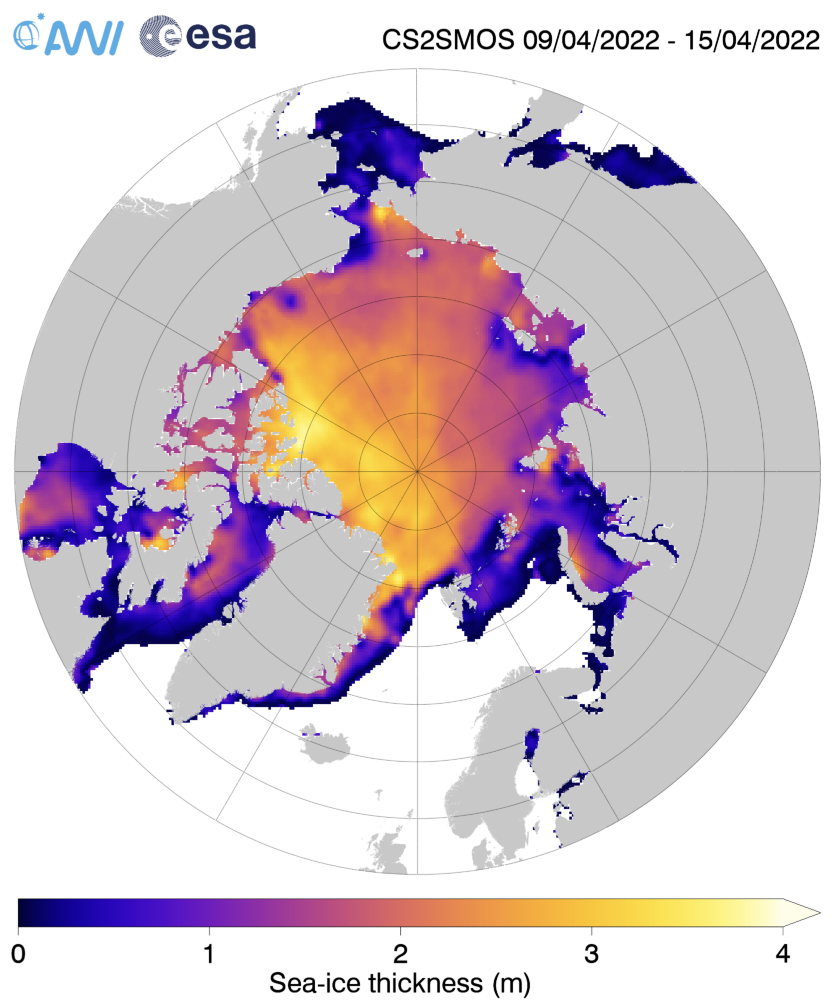
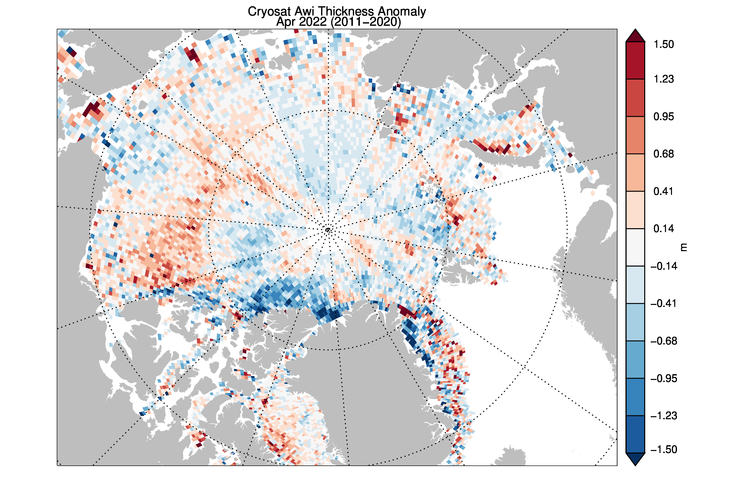
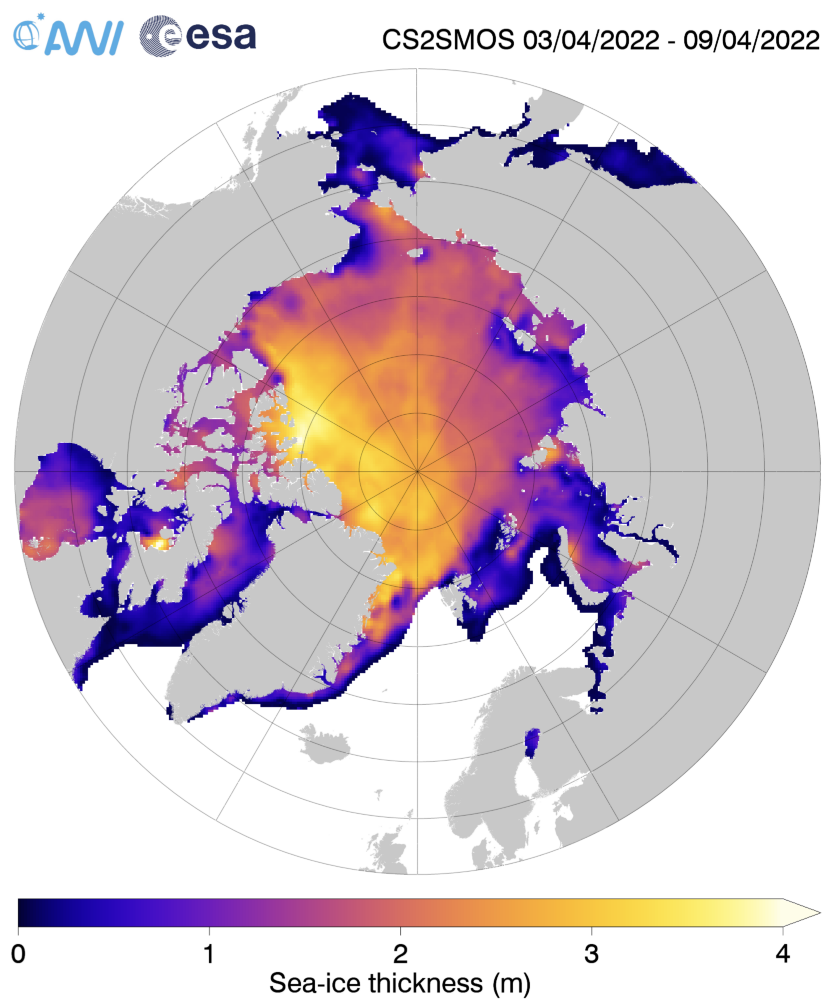
The Alfred Wegener Institute have recently released the reanalysed CryoSat-2/SMOS sea ice thickness data for mid April:
We now anxiously await the PIOMAS modelled thickness data for May. Meanwhile the AWI data suggest that the thickest ice in the Central Arctic Basin is currently to be found north of Axel Heiberg Island, with the thin ice in the Laptev Sea ripe for further extent reductions:
[Edit – June 5th]
Large areas of the fast ice in the Laptev Sea are now showing evidence of surface melt:
“False colour” image of the Laptev Sea on June 5th from the MODIS instrument on the Aqua satellite
The JAXA ViSHOP web site is still down, so here are the latest “high resolution” AMSR2 numbers for June 4th:
Extent: 10.60 million square kilometers, Area: 9.77 million square kilometers
[Edit – June 9th]
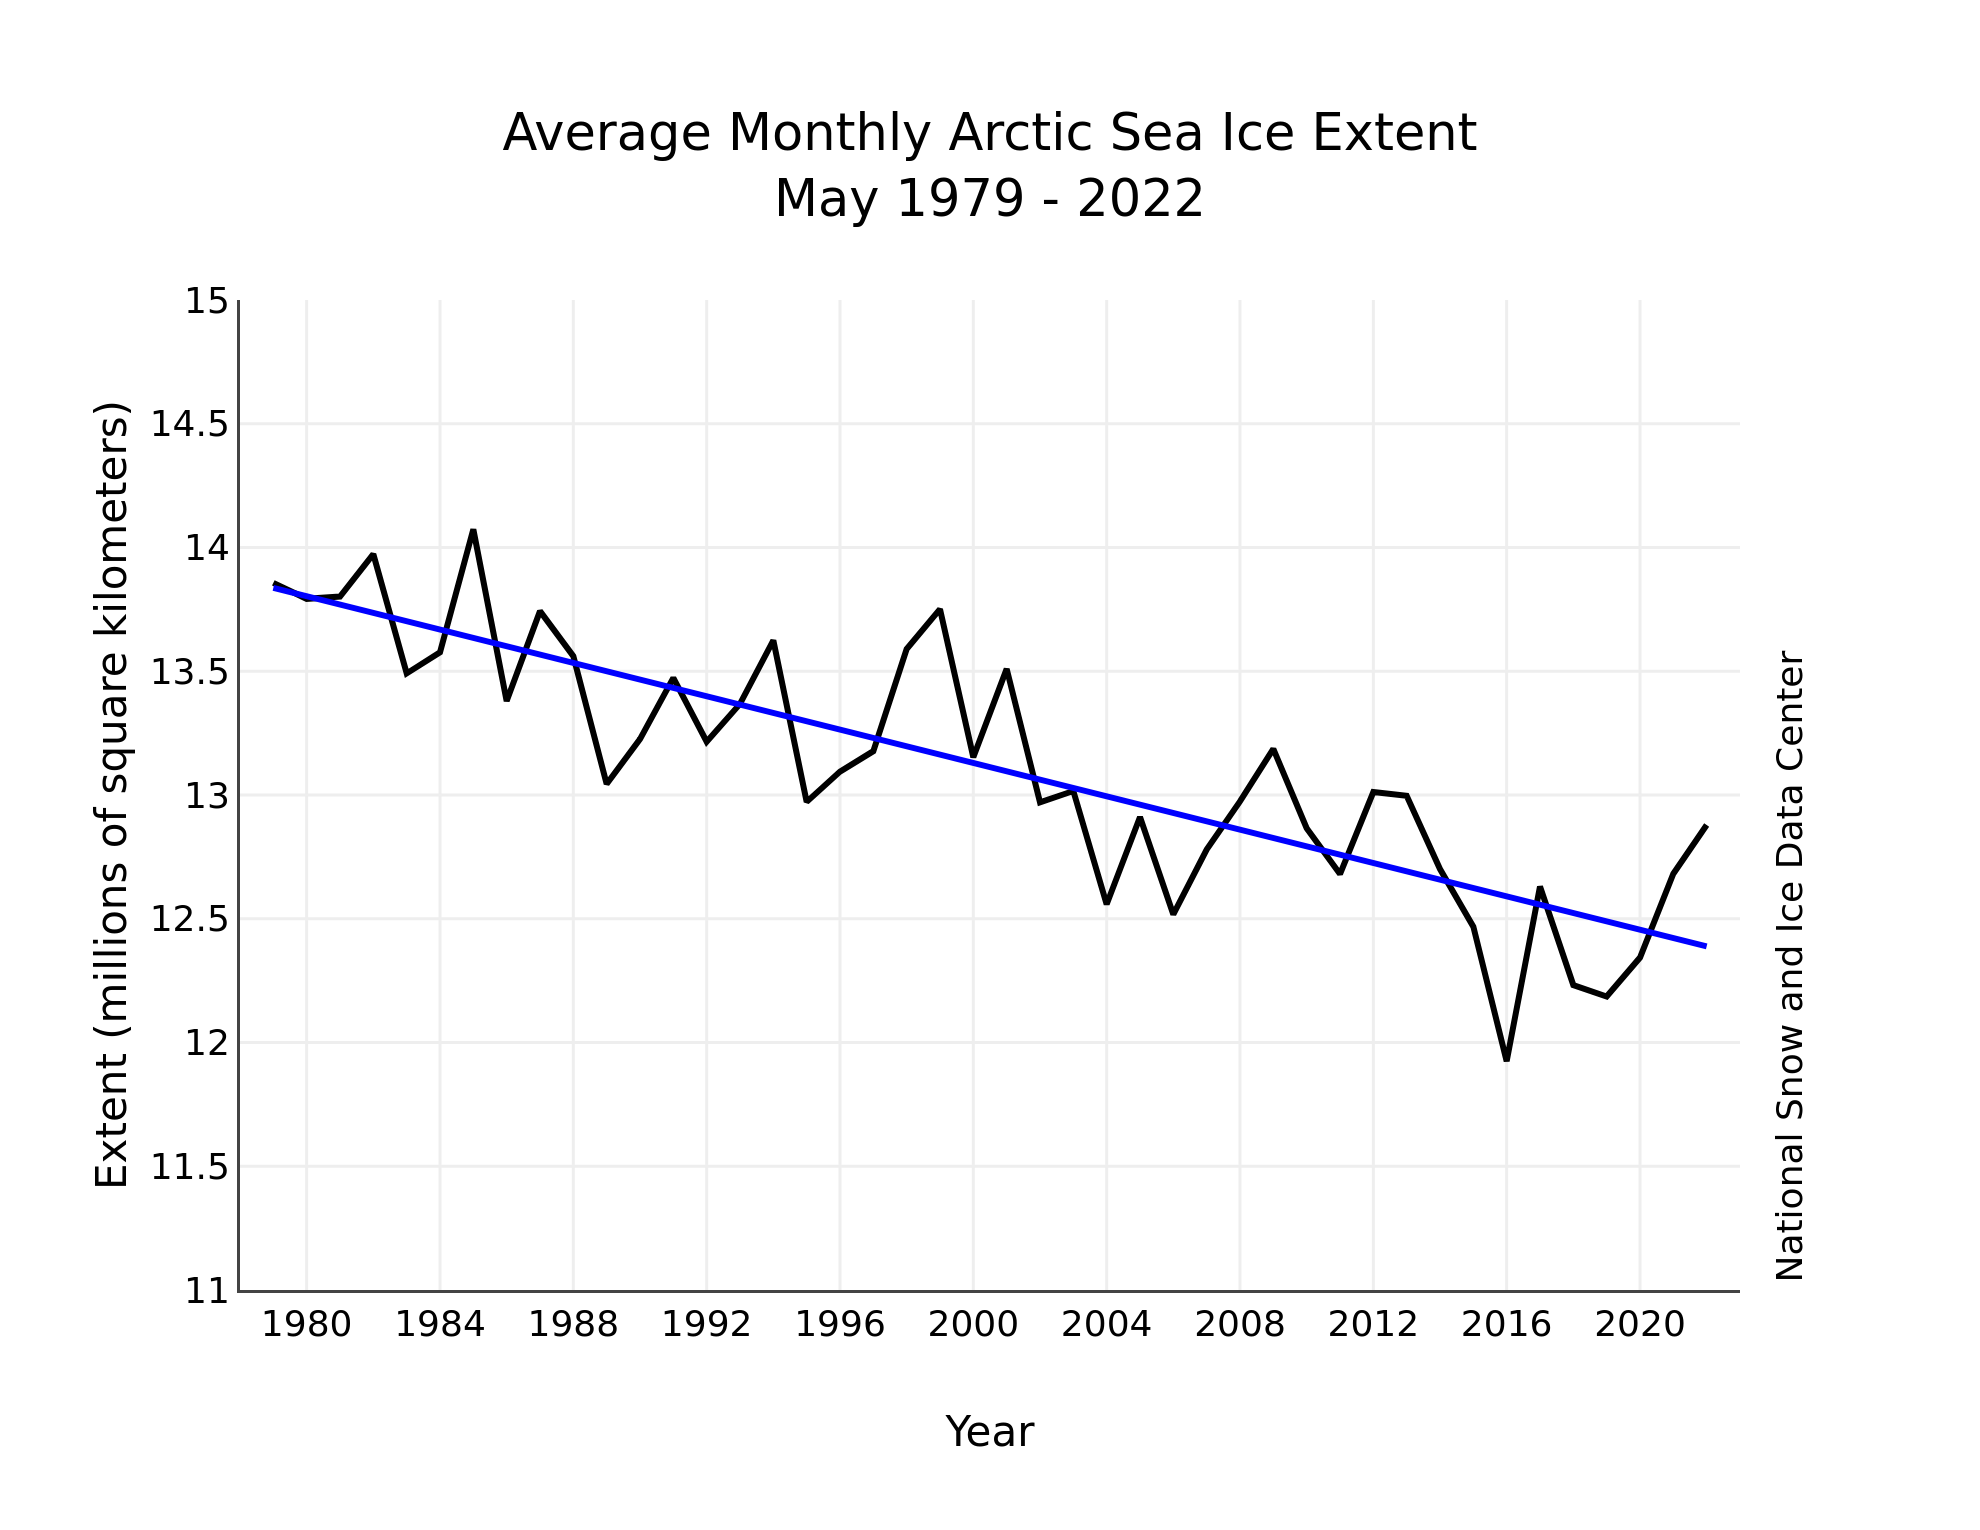
The June edition of the NSIDC’s Arctic Sea Ice News summarises May 2022 as follows:
Average Arctic sea ice extent for May 2022 was 12.88 million square kilometers (4.97 million square miles). This was 410,000 square kilometers (158,000 square miles) below the 1981 to 2010 average, yet it was the highest May extent since 2013.
As was the case for April, sea ice extent was slow to decline, losing only 1.28 million square kilometers (494,000 square miles) during the month.
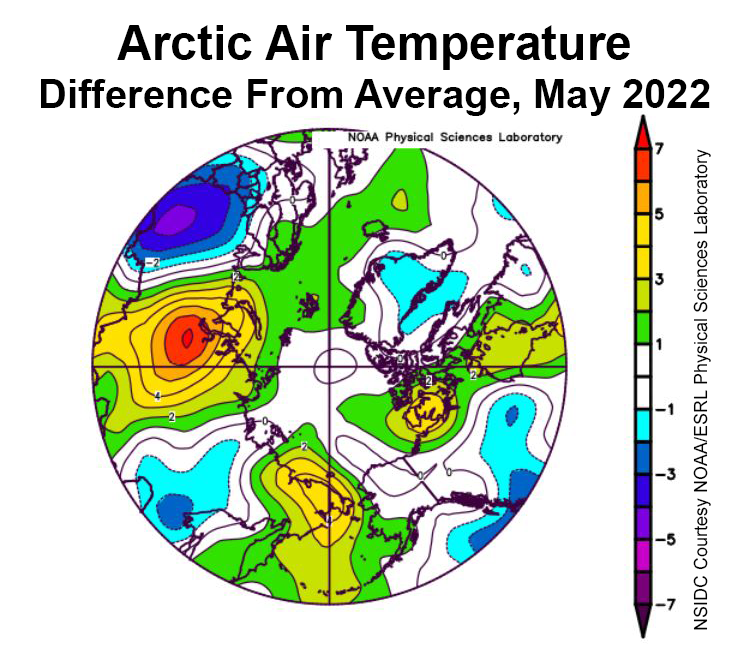
Within the Arctic Ocean, air temperatures at the 925 mb level (about 2,500 feet above the surface) were near average over most of the region in May, and 1 to 5 degrees Celsius (2 to 9 degrees Fahrenheit) above the 1981 to 2010 average along the coast of the Kara and East Siberian Seas, the East Greenland Sea, and the Canadian Archipelago:
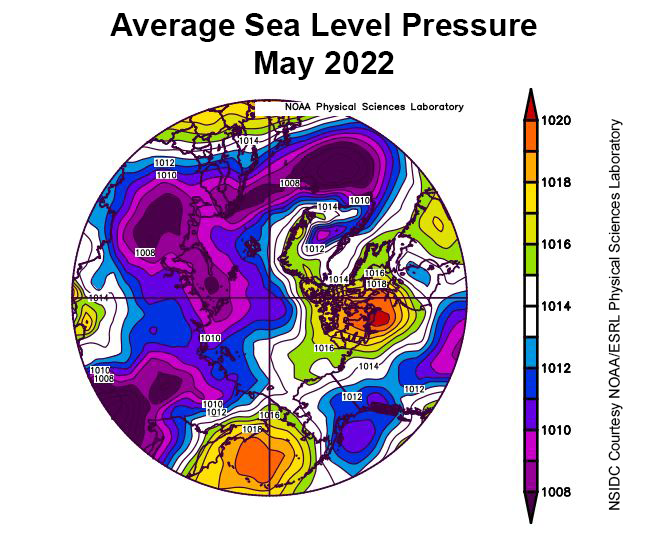
Areas where openings formed within the ice cover were dominated by off-shore ice motion, pushing ice poleward as well as toward Fram Strait. This offshore ice motion is largely driven by a pattern of low sea level pressure over Eurasia coupled with high pressure over the Pacific sector of the Arctic:
[Edit – June 12th]
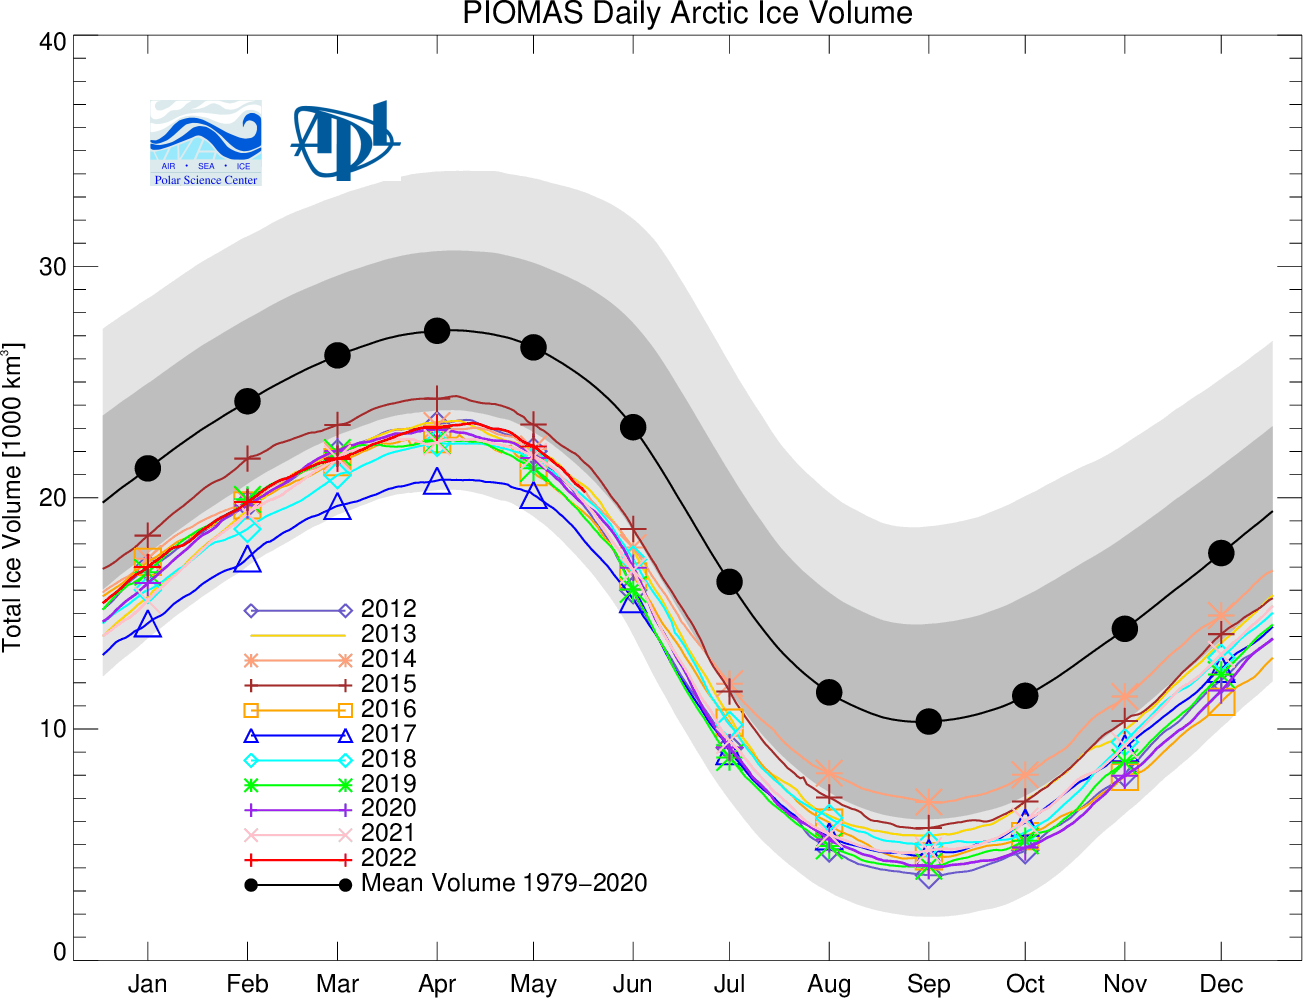
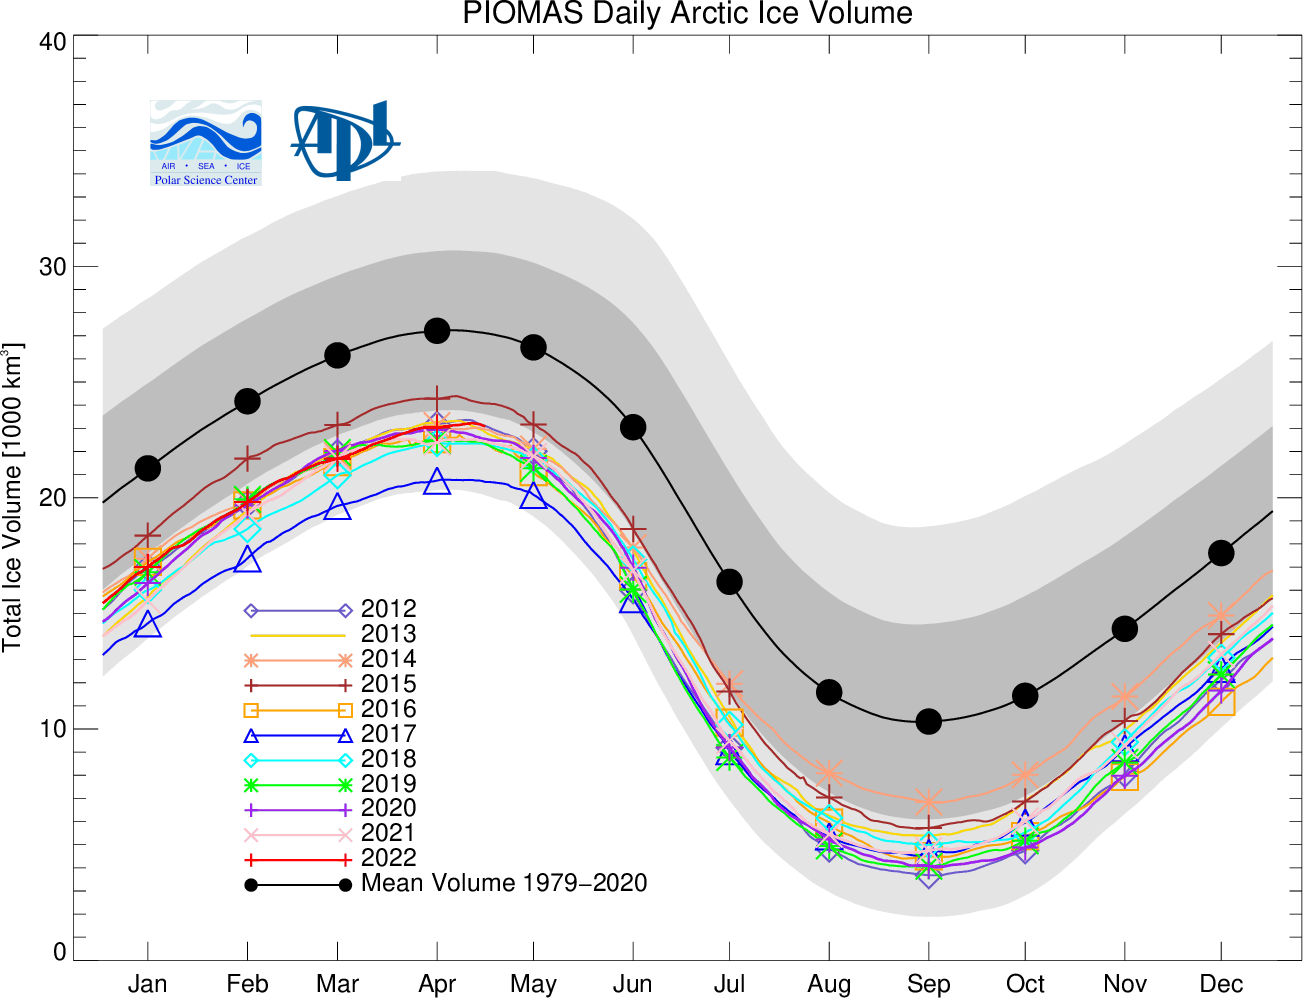
The Polar Science Center at the University of Washington has released the PIOMAS volume data for May 2022:
Average Arctic sea ice volume in May 2022 was 22,000 km3. This value is the 11th lowest on record for May, about 2,100 km3 above the record set in 2017. Monthly ice volume was 39% below the maximum in 1979 and 24% below the mean value for 1979-2021. Average May 2022 ice volume was 1.5 standard deviations above the 1979-2021 trend line.
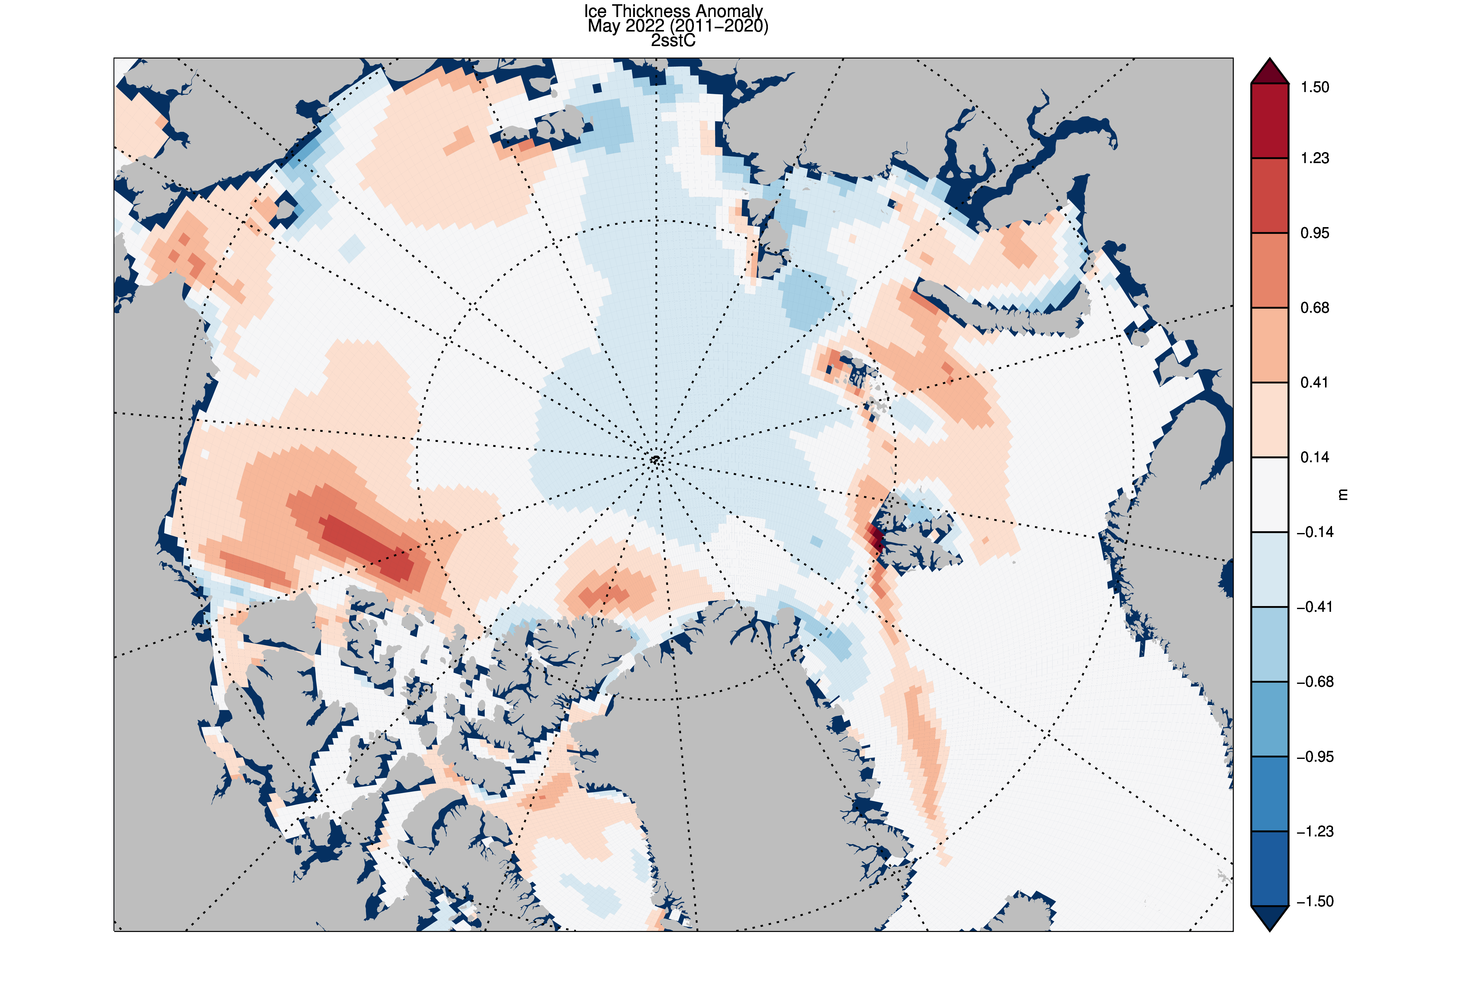
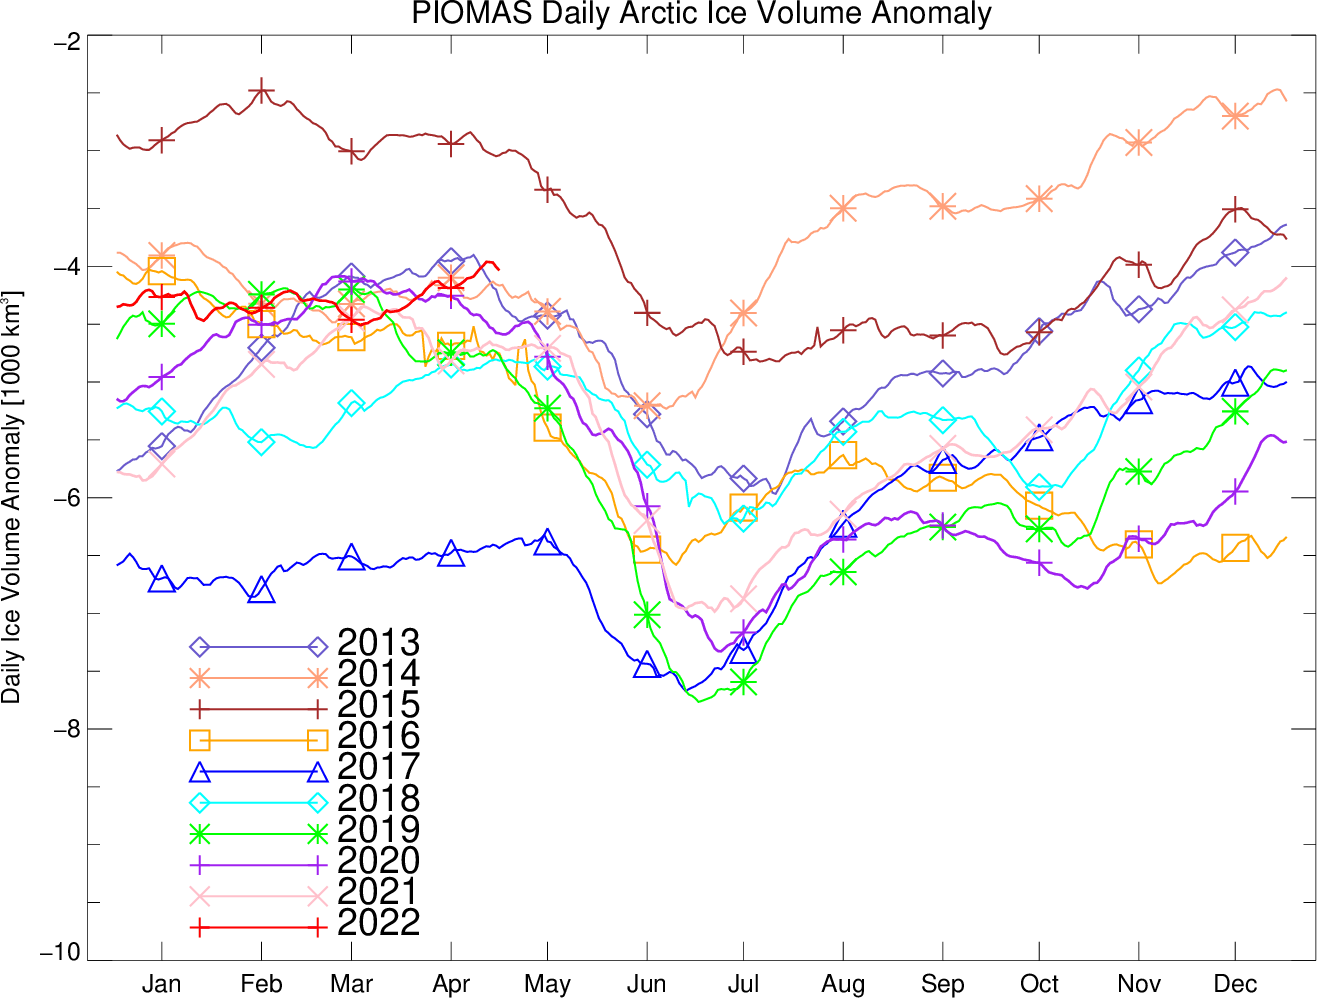
Ice growth anomalies for May 2022 continued to be at the upper end of the most recent decade (Fig 4) with a mean ice thickness (above 15 cm thickness) at the middle of recent values.
The ice thickness anomaly map for May 2022 relative to 2011-2020 continues the previous months pattern that divides the Arctic in two halves with positive anomalies in the “Western Arctic” , a strong positive anomaly in the Eastern Beaufort but negative anomalies in “Eastern Arctic”.
The development of a positive ice thickness anomaly in the Eastern Beaufort appears to be related to anomalous sea ice drift during February that transported ice along the Canadian Coast into the Beaufort. Positive anomalies in the Greenland and Barents Seas seem to be associated with higher than normal sea ice extent in those areas.
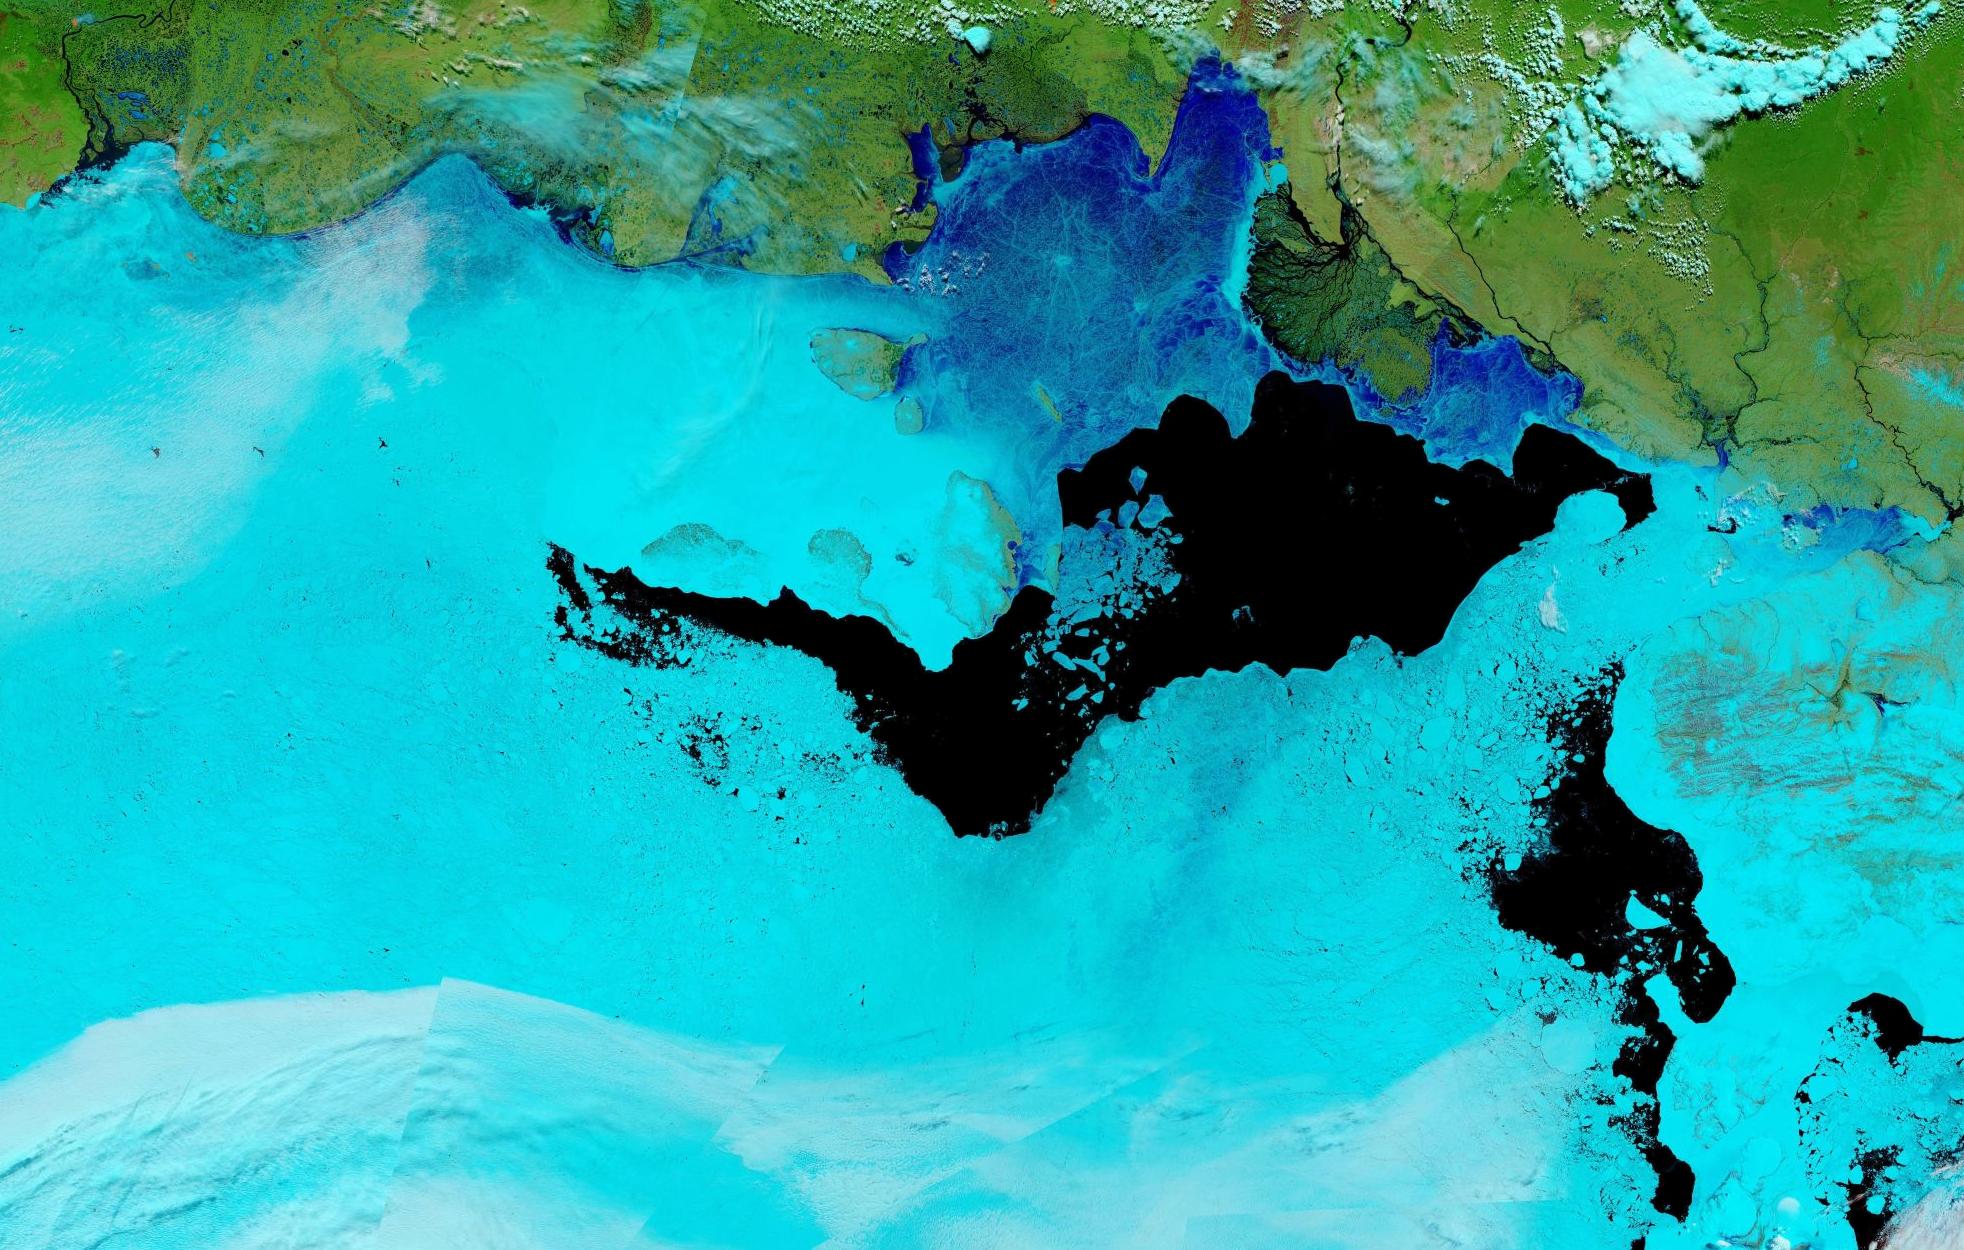
The Terra satellite has a nice clear view of the “Eastern Arctic” this morning, revealing widespread surface melt and continuing break up of the ice in the Laptev Sea:
“False colour” image of the Laptev and East Siberian Seas on June 12th from the MODIS instrument on the Terra satellite[Edit – June 16th]
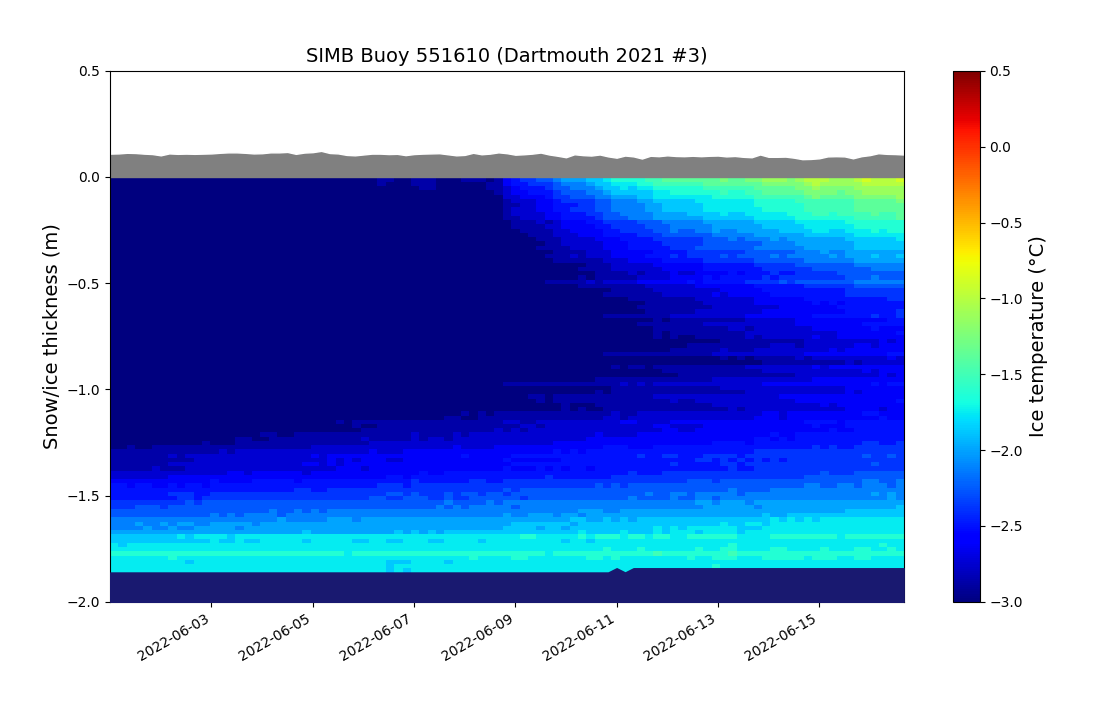
Bottom melt has begun on two ice mass balance buoys originally deployed in the Beaufort Sea last autumn.
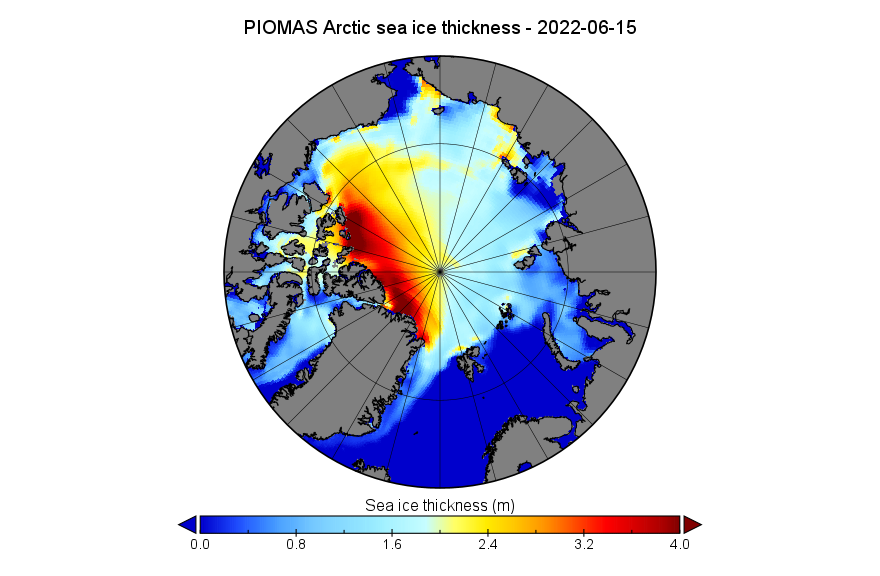
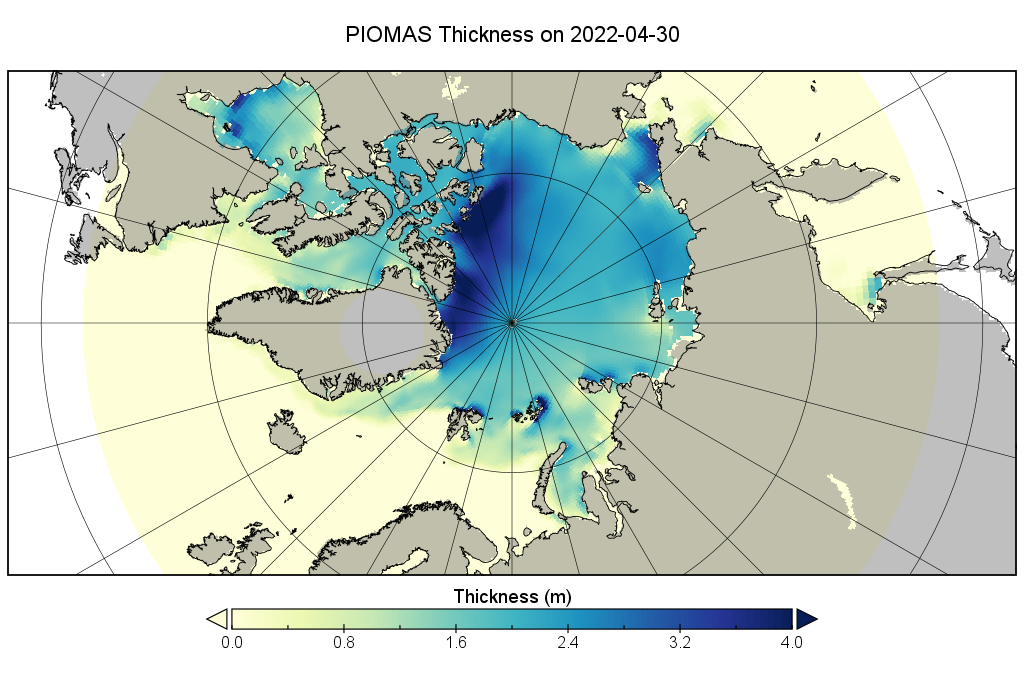
Here’s the mid June PIOMAS Arctic sea ice thickness map:
It shows hardly any ice thicker than 2 meters across the entire eastern half of the Arctic Ocean.
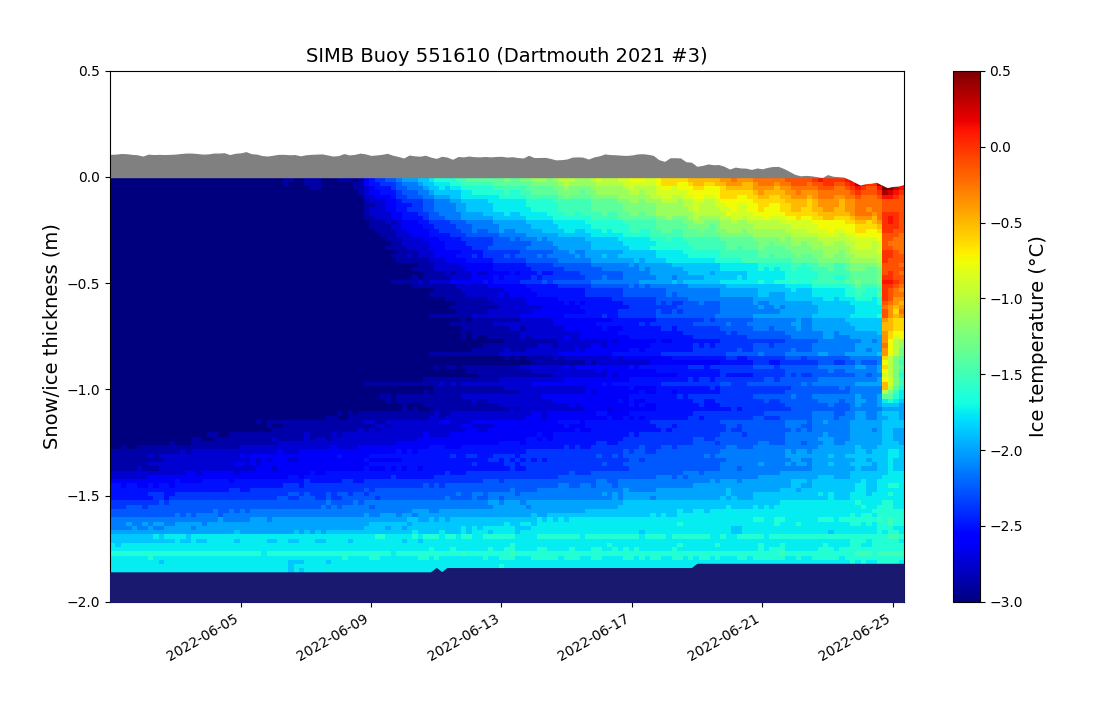
[Edit – June 25th]
The snow cover has gone and ice surface melt has begun in the northern Beaufort Sea, where IMB buoy 551610 is currently located at 78.34 N, 130.76 W:
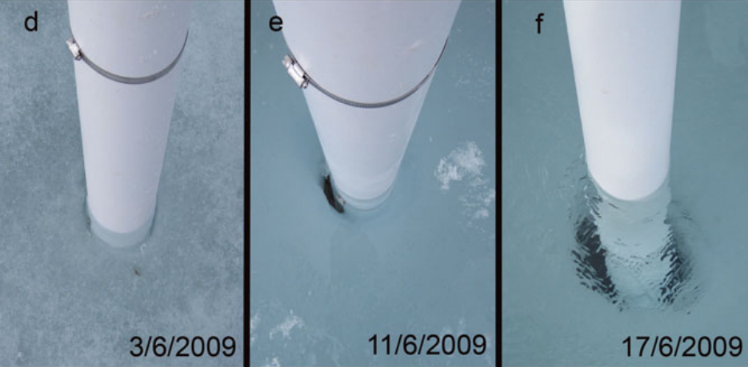
It also looks as though there has recently been preferential solar heating and hence melting around the body of the buoy, as shown in this illustration:
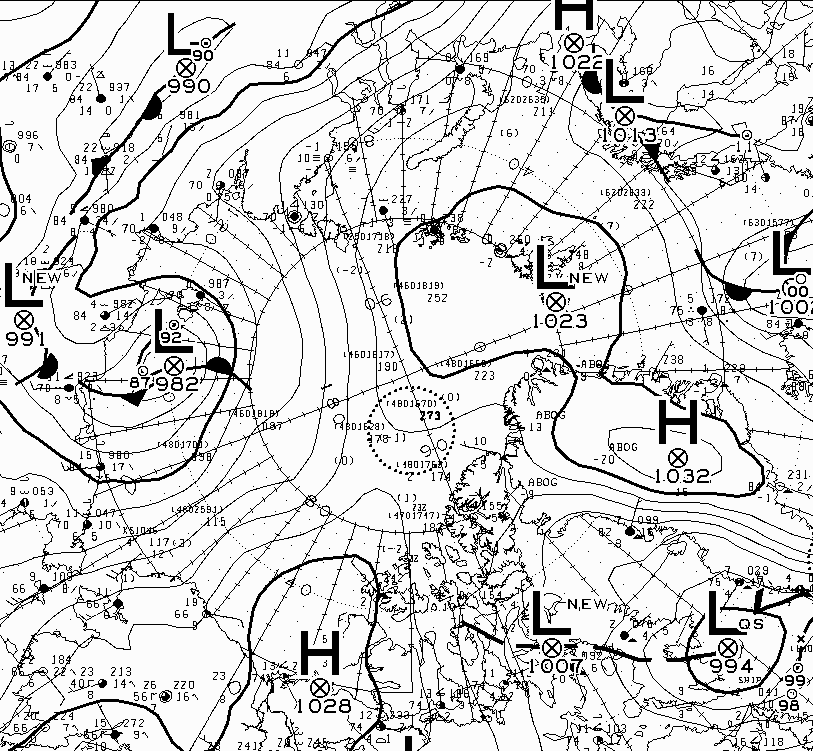
[Edit – June 26th]
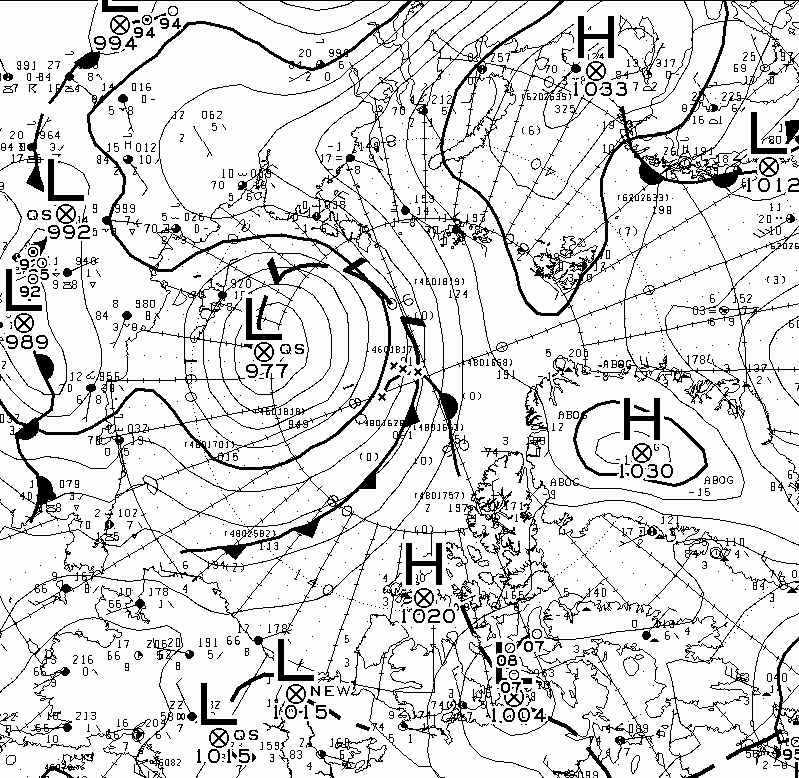
A low pressure area has formed over the East Siberian Sea. According to the Canadian Meteorological Centre‘s analysis the central mean surface level pressure had reached 982 hPa by midnight last night:
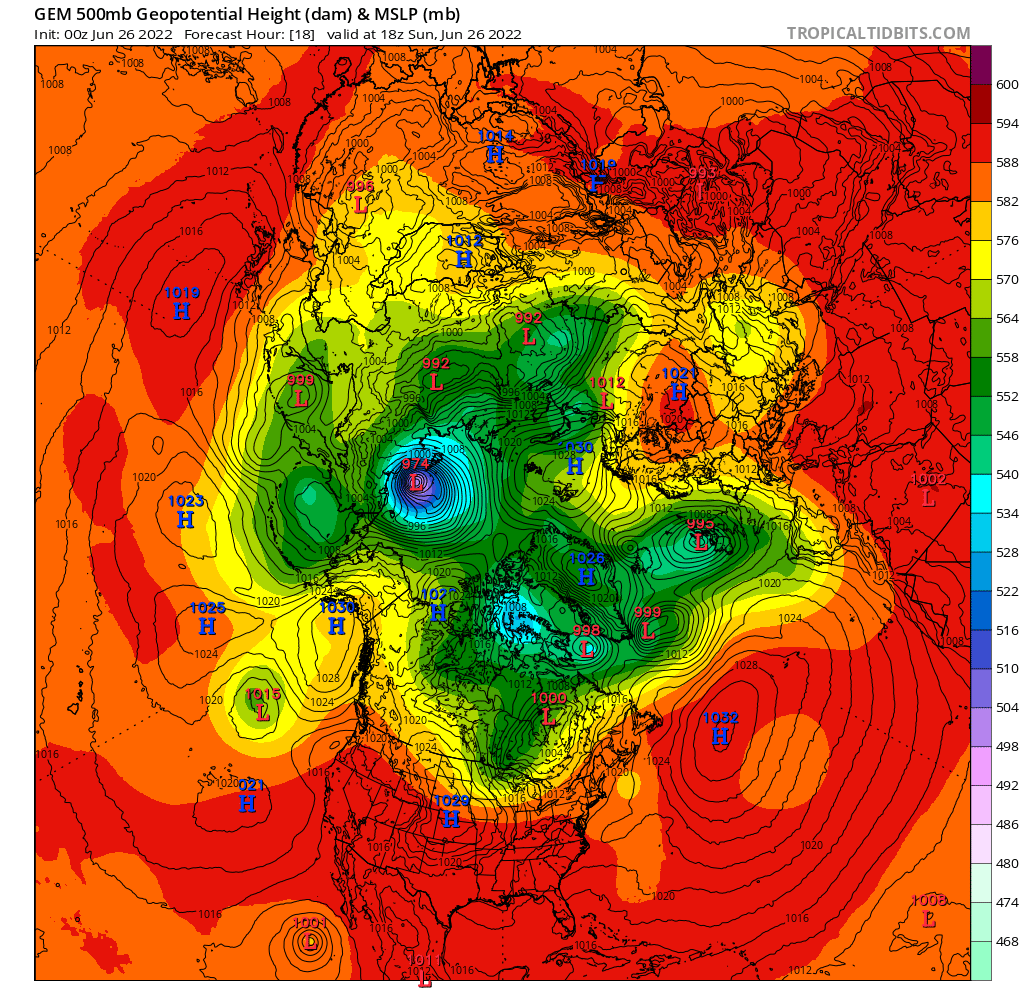
The CMC’s GEM forecast model suggests that it will bottom out at 974 hPa later this evening UTC and then persist for several days:
[Edit – June 28th]
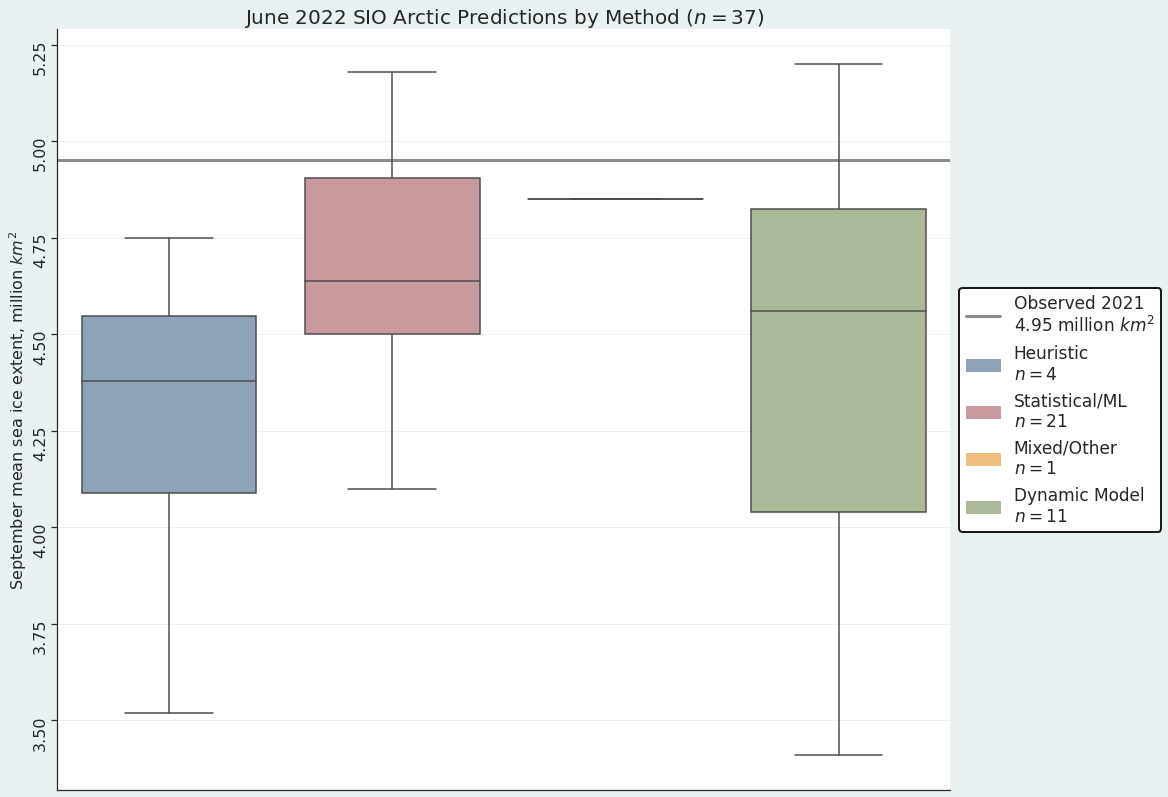
The June 2022 Sea Ice Outlook has now been published, a few days behind schedule. Neil provides a summary below, but here’s the traditional chart of predictions:
Here’s a bit more detail on the Pan-Arctic sea-ice forecast:
This year’s median forecasted value is 4.57 million square kilometers with quartiles of 4.34 and 4.90 million square kilometers. This is higher than the SIO forecasted value of September sea-ice extent for the past three years (2019–2021), but slightly below the median value of 4.60 million square cited in the 2018 SIO June report. The lowest forecast is 3.41 million square kilometers. Among the four methods that forecast September extent less than four million square kilometers, three are based on dynamical models. Two contributions forecast a record low extent (below 3.57 million square kilometers set in 2012). The highest forecast is 5.20 million square kilometers.
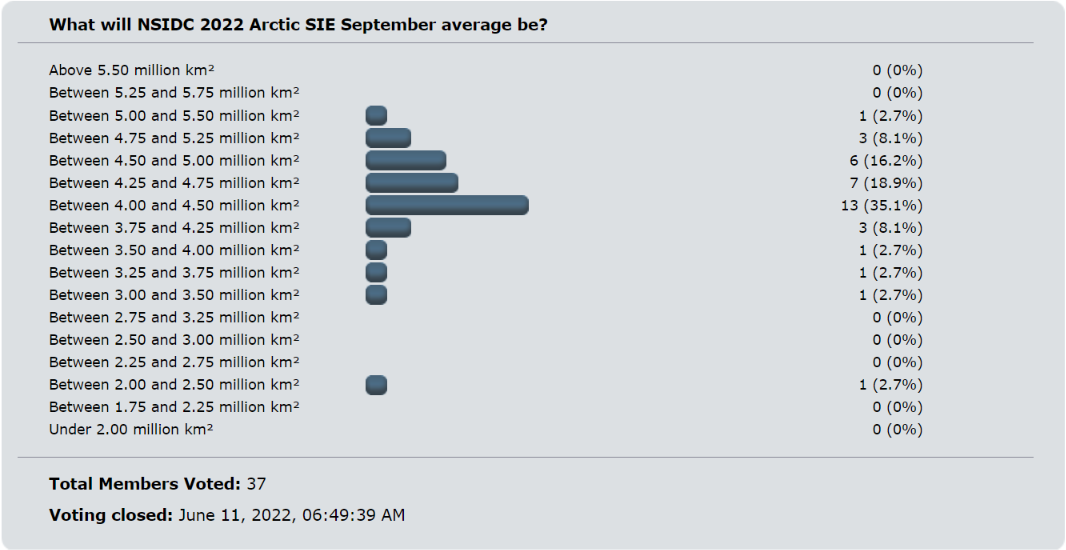
Purely coincidentally the Arctic Sea Ice Forum June poll for NSIDC average extent for September 2022 also had 37 entries. Here are the results:
Meanwhile in the actual Arctic at the end of June 2022 the low over the East Siberian Sea has found its second wind and is deepening once more:
Discussion continues on the new open thread for July 2022.
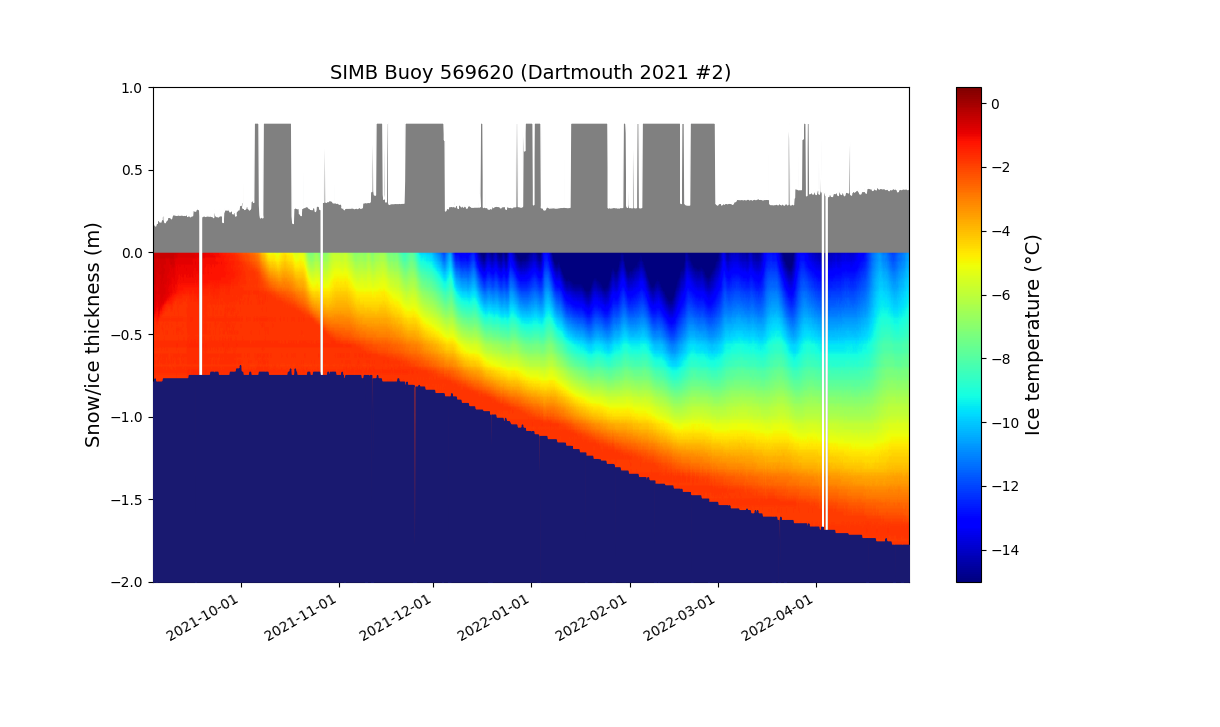
By way of a change we’ll start the month of May with a closer look at one of the ice mass balance buoys deployed in the Beaufort Sea last Autumn. IMB buoy 569620 was deployed at 78.5 N, 147.0 W on September 3rd 2021, and since then it has drifted to 81.0 N, 147.7 W. Here is the buoy’s record of atmospheric conditions above the ice floe it’s embedded in since then:
Here too is the buoy’s record of the temperature of the ice floe itself, as well as the thickness of the ice and the snow layer covering it:
There’s a few things to note at first glance. The ice floe continued to decrease in thickness into November. It’s thickness then started to increase, but is currently still less than 2 meters. Also the snow depth has gradually been increasing, and (apart from some data glitches!) is now ~38 cm. Finally, for the moment at least, the ice surface temperature has been slowly warming since mid February and is now ~-11 °C.
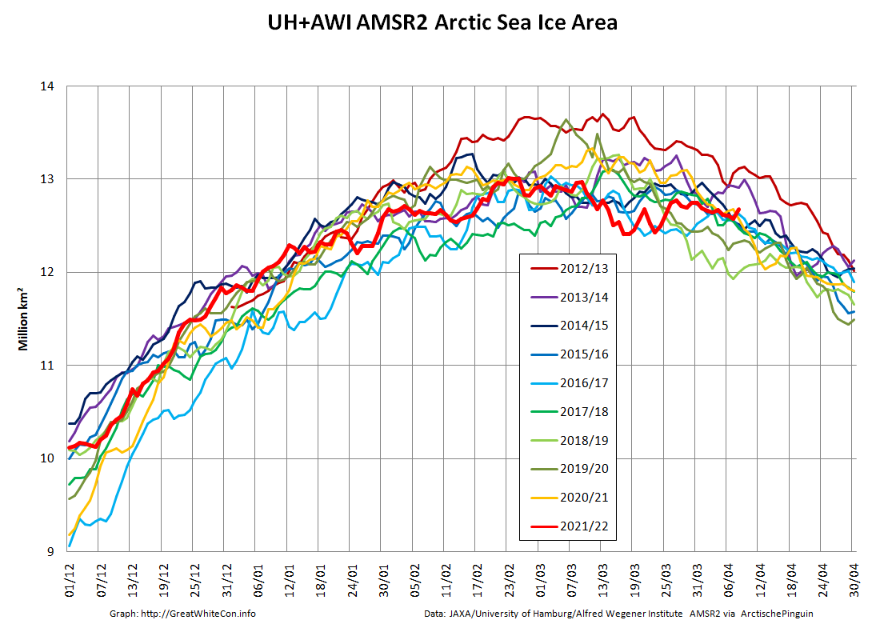
Returning to more familiar territory, high resolution AMSR2 Arctic sea ice area has taken a bit of a tumble recently:
followed less steeply by extent:
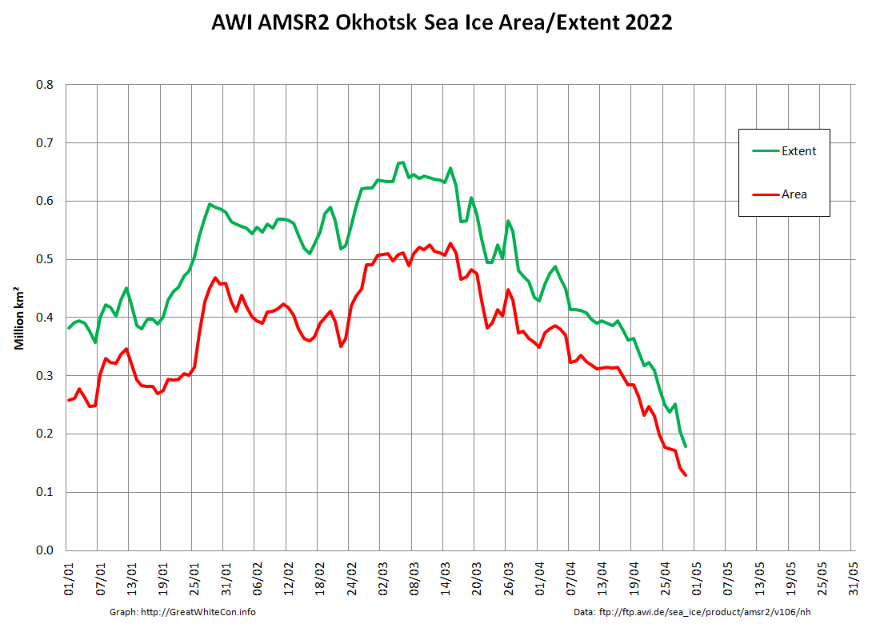
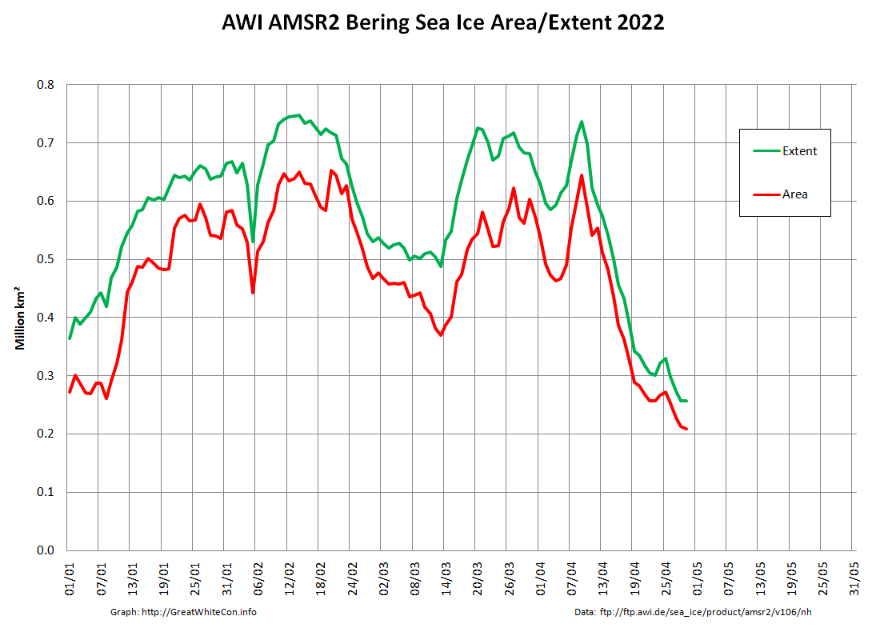
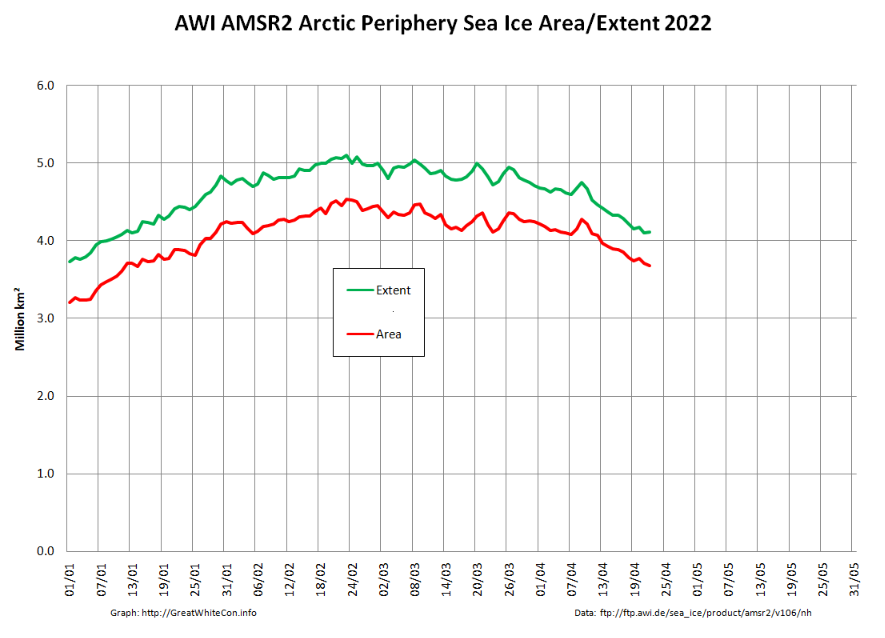
Not unexpectedly, the Pacific periphery is currently leading the decline:
[Edit – May 4th]
The Rutgers Snow Lab has updated its northern hemisphere snow cover bar chart for April 2022:
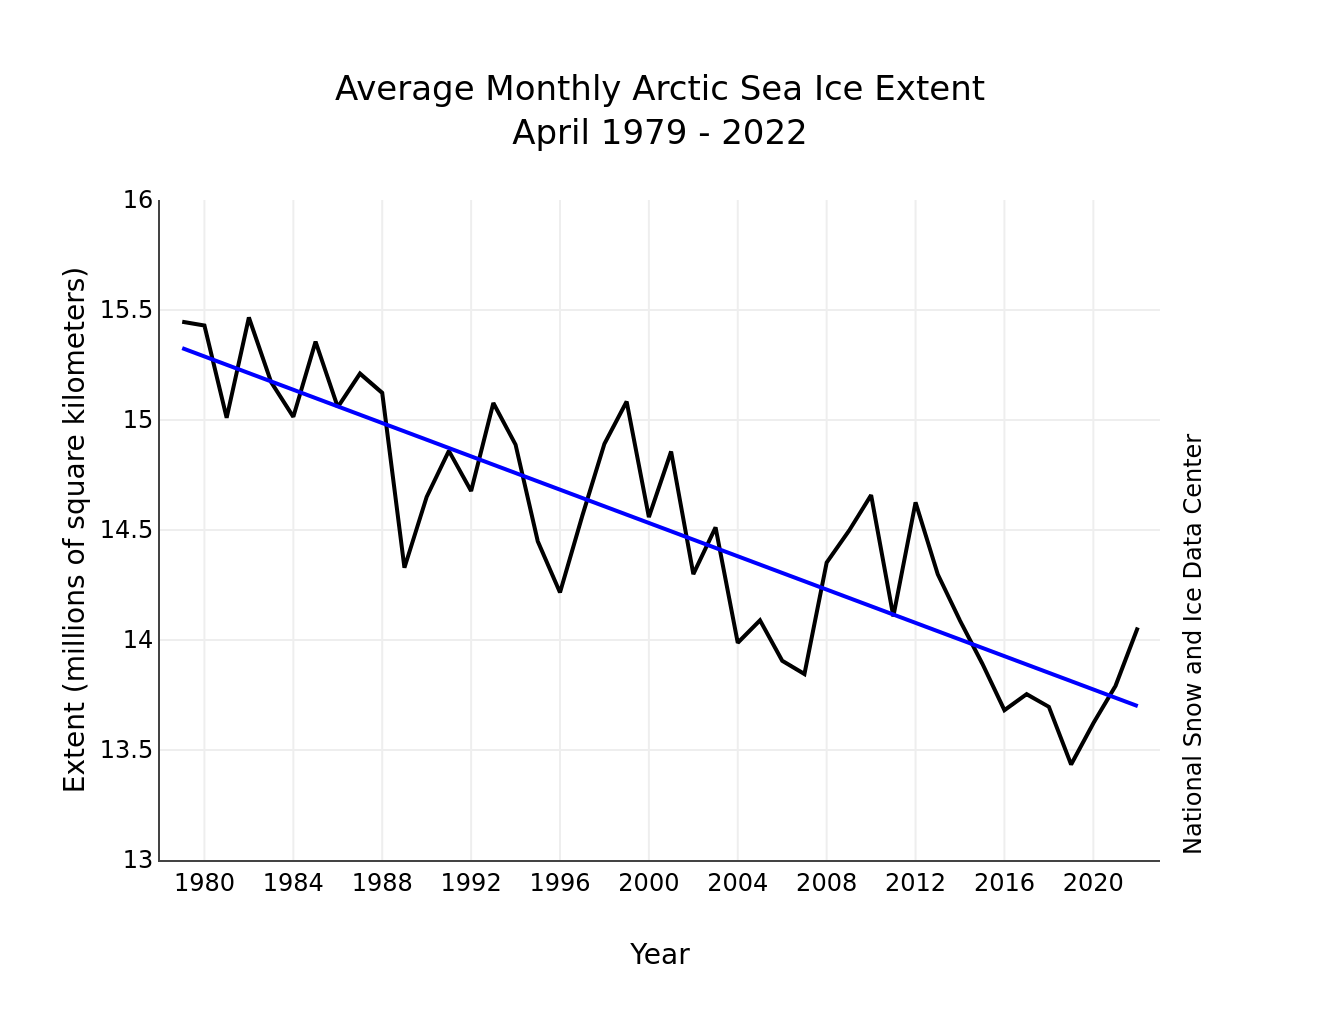
The May edition of the NSIDC’s Arctic Sea Ice News has also just been published. It summarises April 2022 as follows:
Average Arctic sea ice extent for April 2022 was 14.06 million square kilometers (5.43 million square miles). This was 630,000 square kilometers (243,000 square miles) below the 1981 to 2010 average and ranked eleventh lowest in the 44-year satellite record.
Extent declined slowly through the beginning of the month, with only 87,000 square kilometers (33,600 square miles) of ice loss between April 1 and April 10. The decline then proceeded at an average pace for this time of year through the reminder of the month.
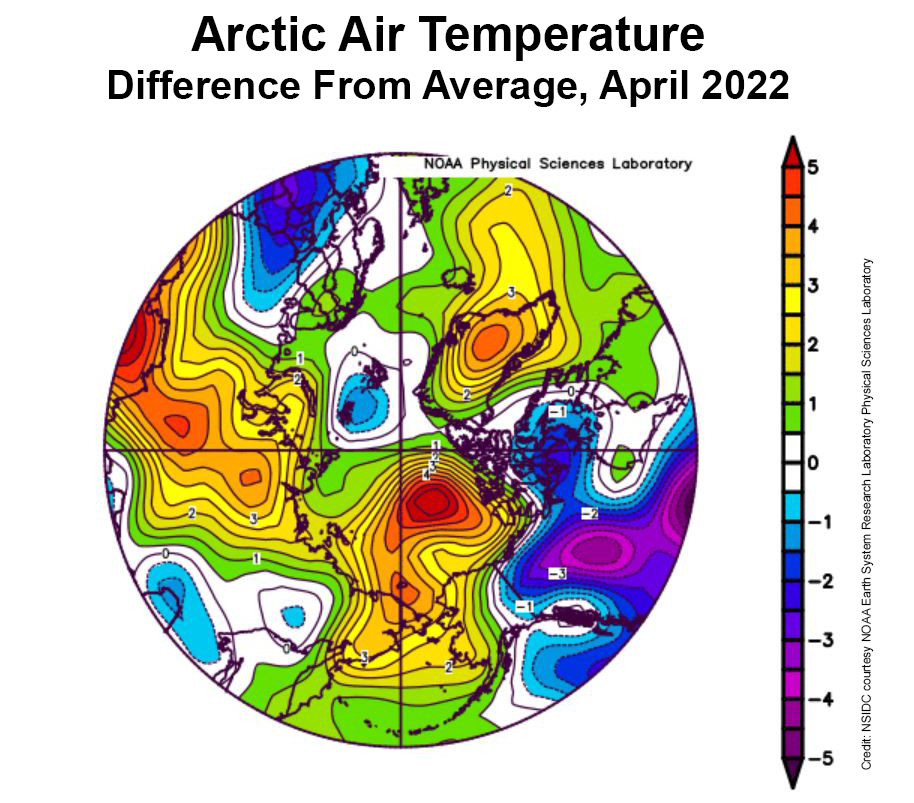
During April, temperatures at the 925 mb level (about 2,500 feet above the surface) over the Arctic Ocean were above average. Most areas were 2 to 3 degrees Celsius (4 to 5 degrees Fahrenheit) above average, but in the Beaufort Sea, April temperatures were up to 5 to 6 degrees Celsius (9 to 11 degrees Fahrenheit) above average:
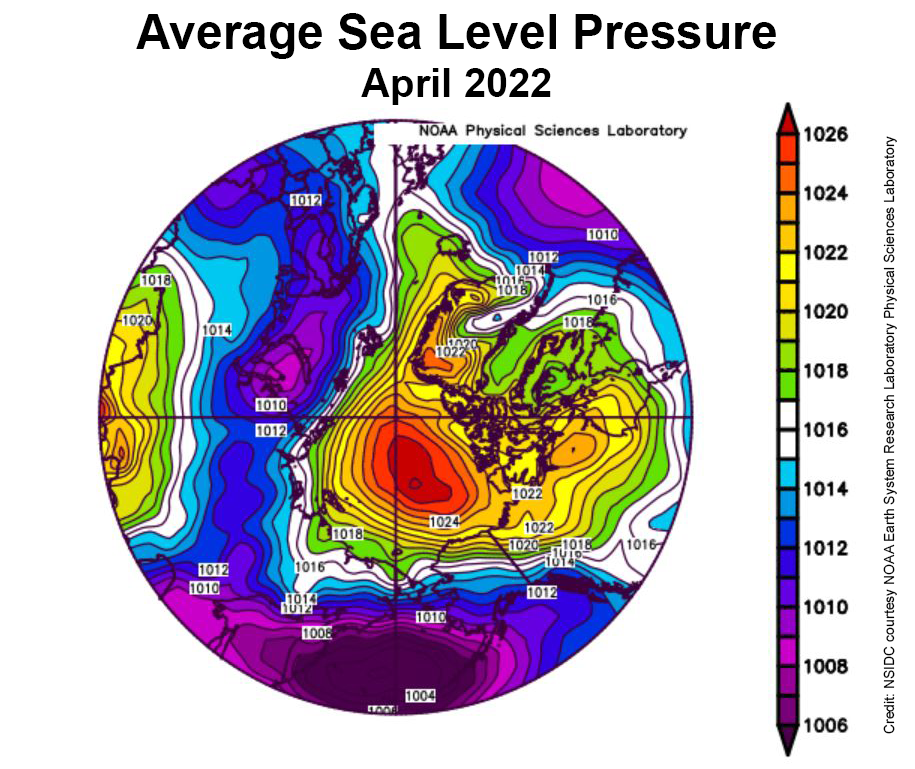
This was accompanied by a strong Beaufort High pressure cell through the month:
The NSIDC’s update also refers to the Chukchi Sea polynya we’ve been keeping an eye on here:
Strong offshore winds over the northwest coast of Alaska led to openings in the ice cover, called polynyas. The first pulse of winds began on March 21. At that time, surface air temperatures were still well below freezing, and the water in the coastal polynya quickly refroze. By April 9, the offshore push of the ice ceased and the polynya iced over completely.
However, starting on April 12, a second round of offshore wind pushed the ice away from the coast, initiating another polynya. Refreezing began anew in the open water areas, but the ice growth was noticeably slower, reflecting the higher surface air temperatures by the end of the month
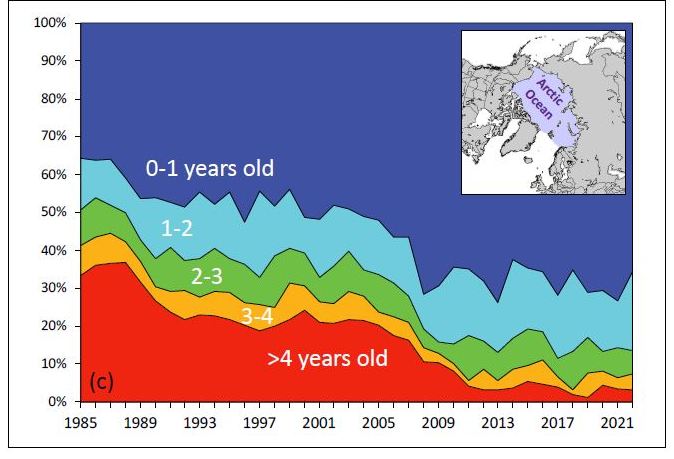
The NSIDC also updated their graph of sea ice age, on this occasion for the week of March 12th to 18th over the years:
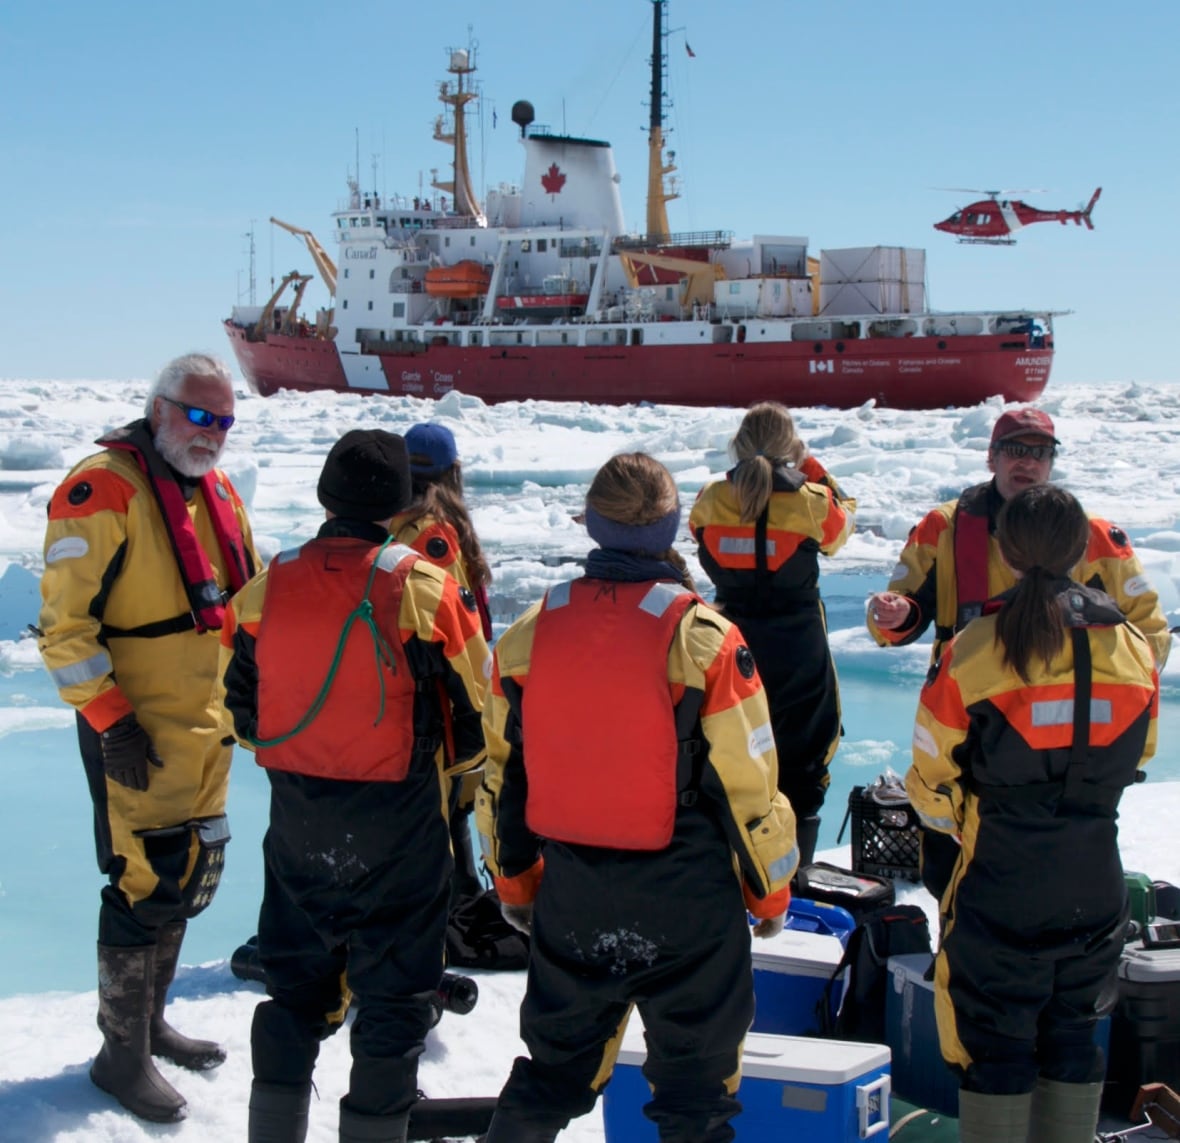
Arctic sea ice news concludes with brief news of the recent death of Canadian Arctic scientist David Barber. CBC News’s obituary for David provides more details:
Family and friends are mourning the loss of the visionary Arctic researcher and University of Manitoba professor David Barber.
Barber, who was a distinguished professor, the founding director of the Centre for Earth Observation Science and associate dean of research in the faculty of environment, earth and resource, passed away on Friday after suffering complications from cardiac arrest.
Barber, 61, is survived by his wife Lucette, three children and two grandchildren.
David Barber (left) pictured with his team on an Arctic expedition. Photo: Julien Barber[Edit – May 9th]
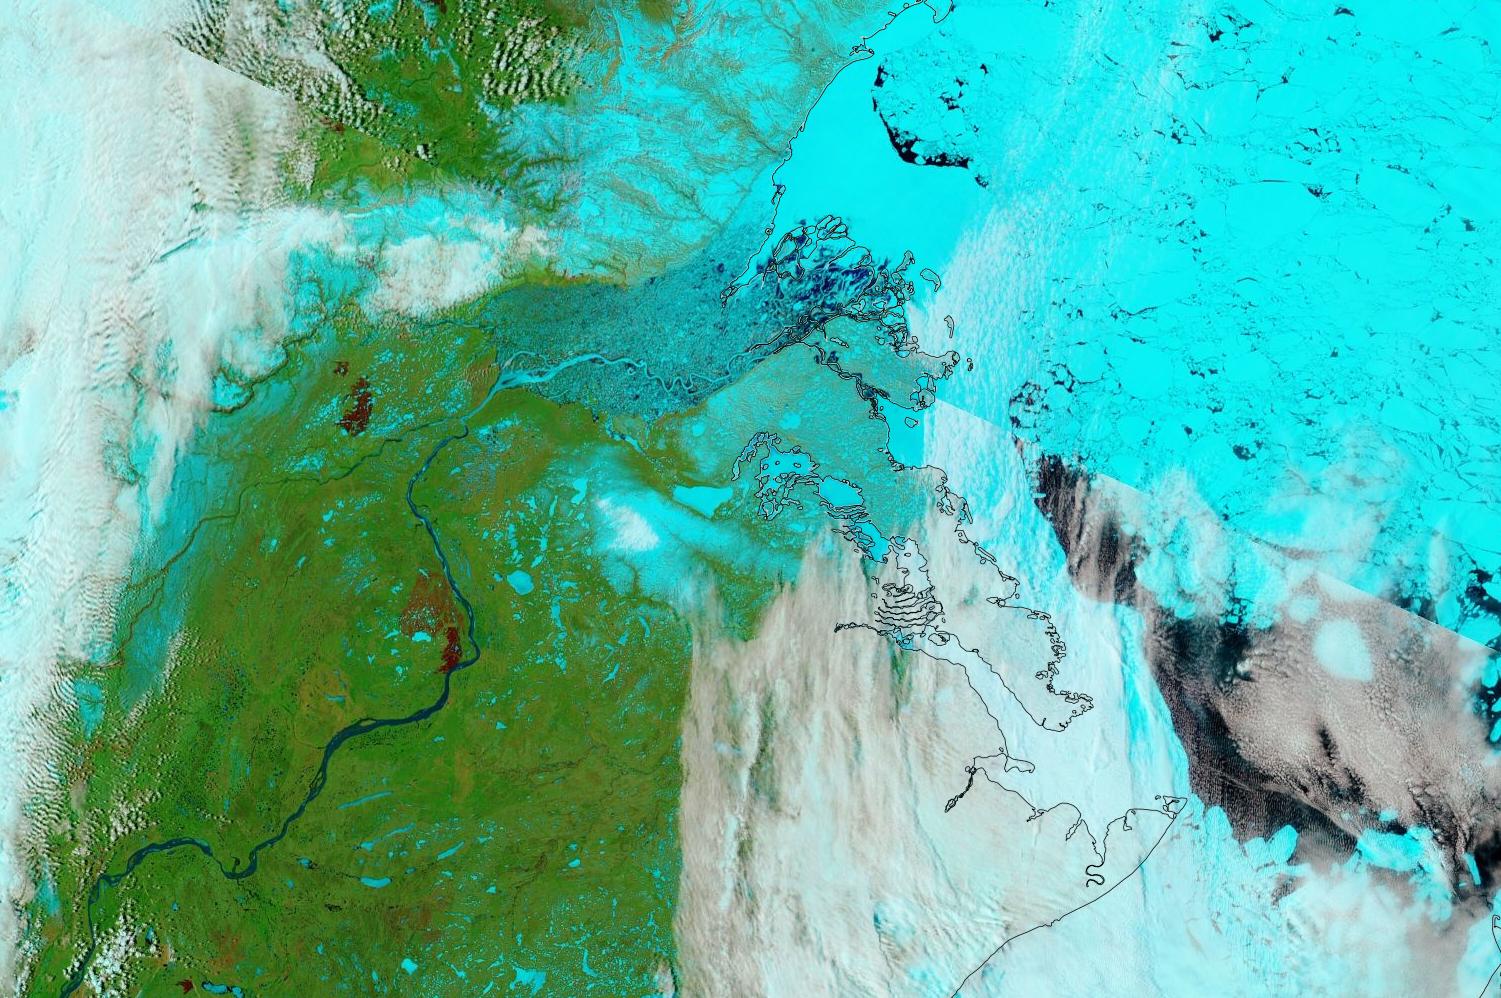
The waters of the Mackenzie River are starting to spread over the fast ice off the delta:
“False colour” image of the Beaufort Sea on May 7th from the MODIS instrument on the Terra satellite[Edit – May 11th]
The Polar Science Center at the University of Washington has released the PIOMAS volume data for April 2022:
Average Arctic sea ice volume in April 2022 was 23,000 km3. This value is the 9th lowest on record for April, about 2,300 km3 above the record set in 2017. Monthly ice volume was 30% below the maximum in 1979 and 15% below the mean value for 1979-2021. Average April 2022 ice volume was 1.45 standard deviations above the 1979-2021 trend line.
The daily volume numbers reveal the PIOMAS maximum volume for 2022 to be 23,225 km3 on April 26th.
The PSC report continues:
Ice growth anomalies for April 2022 continued to be at the upper end of the most recent decade with a mean ice thickness (above 15 cm thickness) at the middle of recent values.
The ice thickness anomaly map for April 2022 relative to 2011-2020 divides the Arctic in two halves with positive anomalies in the “Western Arctic” but negative anomalies in “Eastern Arctic”. A narrow band of negative anomalies remains along the coast of North Greenland but a positive anomaly exists north of Baffin Island.
Note that the “positive anomaly north of Baffin Island” referred to is not apparent in the CryoSat 2 ice thickness anomaly map, although there is agreement about the thicker ice in the eastern Beaufort Sea:
[Edit – May 23rd]
CryoSat-2 thickness maps stopped for the Summer in mid April. I’ve been hoping for mid May data from the PIOMAS team, but in vain so far. In its continuing absence here is a “work in progress” PIOMAS thickness map for the end of April:
The sea ice in Chaunskaya Bay and along the adjacent coast of the East Siberian Sea is starting to look distinctly damp:
“False colour” image of the East Siberian Sea on May 23rd from the MODIS instrument on the Terra satellite
That’s not too surprising when you also look at recent temperatures in Pevek, which have been approaching all time highs for the date:
P.S. The Mackenzie River has reappeared from under the clouds and is now largely liquid:
“False colour” image of the Mackenzie River and Beaufort Sea on May 23rd from the MODIS instrument on the Terra satellite[Edit – May 27th]
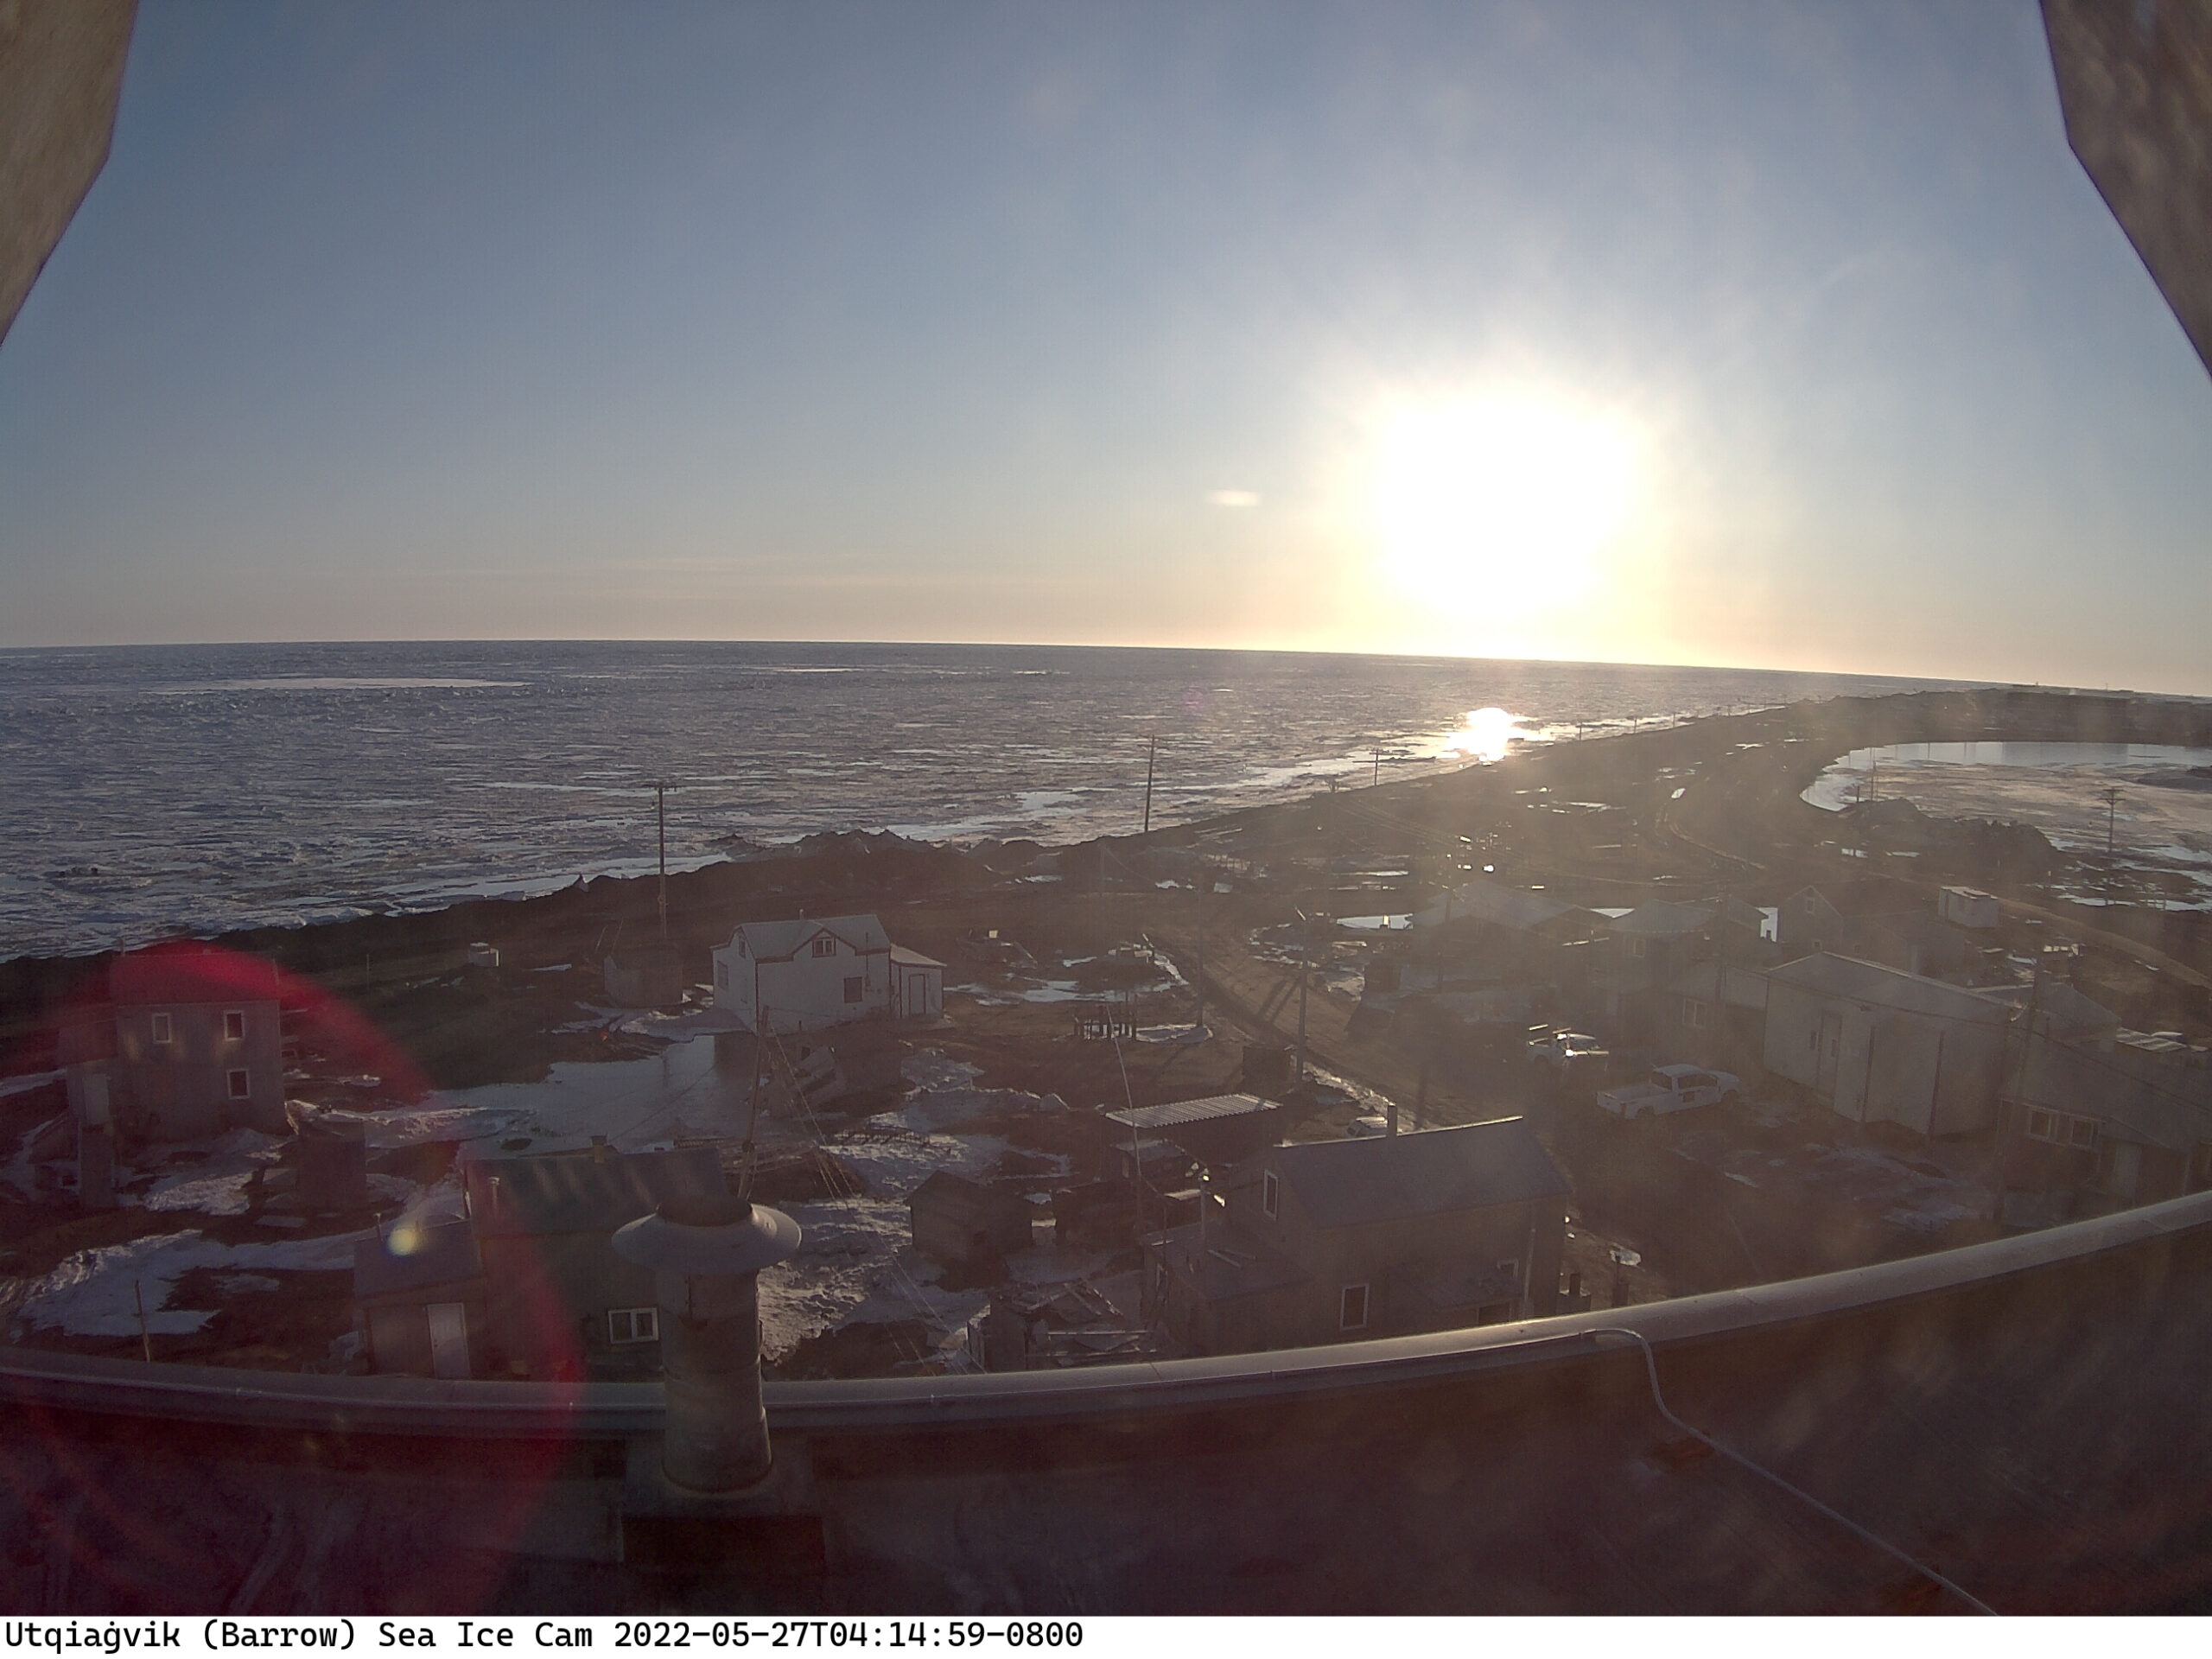
Some surface melt is now visible on the fast ice at Utqiaġvik:
No doubt the recent above zero temperatures are responsible, but the forecast is for colder conditions to return:
Discussion continues on the new open thread for June 2022.
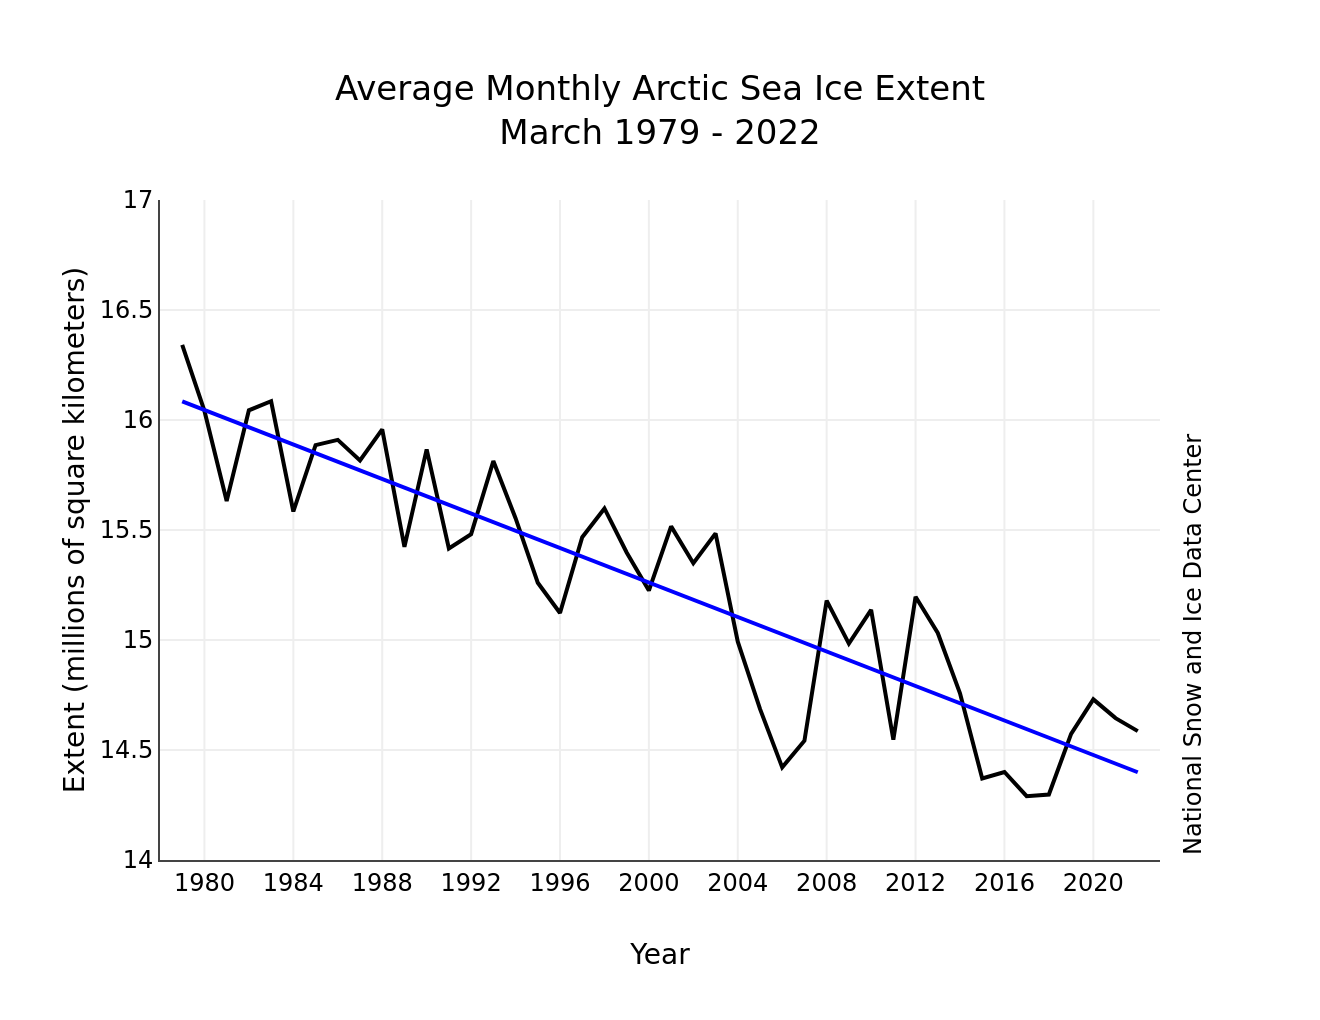
The April edition of the NSIDC’s Arctic Sea Ice News summarises March 2022 as follows:
Average Arctic sea ice extent for March 2022 was 14.59 million square kilometers (5.63 million square miles), ranking ninth lowest in the satellite record…
The total decline, after a series of small ups and downs, was only 250,000 square kilometers (96,500 square miles):
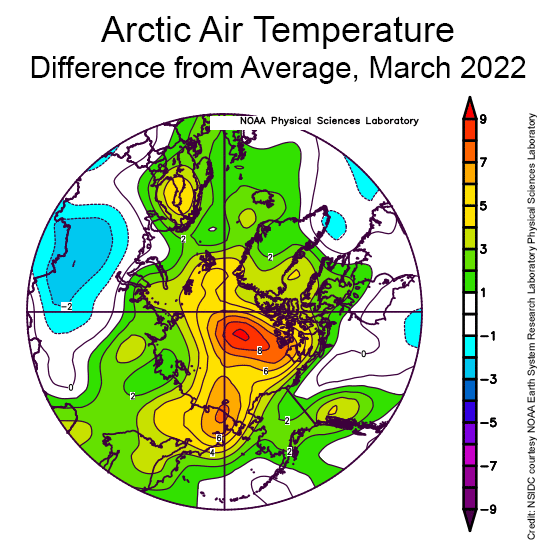
Counter to what might be expected given the very slow rate of sea ice loss over the month as a whole, air temperatures at the 925 millibar level (about 2,500 feet above the surface) were above average over all of the Arctic Ocean:
March temperatures were up to 9 degrees Celsius (16 degrees Fahrenheit) higher than average north of the Canadian Arctic Archipelago, up to 6 degrees Celsius (11 degrees Fahrenheit) above average in the East Siberian Sea, but up to 5 degrees Celsius (9 degrees Fahrenheit) above average over a wide area.
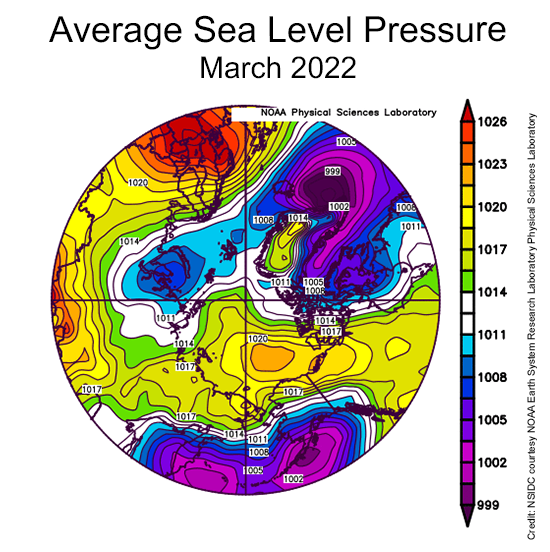
The key features of the sea level pressure pattern were high pressure (an anticyclone) over the central Arctic Ocean, a trough of low pressure extending into the Barents Sea, and an unusually high pressure over Northern Europe:
While having an anticyclone over the central Arctic Ocean is quite typical for this time of year, the combination of the high pressure over northern Europe and the pressure trough to the west led to a strong pressure gradient, leading to strong winds from south through the Norwegian and Barents Seas…
This can be tied to the extreme warm event over the Arctic Ocean seen in the middle of the month, associated with strong water vapor transport and the passage of several strong cyclones.
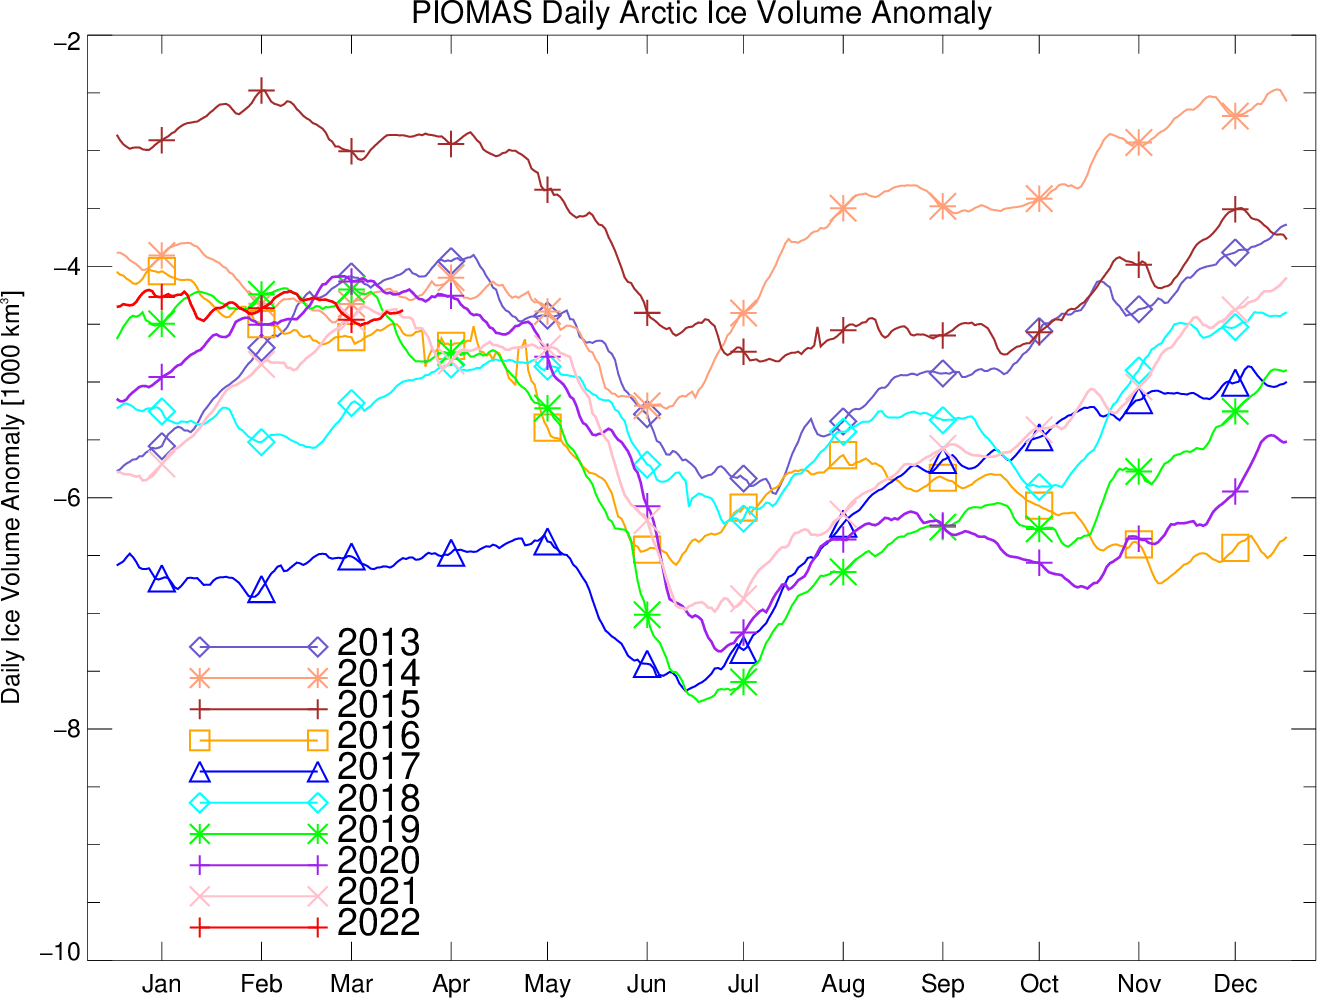
The Polar Science Center at the University of Washington has also released the PIOMAS volume data for March 2022:
Average Arctic sea ice volume in March 2022 was 21,700 km3. This value is the 6th lowest on record for March, about 2,200 km3 above the record set in 2017. Monthly ice volume was 38% below the maximum in 1979 and 25% below the mean value for 1979-2021:
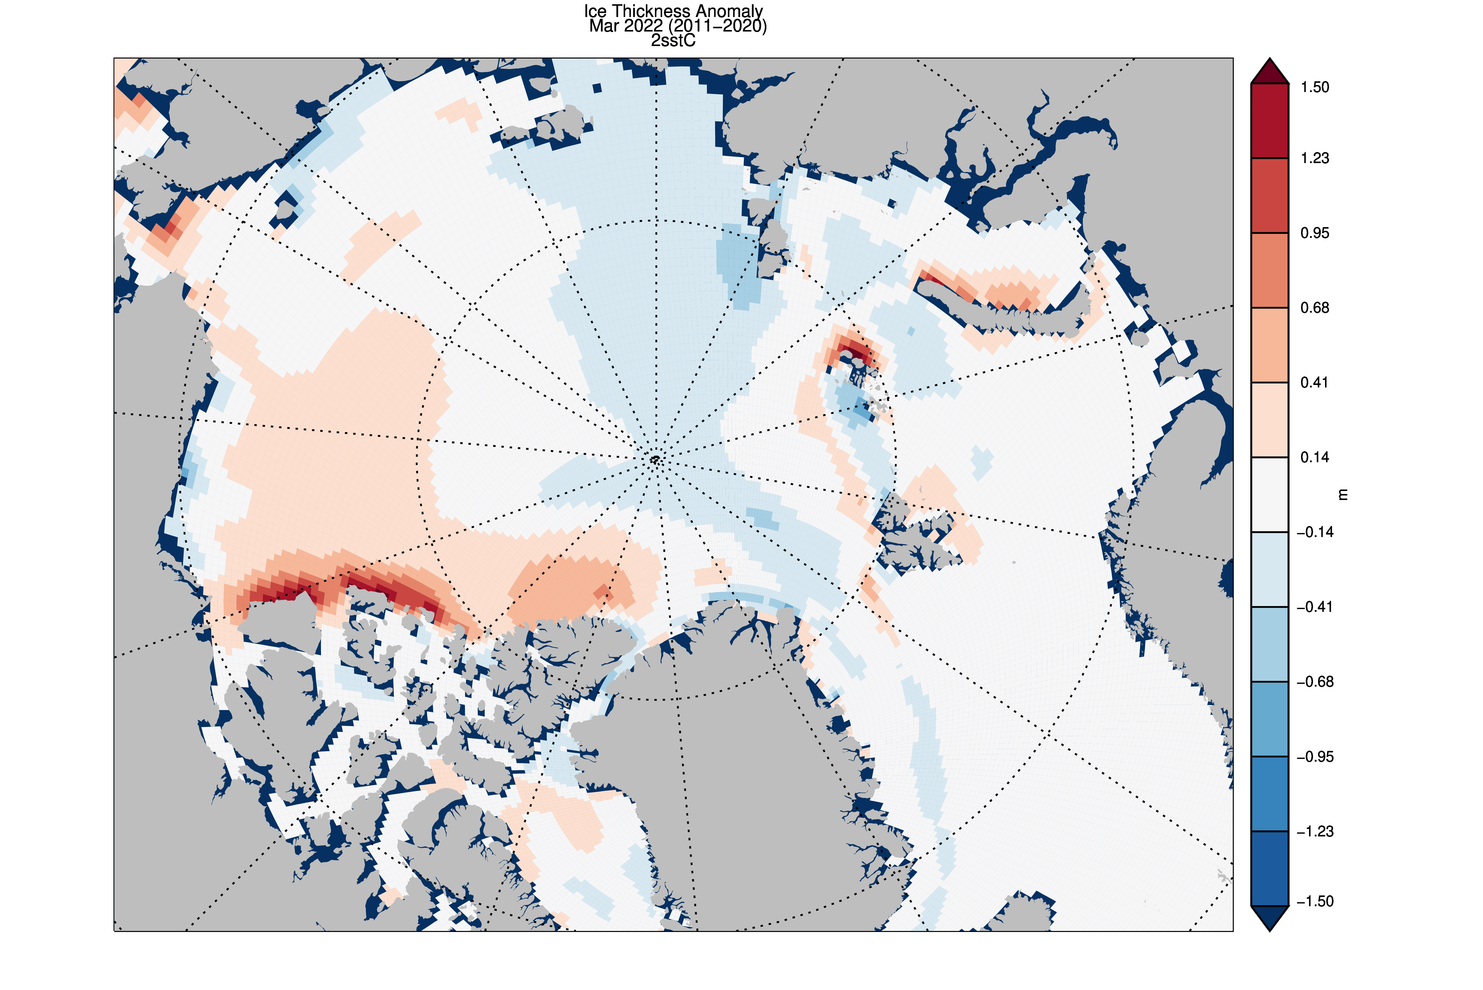
Ice growth anomalies for March 2022 continued to be at the upper end of the most recent decade with a mean ice thickness (above 15 cm thickness) at the middle of recent values:
The ice thickness anomaly map for March 2022 relative to 2011-2020 divides the Arctic in two halves with positive anomalies in the “Western Arctic” but negative anomalies in “Eastern Arctic”. A narrow band of negative anomalies remains along the coast of North of Greenland but positive anomaly exists north of Baffin Island.
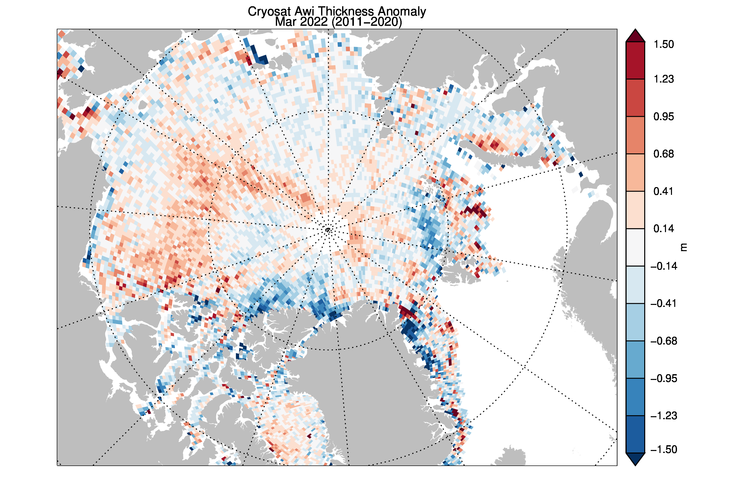
CryoSat 2 ice thickness shows an similar pattern of sea ice thickness anomalies though the areas North of Greenland and Baffin Bay show substantial differences:
[Edit – April 10th]
Here are the latest graphs of our favourite “high resolution” AMSR2 metrics, which combine recent data from the Alfred Wegener Institute with historical data from the University of Hamburg:
As you can see, there have indeed been a few ups and downs! Click the image below to see a 10 Mb animation of ice motion over the last few weeks:
The obvious point to note at the moment is that there are currently long flaw leads on both the Siberian and Canadian sides of the Arctic Ocean. The animation also reveals episodes of open water in the Beaufort and Chukchi Seas, as well as north of Franz Josef Land and Svalbard.
The ice in those areas is still very thin on the latest AWI CryoSat-2/SMOS sea ice thickness map:
[Edit – April 11th]
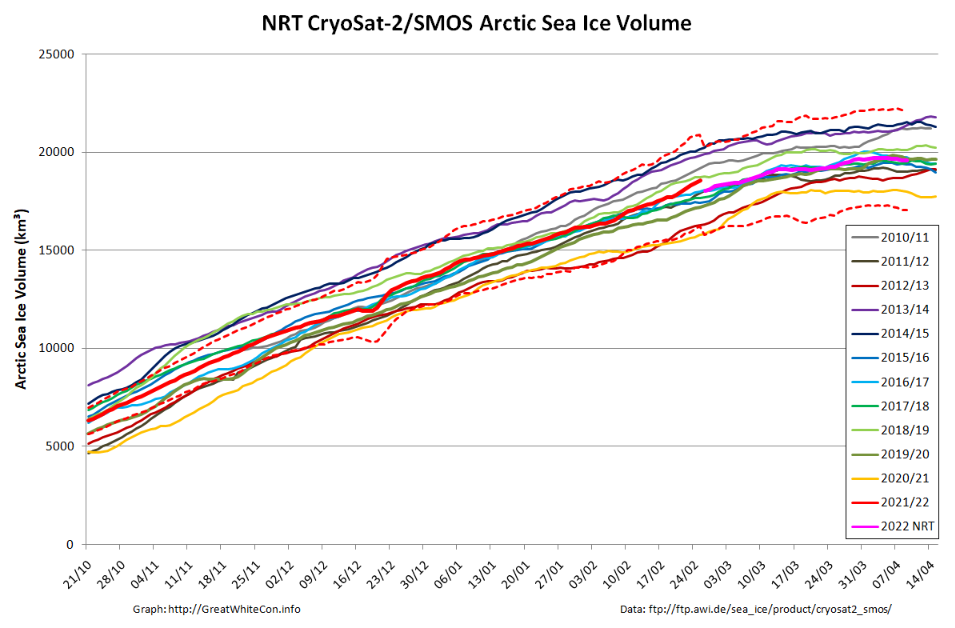
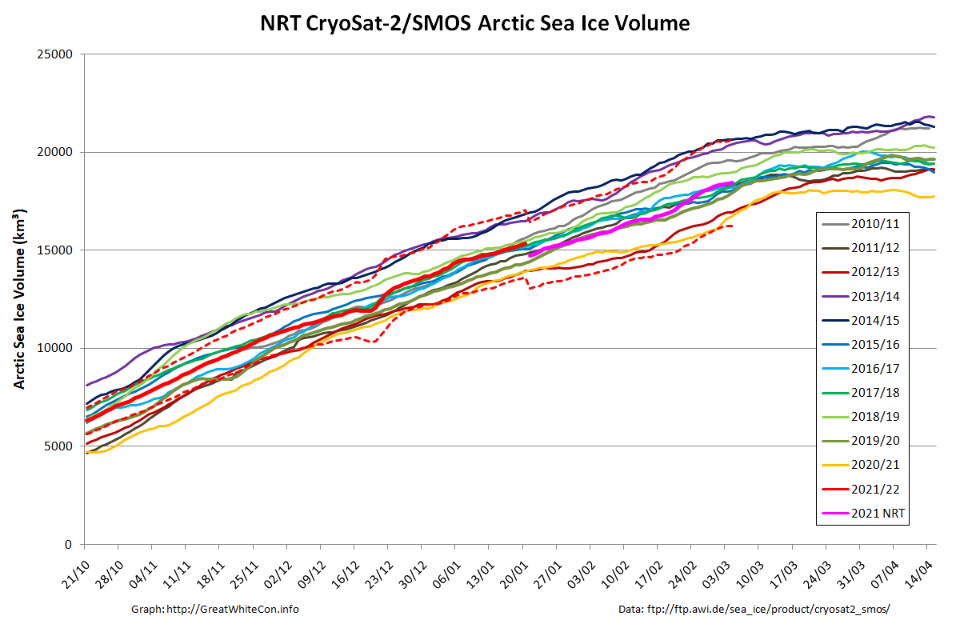
Here too is the latest AWI CryoSat-2/SMOS volume graph:
The reanalysed data is now showing something of a surge towards the end of February.
[Edit – April 23rd]
Here’s the last “near real time” AWI CryoSat-2/SMOS Arctic sea ice thickness map for Spring 2022:
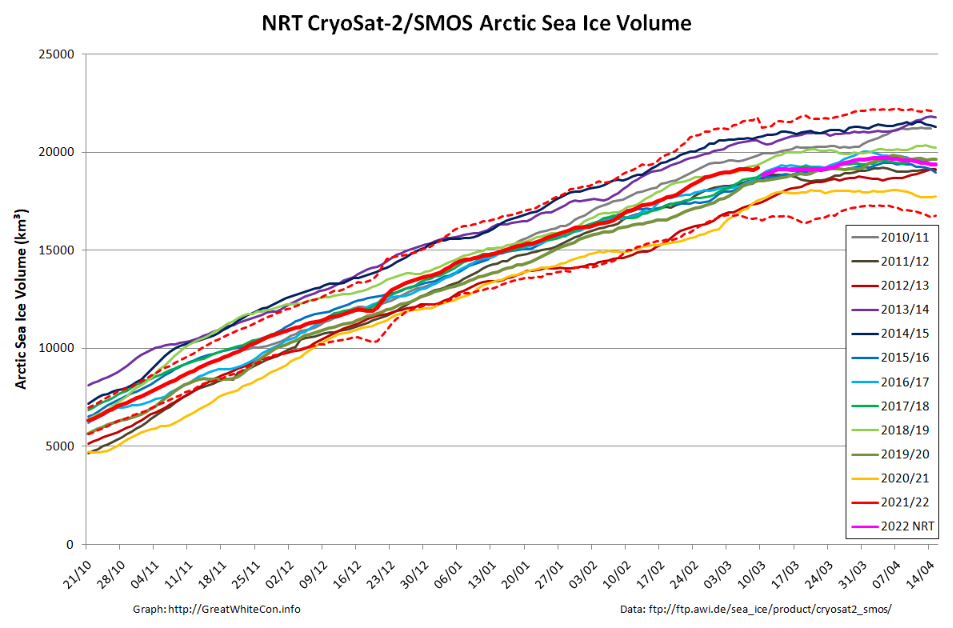
The significantly thinner areas in the Beaufort and Chukchi Seas are even more pronounced than previously. Here also is the associated CS2/SMOS volume graph:
The 2022 maximum volume based on NRT data is 19719 km³ on April 5th. Expect that to be revised upwards when the reanalysed data is ultimately published.
Going back to 2 dimensions, the assorted “ups and downs” now seem to have resolved into the melting season proper:
The peripheral sea have been responsible for most of the recent decline:
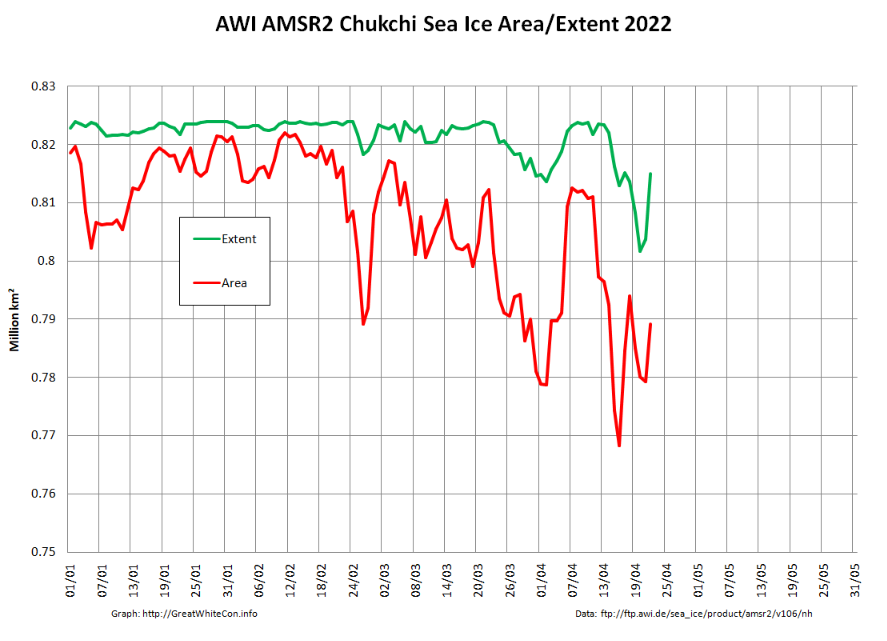
However as mentioned above, the Chukchi Sea has been experiencing some ups and downs of its own. Perhaps the sun is now high enough in the sky for the most recent “down” to stick around for the summer?
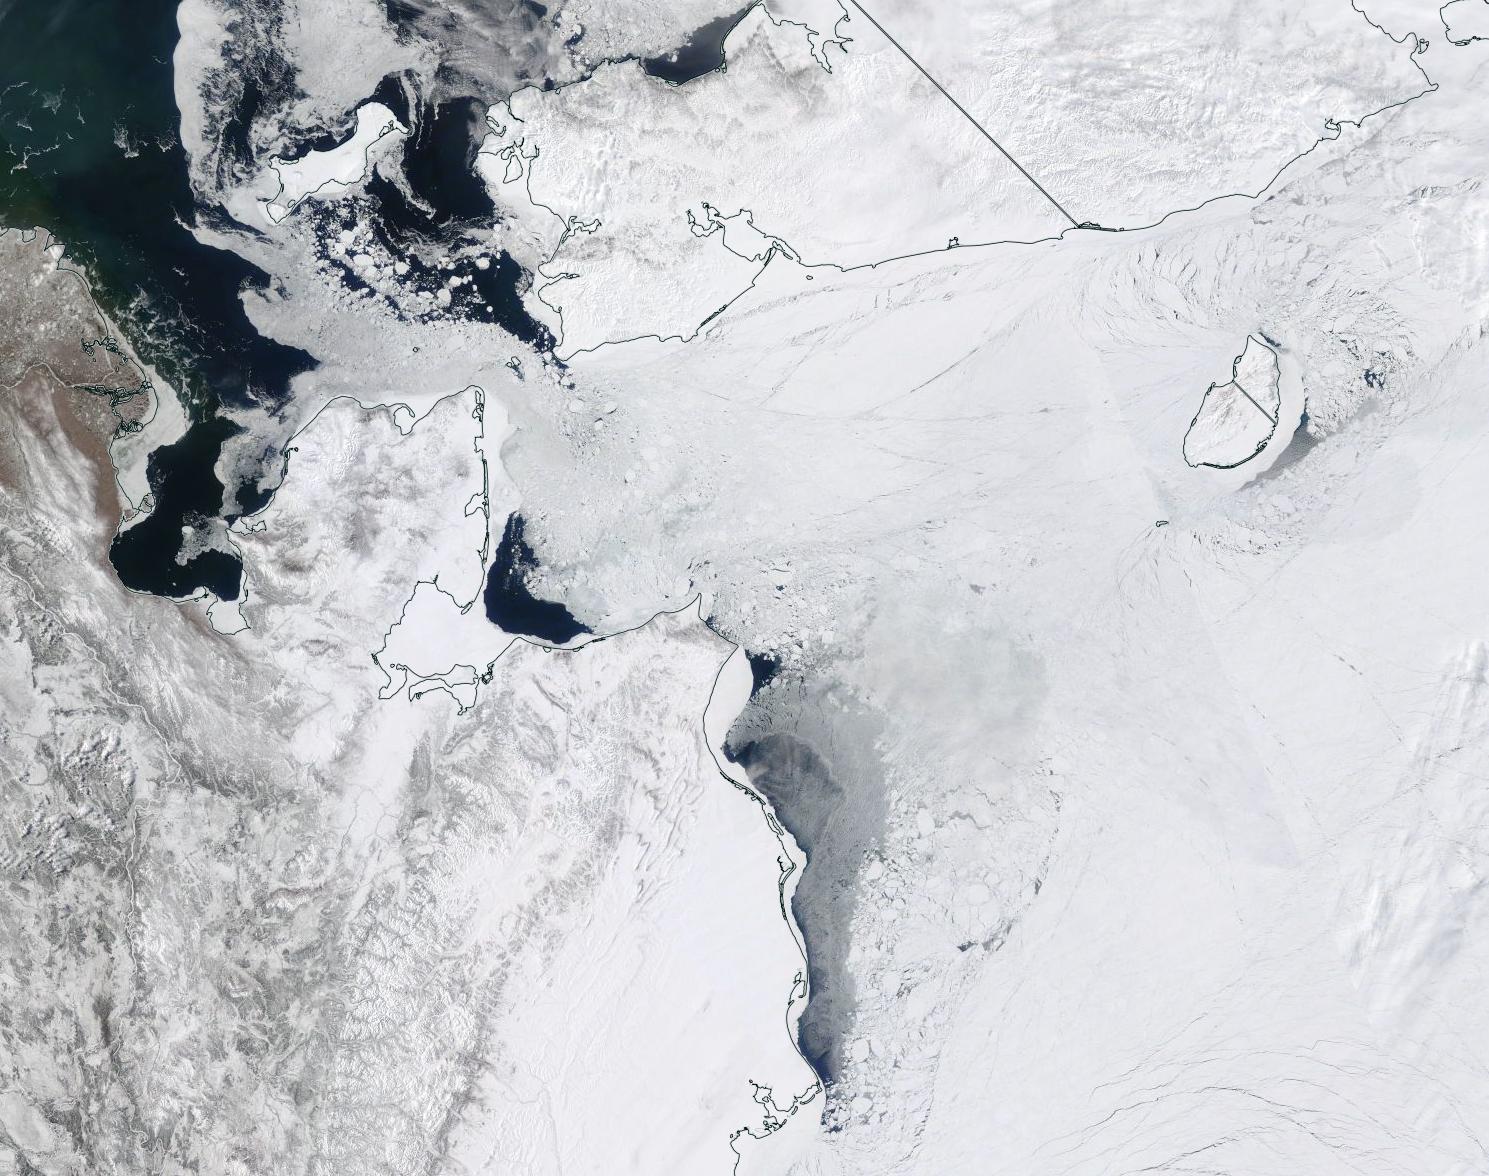
“True colour” image of the Chukchi Sea on April 21st from the MODIS instrument on the Terra satellite[Edit – April 24th]
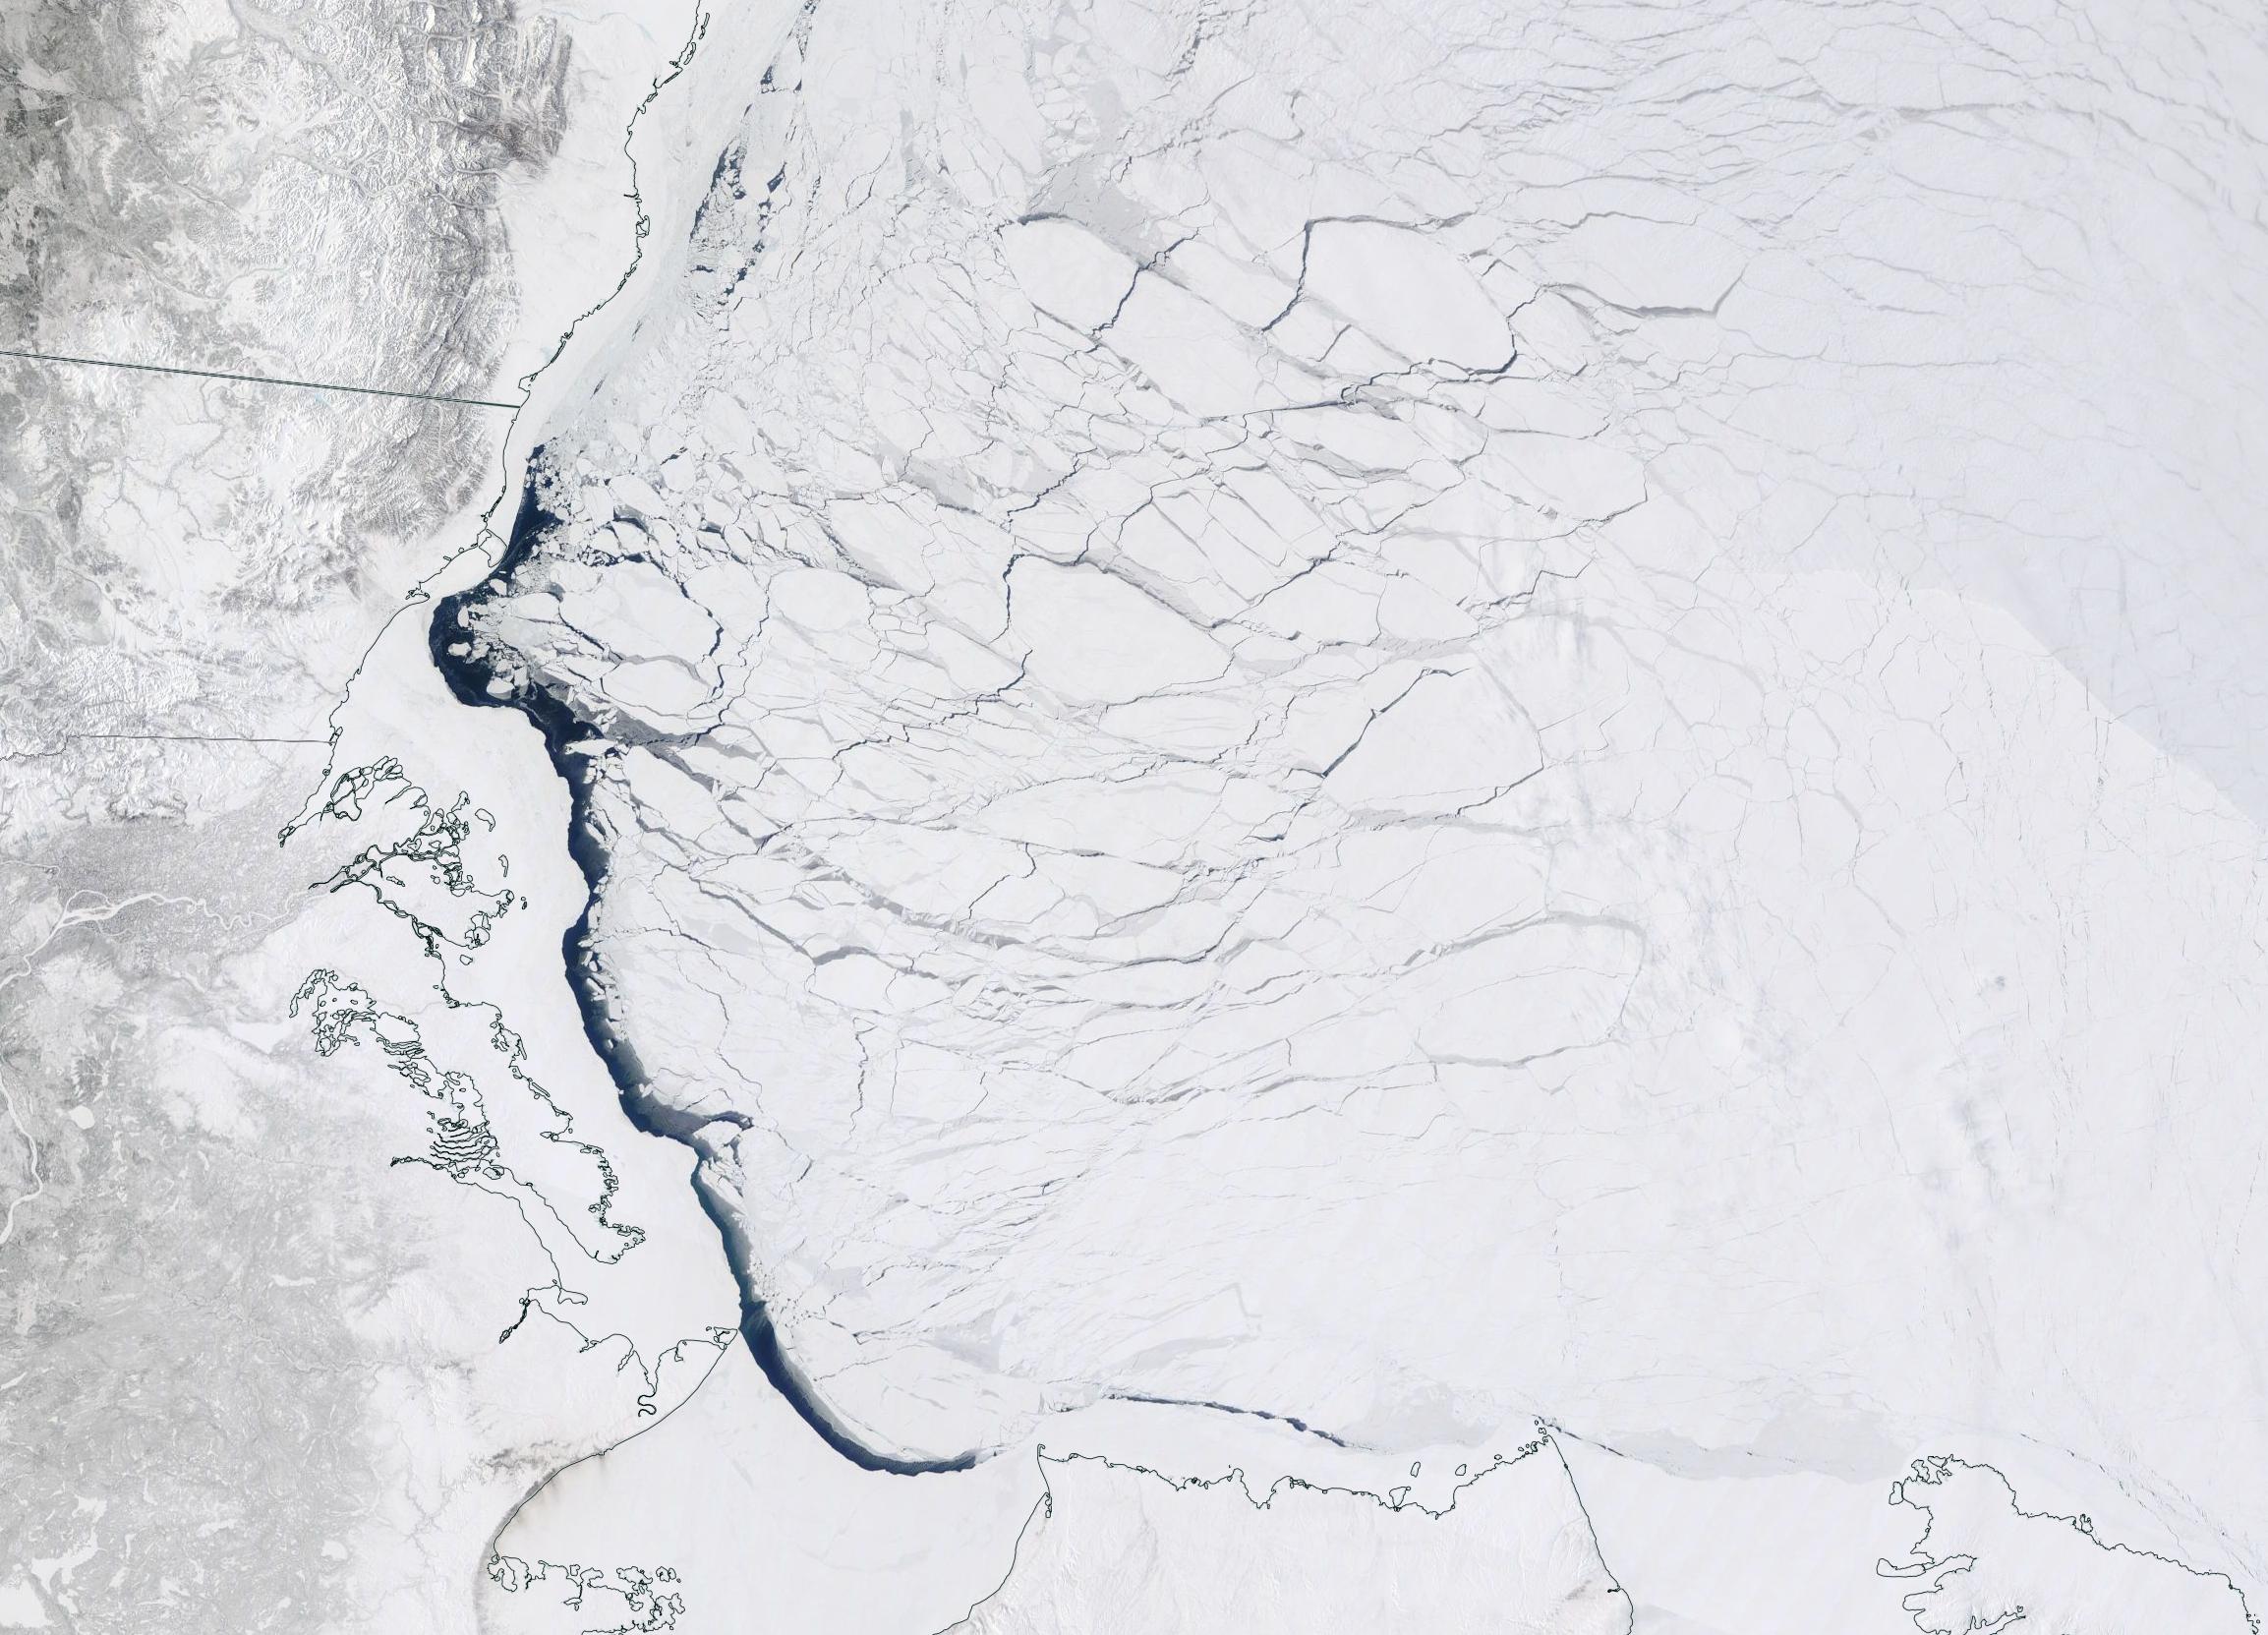
Over the last couple of days some open water has appeared in the Beaufort Sea off the Mackenzie Delta:
“True colour” image of the Beaufort Sea on April 23rd from the MODIS instrument on the Terra satellite [Edit – April 25th]
Especially for Taylor, here’s the GFS Arctic snow depth forecast for 10 days into the future:
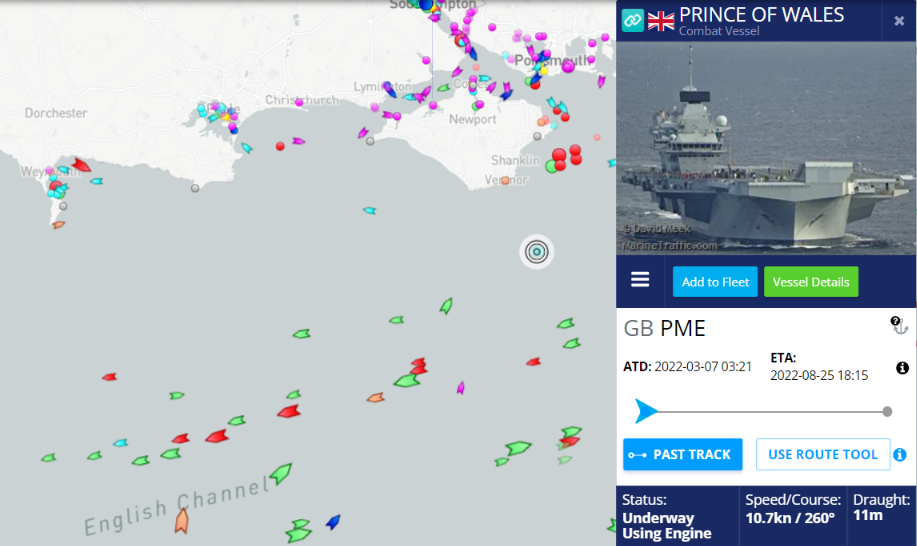
In a press release earlier today the Royal Navy announced that:
The UK’s largest warship has left Portsmouth to lead a NATO task force to the Arctic for the biggest exercises in Norway for 30 years.
Aircraft carrier HMS Prince of Wales deploys in her role as NATO’s command ship to Exercise Cold Response, the large-scale Norwegian-led exercises which will see 35,000 troops from 28 nations operate together in the harshest environment.
Prince of Wales is responsible for leading NATO’s Maritime High Readiness Force – an international task group formed to deal with major global events – and deploys for the first time in that role to Cold Response.
Aboard the carrier are the most senior sea-going staff in the Royal Navy – Commander UK Strike Force, headed by Rear Admiral Mike Utley, who will lead a sizeable task force as part of a galvanized NATO effort for peace and stability in Europe.
Rear Admiral Utley said: “NATO is the cornerstone of the UK defence and our commitment to the alliance is absolute.
“It is a privilege to be the UK Maritime Component Commander as we participate in this Norwegian-led exercise.”
Prince of Wales will be at the head of a powerful maritime task force, which, alongside aircraft and land forces – including Royal Marines Commandos – will show how a unified multilateral force would defend Norway and Europe’s northern flank from a modern adversary.
Around the aircraft carrier will be a protective ring of steel made up of warships, aircraft, a nuclear-powered attack submarine and a Royal Fleet Auxiliary replenishment vessel. Together they will defend Prince of Wales against threats above, below and on the waves throughout her high north deployment.
It will be the first time one of the Royal Navy’s new Queen Elizabeth-class carriers has operated in the Arctic and it is a challenge the ship’s company is relishing.
As of 4 March 2022, a total of 27 nations and some 30,000 soldiers are signed up for Cold Response. These numbers are likely to change as we get closer to the exercise.
The 30,000 participants consist of: • 14,000 land forces • 8,000 naval forces • 8,000 air forces and staff
About 220 aircraft and more than 50 vessels will take part in the exercise.
In addition to military units from NATO, partner nations and the Norwegian Armed Forces, a number of Norwegian civilian agencies and organisations will also take part. In addition to this, 39 Norwegian municipalities are involved in the exercise.
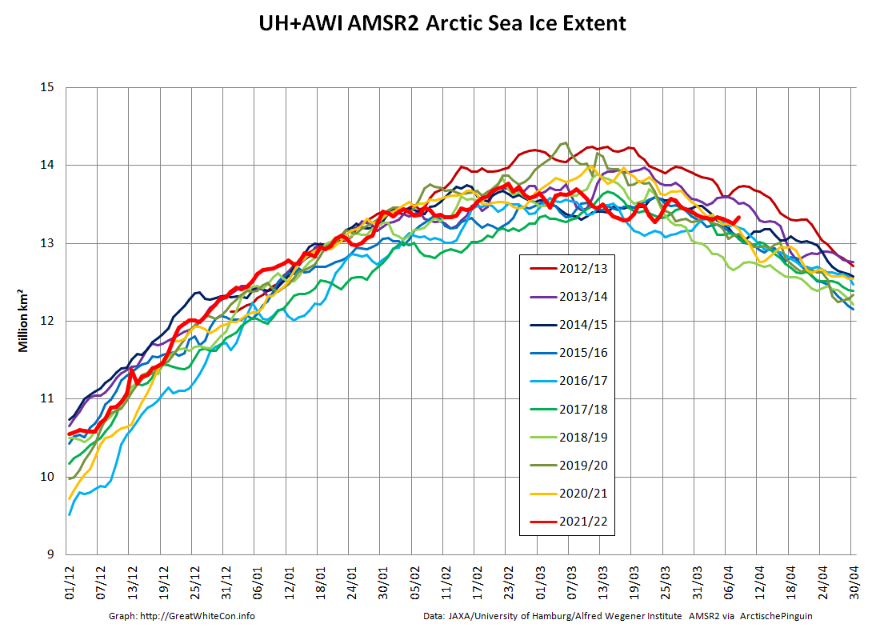
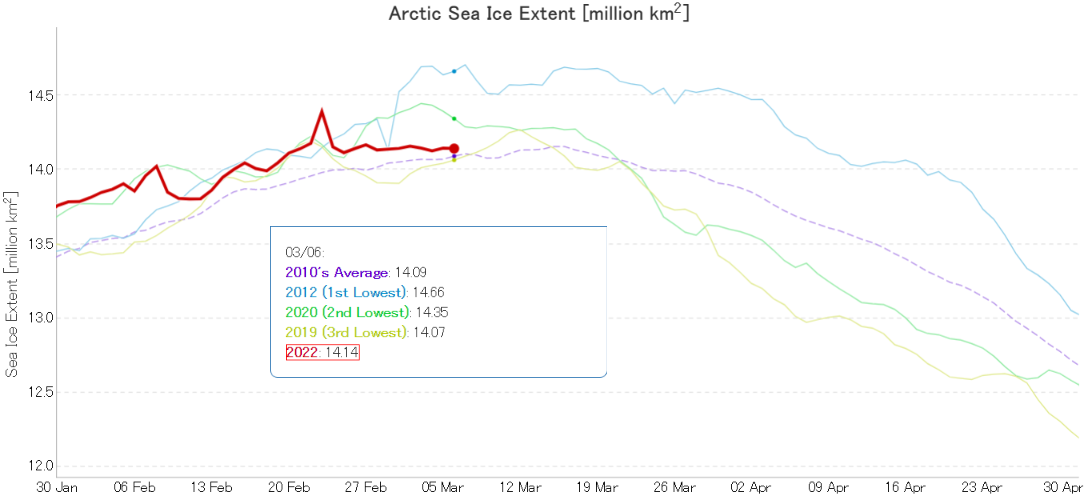
For detailed analysis of Arctic sea ice extent over the next few weeks please see the 2022 maximum extent thread. However to get the new open thread going here is the current JAXA/ViSHOP extent graph:
It’s looking more and more as though the real maximum for 2022 occurred close the false peak on February 23rd.
Arctic sea ice volume will keep increasing for a while longer. Here is the current AWI CryoSat-2/SMOS volume graph:
The recent “flat line” in extent is in part due to recent events on the Pacific periphery of the Arctic. Take a look at this animation of AMSR2 sea ice concentration:
The gap varies depending on how the wind blows, but there is still evidence of open water (or very thin ice) along the shore of the Beaufort and Chukchi Seas. Here’s the Mackenzie Delta and the adjacent Beaufort Sea on March 5th:
This website uses cookies to improve your experience. We'll assume you're ok with this, but you can opt-out if you wish. Cookie settingsACCEPT
Privacy & Cookies Policy
Privacy Overview
This website uses cookies to improve your experience while you navigate through the website. Out of these, the cookies that are categorized as necessary are stored on your browser as they are essential for the working of basic functionalities of the website. We also use third-party cookies that help us analyze and understand how you use this website. These cookies will be stored in your browser only with your consent. You also have the option to opt-out of these cookies. But opting out of some of these cookies may affect your browsing experience.
Necessary cookies are absolutely essential for the website to function properly. This category only includes cookies that ensures basic functionalities and security features of the website. These cookies do not store any personal information.
Any cookies that may not be particularly necessary for the website to function and is used specifically to collect user personal data via analytics, ads, other embedded contents are termed as non-necessary cookies. It is mandatory to procure user consent prior to running these cookies on your website.