We’ve now entered the month of September, the month in which Arctic sea ice extent and area reach their annual minimum levels, historically at least. To set the scene, here’s the extent graph from the Japan Aerospace Exploration Agency (JAXA) for September 1st, based on data from the AMSR2 sensor on board their SHIZUKU satellite.:
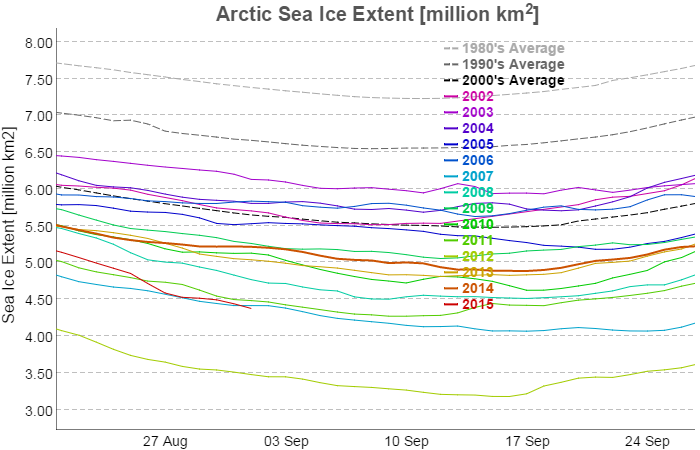
As you can see, the 2015 curve has just dropped below 2007 and is now at the second lowest level for the date in JAXA’s records. As the month progresses we’ll be taking a look at a variety of other metrics as they start to report their numbers for September.
To set the scene, here’s the University of Hamburg’s map of Arctic sea ice concentration for September 1st, again based on AMSR2 data:
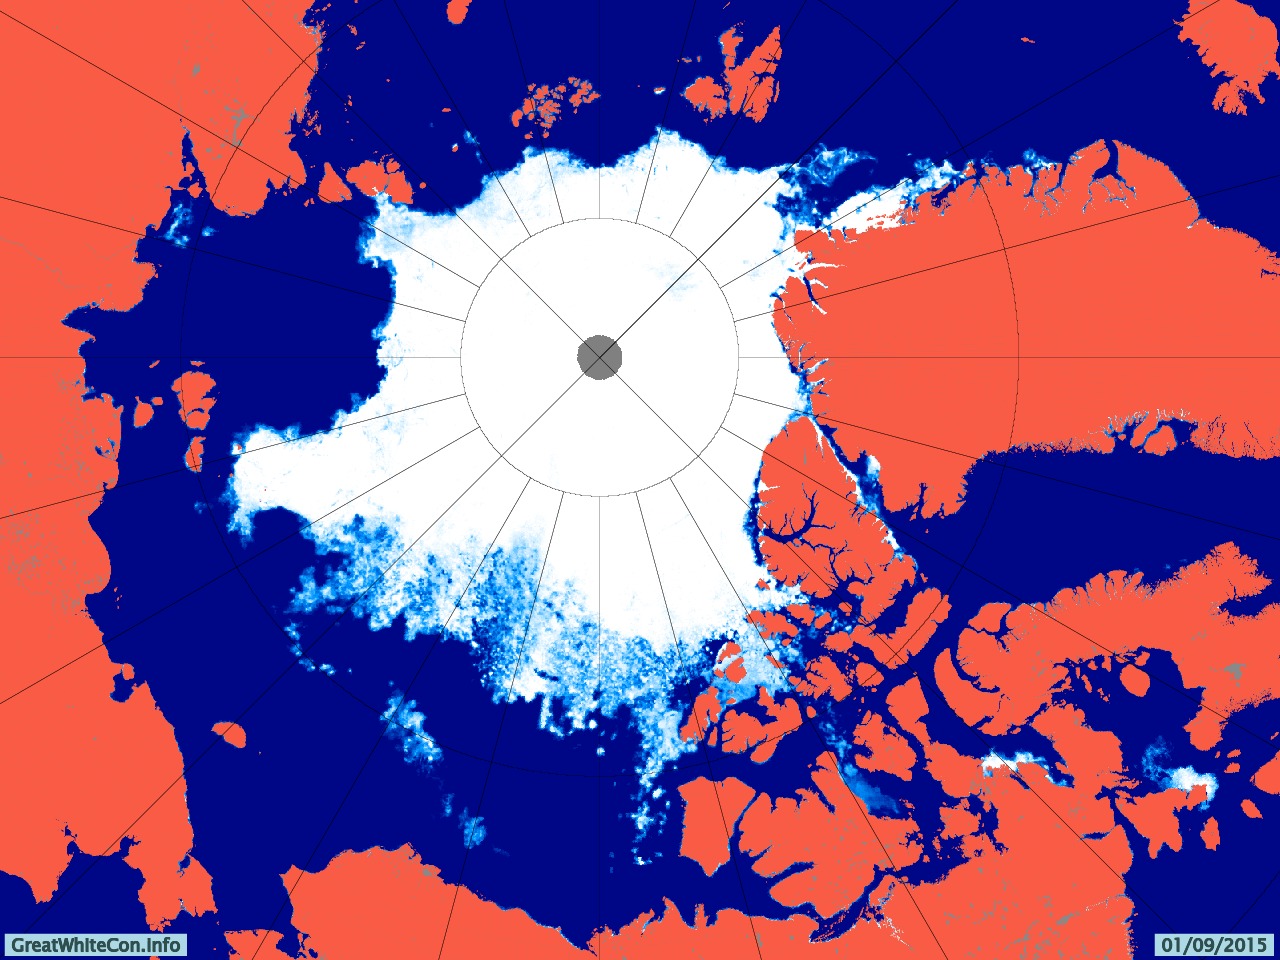
Here’s a video showing how that map has changed over the last two months:
Notice in particular the effect of the recent Arctic cyclone on the sea ice in the lower left quadrant. Note also our comment that:
[There is] a large potential fetch across the East Siberian, Chukchi and Beaufort Seas should any further cyclones occur in the area over the next few weeks. The conditions now exist for an even more damaging swell to be generated before the 2015 minimum Arctic sea ice extent is reached.
By now you may be wondering if we have a prediction to make? Well, we predict it still all depends on the weather! However here’s how the “probabilistic” 50 day ahead prediction from Andrew Slater of the NSIDC looks at the moment: 
If I were a betting man I’d say that the red line will ultimately put in a lower low than the dark blue one.
Finally, for the moment at least, take a look at the GFS surface level pressure forecast for later today, courtesy of MeteoCiel:

Can you see the 1000 hPa central pressure low spinning over the Laptev Sea? It’s currently not very deep, and it’s not over the East Siberian Sea either, but watch that space along with us as we wait to discover where and when the assorted Arctic sea ice metrics reach their minima for 2015.
[Edit – September 3rd 2015]
The latest edition of the US National Snow and Ice Data Center’s Arctic Sea Ice News has just been published. In the section on the imminent minimum they show this graph:

and say that:
Starting with the ice extent observed on August 31 and then applying 2006 loss rates, the slowest rate in recent years, results in the highest extrapolated minimum for 2015 of 4.50 million square kilometers (1.74 million square miles), and a September monthly average extent of 4.59 million square kilometers (1.77 million square miles). The lowest daily minimum comes from using the 2010 pace, yielding an estimated 4.12 million square kilometers (1.67 million square miles) for the daily minimum, and a September monthly average extent of 4.33 million square kilometers (1.67 million square miles).
Using an average rate of ice loss from the most recent ten years gives a one-day minimum extent of 4.38 ± 0.11 million square kilometers (1.79 million square miles), and a September monthly average of 4.49 ± 0.09. As of August 31, the 5-day running daily average extent is 4.72 million square kilometers. If no further retreat occurred, 2015 would already be the sixth lowest daily ice extent in the satellite record.
The forecast places the upcoming daily sea ice minimum between third and fourth lowest, with fourth more likely. There is still a possibility that 2015 extent will be lower than 4.3 million square kilometers, the third lowest sea ice extent, surpassing the 2011 sea ice extent minimum, and a small chance of surpassing 2007, resulting in the second-lowest daily minimum. This assumes that we continue to have sea ice loss rates at least as fast as those of 2010. This was indeed the case for the final ten days of August 2015.
Somewhere between 2nd and 6th then! We felt compelled to enquire on Twitter:
What's the #probability of a 2nd place finish for @NSIDC_ArcticIce daily #SeaIce extent? http://t.co/z9jA7ydg07 pic.twitter.com/KqccwUNjQg
— Snow White (@GreatWhiteCon) September 3, 2015
Especially for Chilly, DMI extent has just been updated to Sept 1st:
It’s still above 2011!
thanks jim! i owe frivolousz21 on the asif an apology . he just made one of the most observant comments i have seen on there recently relating to snow cover .the difference between last year and this year initially appears strange considering the supposed extra year of increased ice volume posited by various models,until you take into account the huge difference in albedo between the two years.
i note your links to the uptempo bouy project.there is some good info there, but there are a lot of issues as well,to be expected in such a harsh environment. however the team are well aware of this and provide this information.
“These plots show satellite derived sea surface temperature from NOAA and ice concentration from NSIDC for the date stated. The 2.5m (or 0m when 2.5 does not exist) UpTempO temperatures are plotted and numbered. A gray dot indicates that the buoy is reporting an unrealistic ocean temperature value. “
The NSIDC’s 5 day averaged extent for September 1st looks like this:
whilst the 1 day extent is also now below both 2007 and 2011:
have a look at dmi temps above 80 degrees north jim. i am not able to post images here for some reason, no doubt my ineptitude with computers is the cause. you will see the first big pulse of energy given off from a wide scale refreeze. not as early as last year, but a lot earlier than the immediate years previous to that.
hopefully further storms will maintain as much open water as possible as it continues to cool. the more energy lost to space from open water the better for the ice.
it will be worth paying attention to the refreeze as the amo has definitely flipped into the cool phase and the el nino,despite much reference all over the blogosphere to “strong el nino conditions” , as i predicted a long time ago is petering out.
looking at southern hemisphere ocean temperatures,particularly in the atlantic, i am really surprised there is not much being made of the vast areas of negative anomalies surface temperature wise. it really is quite remarkable. lets hope the oceans in the northern hemisphere do not follow suit or my blog posting moniker will be the most apt on the net !
Here you go Chilly:
If you want to include an image in a comment you’ll need to wrap it inside HTML “img” tags:
http://www.w3schools.com/tags/tag_img.asp
thanks jim.
Both GFS and ECMWF now show a 990 hPa low over the Central Arctic at the weekend:
The timing is a bit different though:
A nice “false colour” MODIS image from the Aqua satellite of the current low pressure area spinning over the “Laptev Bite”:
Doing some more due diligence I’ve just stumbled across what seems to be a MASIE based extent comparison chart:
This also shows 2015 as second lowest after 2012.
would you prefer to use that as the bet metric rather than ct area jim. i am quite happy to give you the very best chance of winning .after 2013 and 14 it is quite clear that there is no direct plunge to an ice free state happening though i think we will need to see another 5 years of summers to see if the trend for less sea ice at minimum is changing.
i
I’ll stick with area Chilly, but if you want to add MASIE extent to the list of metrics to check for <1 mio I certainly won't object!
Today’s hindcast of some significant swell off Siberia:
Plus three cyclones in the Nprth Pacific!
it will be interesting to watch the surface temperatures in those storm tracks jim. they will remove a lot of heat from the surface as they travel over the ocean ,what will that do to the blob ?
with the ice cover being so low on the pacific side there is a lot of open water there to radiate heat to space as we move towards refreeze . any sustained wave/swell action from storms at this time of year may inhibit ice growth in the region,preventing the ice from insulating the near surface layers that would otherwise prevent this radiation.
do you know what the average day of the year for refreeze to begin in the various areas on the pacific side is jim ?
Following last week’s cyclone JAXA extent has experienced a brief “hiatus”! It is now tracking just above 2011:
Cryosphere Today area has now reached September 4th, and is in amongst a large pack of “post 2007” years that are all well behind 2012:
another question ! how accurate do you think the piomas volume modeling is jim. it looks as though volume has increased significantly since 2012 on their chart. does this look physically possible in light of this years melt ?
the track of polarstern deviating from what i think was original course to avoid thick ice might suggest those groups positing mostly first year ice on that side of the pole may not be correct which would add a fair amount to volume, but still the volume melt does not seem to reflect anything close to extent reduction.
Personally I take PIOMAS with a pinch of salt Chilly.
Nonetheless I note that Caleb is spouting ballcocks on the topic below Anthony Watts’ latest Arctic prognostications. Would you mind bringing the attention of the WUWT denizens to this correction of mine?
For some strange reason it’s currently invisible!
That’s the first comment of mine that’s made it out of WUWT’s moderation queue in months!
https://archive.is/amYpJ#selection-1629.1-1629.31
Following another brief “hiatus” JAXA extent has now fallen below the 2011 minimum value of 4,269,199 square kilometres, and is thus guaranteed at least “third place” this year:
In the latest edition of Arctic Sea Ice News the NSIDC say that:
They also hedge their bets slightly by adding that:
now we are into refreeze season how about a higher or lower than 2014 extent prediction for 2016 minimum jim ? i am guessing you will say lower, i will say extent will be greater than 2014 ,just for fun,no betting on this one.
You guessed right Chilly.
At this very early stage in the 2016 melting season I’ll plump for lower than 2014, just to make things interesting. At the end of the day (or should that be the end of summer?) it does of course all depend on the weather between now and then.
i think it depends on a lot more than the weather jim. i read a very interesting comment on the effects of coronal holes on the sun upon the atmosphere above the arctic. think what happened during the 2013 melt season , was this a contributor to the lower than expected melt ?
A good example happened in March 2013. Sunspot No 1692 emitted a long duration (36 minutes) M1 type flare on March 15 which was directly aimed at Earth’s northern hemisphere. It impacted on March 17 and produced fantastic auroras. By March 20 the stratospheric temperature at the North Pole had increased by 60 deg C, the westerly polar vortex had become easterly and an enormous high pressure system became centered over Greenland. It was the highest recorded over Greenland and second highest ever recorded anywhere. The pressure on the North American continent supposedly caused the ionosphere to light up above the New Madrid fault line and the San Andreas fault line but fortunately nothing happened to those fault lines then. The Arctic Oscillation index went below -5 on March 19 and stayed below -5 for 3 days. The only other times it had been below -5 for 3 days occurred in Feb 1969, March 1970, Dec 2009 and Feb 2010.
The reason why there was such a reaction to the CME was that magnetic field lines of the sun and earth joined as the plasma reached earth and for a short period channeled many hundreds of tons of the stuff into the north pole ionosphere. These types of connections seem to be occurring frequently and with the increased presence of coronal holes pumping lots of relatively high energy plasma into space there are interesting changes occurring in our space weather.
I remember events in early 2013 differently Chilly. There was a sudden stratospheric warming early in the year:
which messed up the polar vortex in January:
Things in the stratosphere seem to have settled down by March 20th though?
“The Arctic Oscillation index went below -5 on March 19”
I’ve just come across an explanatory video by a PhD student at Exeter University that mentions things like the “polar vortex” and “sudden stratospheric warming” and the “Arctic Oscillation index”.
Here it is for your edification:
and here’s the current state of the aforementioned AO index and the NH polar vortex:
Mind you it’s a bit chilly here today, but at least it’s stopped raining!